

One of the challenges in determining the impact of any dietary intervention is to know the extent to which study participants follow the specific recommendations of the study protocol; this is defined as adherence. If the intervention is not carried out as designed and participants are not adhering to the dietary protocol, the results will be difficult to interpret. Adequate adherence measures must thus be in place to assure the validity of the results( Reference Vitolins, Rand and Rapp 1 ). Consequently, investigators must determine what adherence measures to employ, weighing such factors as size and characteristics of their sample, cost, and most importantly which methods are applicable to their specific study.
Most studies use process evaluations to provide some insight: was the health or nutrition behavioural intervention implemented as designed and did the target group fully receive the intervention?( Reference Baranowski and Jago 2 , Reference Lee, Contento and Koch 3 ). Level of implementation can be conceptualized as consisting of two factors: (i) degree of completeness of the implementation and (ii) fidelity to the behavioural intervention curriculum. Level of reception is measured as attendance and degree of engagement of the participants. However, it is important to ask further: did the study participants adhere to the protocol? That is, did they make the behavioural changes that are needed to examine the intervention's physiological outcomes? The present study examines this question.
The majority of randomized dietary intervention studies with women involve participants who are medically at risk or already diagnosed with one or more chronic conditions( Reference Lin, Appel and Funk 4 – Reference Schatzkin, Lanza and Corle 9 ). There have been few clinical or intervention trials with non-at-risk, healthy, free-living women who regularly prepare food for themselves. One study with healthy perimenopausal women focused on reducing fat in the diet and increasing exercise( Reference Simkin-Silverman, Wing and Hansen 10 ) and a large study with healthy postmenopausal women focused on reducing fat intake to below 20 % and increasing consumption of fruits, vegetables and grains( Reference Howard, Van Horn and Hsia 11 ).
Dietary guidance has increasingly encouraged eating a plant-based diet that focuses on whole foods, in particular fresh fruits and vegetables and whole grains( 12 ). There is also increased attention to a focus on eating patterns, not just individual foods( 12 ). The Comparing Healthy Options in Cooking and Eating (CHOICE) Project was a randomized clinical trial of healthy postmenopausal women to evaluate whether a whole foods eating pattern, high in plant-based phyto-oestrogens, affected risk factors for heart disease, breast cancer or osteoporosis. Participants were randomized to one of three eating patterns: (i) the Whole Foods plant-based, near-vegetarian, macrobiotic-style diet; (ii) a Moderate Fat pattern without added flaxseed( 12 , 13 ); or (iii) Moderate Fat with added flaxseed to increase phyto-oestrogens without changing the basic structure of the diet. Following a 4-month intensive dietary intervention involving behavioural sessions and cooking, the participants remained on their respective eating plans for an additional 8 months of maintenance.
The purpose of the study reported here is to examine the degree of dietary adherence in the year-long CHOICE intervention and to identity demographic, psychosocial and study characteristics associated with adherence.
Methods
Participants
Inclusion criteria were that participants be healthy women aged 50–72 years, at least 5 years since their last menstrual period, with a BMI between 18 and 30 kg/m2, not on hormone replacement therapy for the past 2 months, and not currently on a vegetarian diet or one high in fibre or soya. The study was approved by the Institutional Review Board of Columbia University and informed consent was obtained from each study participant.
Recruitment and screening
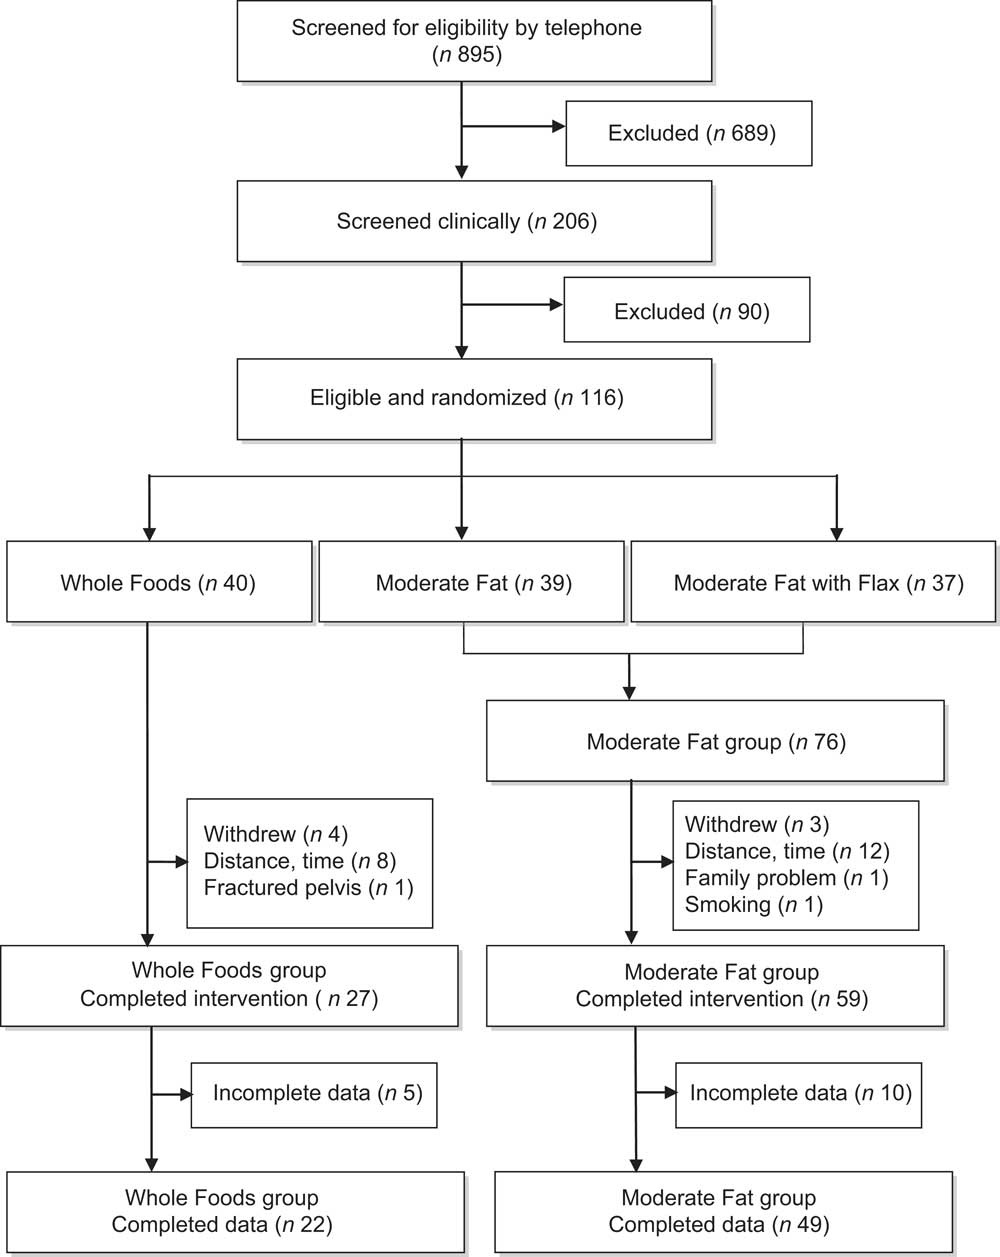
Women were recruited from the greater New York City area through advertisements on city buses, in movie theatres and community newspapers, on the radio and through flyers placed in strategic locations. Initial screening was done by telephone, after which potential study participants came in for two clinical visits to establish eligibility: 895 were screened by telephone, yielding 206 who met the eligibility criteria listed above and were clinically screened. Of these, 116 met the criteria of absence of physiological indicators of disease and were eligible for the study as shown in Fig. 1. When twenty to twenty-five women had been screened and deemed eligible for enrolment, they were randomized to one of the three eating plans and started the study. Eighty-six completed the study, with most dropping out after the first session, giving time and distance to the study site as the main reasons. They did not differ from those who stayed in the programme on any baseline characteristics.
Recruitment, assessment and retention of participants in the Comparing Healthy Options in Cooking and Eating (CHOICE) Study
Eating patterns
The three eating patterns were as follows: (i) The Whole Foods plan was a predominantly vegetarian diet, high in foods rich in phyto-oestrogens and based on macrobiotic principles. The principal focus was on the consumption of minimally processed, whole foods, preferably organically grown; (ii) The Food Power eating plan was a moderate-fat diet conforming to the recommendations of the American Heart Association( 13 ) and 2005 MyPyramid( 14 ) that focused on the substitution of foods lower in fat for those high in saturated fat within the context of a balanced diet. For the breads, cereals and pasta group, the participants were advised that not more than half of the servings should be whole grains for the purposes of the study, to distinguish it from the Whole Foods eating plan. This is the minimum recommended by the government's national health policy documents; (iii) The Flax Plus eating plan was based on the same moderate-fat diet, with 10 g of ground flaxseed added daily. Because the Food Power and Flax Plus eating patterns per se were identical, the groups were combined for data analysis and referred to as the Moderate Fat group. The eating guidelines are shown in Table 1.
Summary of recommendations for eating plansFootnote *
* ‘Servings’ are serving sizes as stated in MyPyramid/MyPlate (www.ChooseMyPlate.gov).
Nutrition behaviour intervention
The behavioural intervention was based on social cognitive theory( Reference Bandura 15 , Reference Bandura 16 ) and used many educational and motivational techniques, goal-setting, behavioural self-regulation and self-management strategies from related cognitive-behavioural, self-efficacy and self-control theories to encourage participants to adhere to their assigned dietary protocols( Reference Cullen, Baranowski and Smith 17 – Reference Norman, Abraham and Conner 21 ). Lesson plans were designed according to the stepwise nutrition education planning procedure of Contento( Reference Contento 22 ).
During the first 14 weeks of the intervention each group met weekly, with behavioural sessions alternating with cooking classes offering hands-on experience in a fully equipped teaching kitchen. The aim of these classes was to enhance the motivation of participants to eat according to their assigned plan and to teach the skills necessary to prepare foods according to that plan. Biweekly behavioural sessions that included food demonstrations and tastings were held for the next 2 months, and then monthly for the remaining 6 months of the trial. Each session focused on reviewing progress made, trouble-shooting, individual goal-setting and the development of ‘action plans’. Additional features included a monthly newsletter sent to participants during the 6 months of monthly sessions; incentives, such as a chef's knife; and a small monetary stipend at 6 and 12 months.
Dietary intake measures
Participants received unannounced calls for 24 h recalls monthly to enhance adherence as well as provide data about food intake. These were conducted by a nutritionist especially trained to use the Nutrition Data System for Research (NDS-R) software( 23 ). This software application allows entry of dietary data in a highly standardized fashion and performs nutrient calculations.
Non-adherence score
Because of the significant differences between the demands of the two eating patterns, it seemed essential to devise a common scale, or metric, to compare how successfully the two groups followed their respective dietary recommendations. One option for scoring adherence was to look only at how many servings of recommended foods were eaten and ignore those foods eaten that participants had been specifically asked to avoid. However, this would not offer a complete picture of how participants, especially those in the Whole Foods group, dealt with the full spectrum of eating plan requirements, not just individual foods.
Another challenge was how to incorporate the goal that the Moderate Fat group reduce energy intake from fat to 30 % or below. Using the NDS-R reports, it was possible to calculate servings of fat greater than 30 %, which would be a more precise measure of adherence than simply indicating compliance or non–compliance. This calculation was done by taking the percentage of fat greater than 30 %, converting the percentage to a decimal and multiplying it by the total number of calories consumed that day. This number represented the number of fat calories consumed above the daily recommendation and was then divided by 125, the number of calories in one tablespoon or serving of fat, to give the number of non-adherent fat servings( 24 ).
Finally, in terms of recommended foods, there was the question of whether to give credit for additional servings of recommended foods. Doing so could give a participant the false appearance of good adherence when servings of some other recommended foods might have been below the recommended number or totally avoided. For all these reasons, it was decided that the most meaningful way to compare the success of participants in the two eating patterns would be using a measure of non-adherence as presented in Table 2. Thus, in the present study, servings of both specifically recommended foods and specifically not recommended foods were used in calculating the non-adherence score, which is the number of non-adherent servings or servings out-of-compliance with the eating pattern's recommendations. In the formulas shown in Table 2, the actual number of servings of a food group consumed by a participant is subtracted from the recommended number of servings of that food group. Thus, no credit is given for eating more than the recommended number of servings of a given food. If a participant eats the recommended number of servings of each food group and none of the foods to be avoided, the resulting score will be 0, or full adherence. A non-adherence score greater than 0 indicates the number of non-adherent servings.
Calculation of non-adherence scores for the Whole Foods and Moderate Fat eating patterns
Serving sizes for foods are based on those in MyPyramid/MyPlate (www.ChooseMyPlate.gov); serving size for oils or fat is 1 tablespoon (125 kcal).
Interpretation of scores: 0 indicates perfect adherence and each point above 0 indicates one serving out-of-compliance, either one too few servings of a recommended food or one too many servings of a prohibited food.
*If more than the recommended number of servings was eaten, they were not counted in these calculations.
†Used in non-adherence score only if >30 %.
The 24 h food recalls were coded into eighteen non-overlapping food categories created to capture the recommended and non-recommended foods for both eating patterns. Serving sizes were based on standard serving sizes used in the US Department of Agriculture's MyPyramid/MyPlate( 14 , 24 ). Inter-rater reliability of the coding was determined by having a second nutritionist re-code a randomly selected thirty of the 24 h recalls.
Other measures
Demographic
Demographic data obtained at baseline included birth date, marital status ethnicity, race and educational attainment. Participants were weighed at baseline and every 3 months thereafter.
Psychosocial factors
A forty-item questionnaire about psychosocial factors related to cooking and eating, such as beliefs about behavioural outcomes (e.g. ‘controlling the amount of fat I eat is good for my health’), self-efficacy (e.g. ‘how confident are you that you can prepare tasty and low-fat dishes?’), barriers (e.g. ‘diets are difficult to follow when eating out’) and attitudes (‘I like the taste of beans’), was modified from a validated instrument( Reference Liou and Contento 25 ) by adding questions on cooking commonly used in studies (e.g. ‘I like to cook’; ‘I like to try new recipes’). The internal consistency of the variable scales in the present study were moderate, with most Cronbach's α coefficients ranging from 0·4 to 0·8, with two at about 0·06 and one 0·22. The questionnaire was administered to each participant at baseline, 6 months and 12 months to assess whether the psychosocial variables changed over the course of the intervention. It used a 4-point Likert scale.
Process evaluation measures
(i) Levels of implementation and reception. Completeness and fidelity to the behavioural intervention curriculum and degree of engagement of participants were measured with a check-off list after each session. (ii) Class attendance. Participants signed an attendance sheet at each class. If a participant missed a session, she was called the next day by the Nutrition Education Coordinator to arrange a make-up session.
Data analysis
All study data were coded and entered for computer analysis using the statistical software package SPSS version 16·0. Descriptive statistics and frequency distributions were calculated for all categories of data. All tests used an a priori defined 0·05 level of significance. Data on 24 h recalls were lost for fifteen women, spread evenly through the groups. These women did not differ significantly from the entire sample.
Change in servings of specific foods
A series of one-way repeated-measures ANOVA was carried out to evaluate changes in number of servings of recommended and non-recommended foods eaten from baseline through the adoption phase (first 4 months of the study) to the maintenance phase (remaining 8 months of the study).
Change in non-adherence scores
One-way repeated-measures ANOVA were also calculated on the means of the non-adherence scores to determine if there was a significant change over time within either of the two eating patterns at the three time points (i.e. baseline, adoption and maintenance).
Demographic factors
Descriptive analysis was carried out to see if there were differences in the demographic characteristics of the two groups at baseline: independent-sample t tests were used for continuous variables (i.e. age, weight) and χ 2 tests for categorical data (i.e. race, ethnicity, marital status, education).
Psychosocial factors
There was considerable co-linearity between the psychosocial variables. Data from the psychosocial questionnaire were thus further evaluated: several procedures were considered and hierarchical cluster analysis seemed the appropriate fit for these data, consisting of responses to individual items as observations( Reference Krebs, Berger and Ferligoj 26 , Reference Michie, Richardson and Johnston 27 ). Hierarchical cluster analysis generated a dendrogram that permitted an examination of the data at different hierarchies or tiers of clustering. Subsequent to the cluster analysis, the subgroups of items were submitted to an internal consistency analysis in order to estimate their reliabilities. Any item that showed a weak corrected item–total correlation (r ≤ 0·20) was deleted from its respective cluster. This process resulted in a dendrogram with several hierarchies or tiers of clusters. The most interpretable was a two-cluster solution that grouped the items into what could be described as a ‘positive’ cluster of responses and a ‘negative’ cluster. These were labelled ‘positive attitude’ and ‘negative attitude’. Following removal of those test items that did not correlate sufficiently strongly with the other items in the group, the internal consistency reliability estimate for the remaining items was α = 0·85 for positive attitude and α = 0·73 for negative attitude. A series of one-way repeated-measures ANOVA was used to examine the changes in attitudes over time.
Process measures
(i) Levels of implementation and reception were described but no further analyses were performed with them. (ii) The class attendance rates for the two groups were checked for correlation with the non-adherence scores and placed in the longitudinal regression analysis as covariates.
Predictors of non-adherence
A mixed-model analysis based on longitudinal regression that can incorporate both time-invariant predictors (such as age, race, ethnicity, marital status and education) and time-varying predictors (such as weight, attendance score and attitudes) was used to examine change in the trajectory of the non-adherence scores.
Results
Demographic characteristics
There were no significant differences between the Whole Foods (n 22) and Moderate Fat (n 49) groups in race (>70 % white in both groups), ethnicity (>80 % each group described themselves as non-Hispanic), marital status (more than a third in each group was married, another third separated, divorced or widowed, and the remainder never married) and BMI (25·8 kg/m2 for the Whole Foods group and 25·4 kg/m2 for the Moderate Fat group). Mean age of the participants was 57 years. The only significant difference (P < 0·05) was in educational attainment: 49 % of the Moderate Fat group had a degree post Bachelor's (18 % for the Whole Foods group).
Changes in servings of specific food groups eaten
Table 3 summarizes the changes in daily servings of major foods groups made by both participant groups. For both groups, the significant changes were generally made in the first 4 months of the intervention and were then maintained for the remaining 8 months.
Summary of changes in daily servings for major food groups in the Whole Foods and Moderate Fat eating pattern groups; Comparing Healthy Options in Cooking and Eating (CHOICE) Study
*Servings are MyPyramid/MyPlate serving sizes (www.MyPlate.gov).
†Significance based on one-way repeated-measures ANOVA.
‡n is sample size.
Changes in non-adherence scores
The greatest number of servings out-of-compliance in each group was at baseline, before the participants had been instructed in the recommendations of the specific eating pattern to which they were randomly assigned. The mean number of servings out-of-compliance at baseline for the Whole Foods group was 10·74 (sd 5·79), which decreased to 7·63 (sd 2·92) at adoption and 6·96 (sd 3·40) at maintenance; and for the Moderate Fat group, 8·40 (sd 2·81) at baseline, 5·77 (sd 1·93) at adoption and 5·52 (sd 2·02) at maintenance. Both groups significantly decreased servings out-of-compliance (P < 0·05), indicating increased adherence to the prescribed diet from baseline to adoption at 4 months and from baseline to maintenance at 12 months, but not from adoption to maintenance.
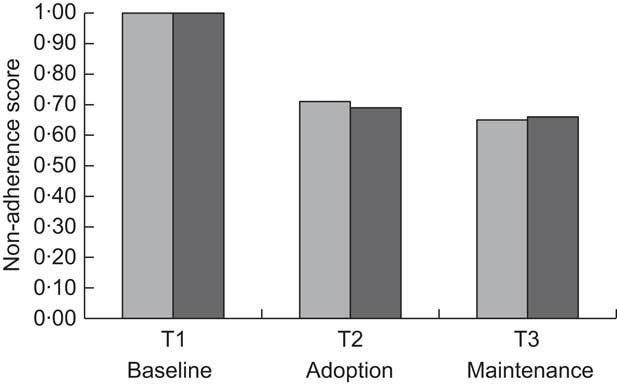
When the non-adherence scores are assigned to a starting score of one for both groups, it is possible to compare the change in scores for each group over time. Although the Whole Foods group had higher scores throughout (i.e. the participants were less adherent), they demonstrated a pattern of change quite similar to that of the Moderate Fat group, with a reduction from non-adherence of 100 % at baseline to about 65–70 % non-adherence (or 30–35 % adherence rate) at adoption, which was maintained. Figure 2 presents these data in graphical form.
Change in non-adherence scores over time: non-adherence scores at three time points compared with baseline* (![]() , Whole Foods group;
, Whole Foods group; ![]() , Moderate Fat group); Comparing Healthy Options in Cooking and Eating (CHOICE) Study. *Non-adherence score at baseline set as 1·00 for both eating patterns
, Moderate Fat group); Comparing Healthy Options in Cooking and Eating (CHOICE) Study. *Non-adherence score at baseline set as 1·00 for both eating patterns
Changes in weight-related factors
There was no significant change in mean weight or BMI from baseline to 12 months in either group.
Changes in psychosocial factors
There were no changes in attitudes over time (from baseline to maintenance).
Process evaluation measures
(i) The level of implementation was complete because the nutrition behaviour intervention was delivered by the researchers who had designed and piloted the intervention curriculum. Level of reception or participant engagement was also complete because the classes were devoted to cooking and discussions in which all participated. (ii) The class attendance scores for the Whole Foods and Moderate Fat groups during the adoption phase (first fourteen classes) were 89 % and 82 %, respectively (P < 0.05). The mean attendance scores for the remaining 8 months of the intervention were 82 % and 74 %, respectively.
Predictors of non-adherence
The results of the mixed-model analysis (presented in Tables 4 and 5) showed that none of the potential psychosocial and demographic predictors of change in non-adherence score for the Whole Foods group displayed a statistically significant relationship to the change in non-adherence score (all P > 0·05). In the Moderate Fat group, class attendance showed a trend towards significance (r = −0·37, P = 0.063), suggesting that increased class attendance might be negatively predictive of non-adherence; that is, a predictor of adherence.
Predicting change in non-adherence scores in the Whole Foods group; Comparing Healthy Options in Cooking and Eating (CHOICE) Study. Longitudinal regression model in which non-adherence is a time-varying dependent variable
*Age of participant.
†Race of participant (white v. other).
‡Ethnicity of participant (non-Hispanic v. other).
§Marital status of participant (married v. other).
∥Weight of participant over course of intervention.
¶Education of participant (high-school graduate; some college, vocational or business school; college graduate; advanced degree).
**Attendance at class sessions.
††‘Positive’ attitudes towards cooking and eating measured at baseline.
‡‡‘Negative’ attitudes towards cooking and eating measured at baseline.
§§This parameter is set to zero because it is redundant.
Predicting change in non-adherence scores in the Moderate Fat group; Comparing Healthy Options in Cooking and Eating (CHOICE) Study. Longitudinal regression model in which non-adherence is a time-varying dependent variable
*Age of participant.
†Race of participant (white v. other).
‡Ethnicity of participant (non-Hispanic v. other).
§Marital status of participant (married v. other).
∥Weight of participant over course of intervention.
¶Education of participant (high-school graduate; some college, vocational or business school; college graduate; advanced degree).
**Attendance at class sessions.
††‘Positive’ attitudes towards cooking and eating measured at baseline.
‡‡‘Negative’ attitudes towards cooking and eating measured at baseline.
§§This parameter is set to zero because it is redundant.
Discussion
To understand the health impact of a dietary intervention the targeted eating pattern must be achieved and maintained over the duration of the intervention. Indeed, it has been noted that the only consistent finding in the many intervention trials on weight loss and disease prevention is the degree of adherence to the programme goals for diet and physical activity( Reference Pagoto and Appelhans 28 ). A unique feature of the present study is that it describes a way to conceptualize and calculate adherence that can be used for interventions involving various eating patterns.
Adherence measures have been used in several prior dietary intervention studies but generally appear more limited in scope. In the Dietary Approaches to Stop Hypertension (DASH) study, where participants were provided with food( Reference Windhauser, Evans and McCullough 29 ), a score of 0 indicated no deviation from the study diet whereas a score of 1 or 2 indicated servings of study foods were missed or non-study foods were consumed. The nature of the foods omitted or consumed was not captured in the adherence score. In the Women's Healthy Eating and Living (WHEL) study, an adherence score was based on a limited number of foods from 24 h recalls where the total maximum score was 600 points: 50 % from vegetables and the other 50 % equally distributed among fruits, fibre and energy from fat( Reference Newman, Thomson and Rock 8 ). The adherence score in the current study is based on all major categories of foods from 24 h recalls, and involves an algorithm that incorporates the relative amounts of recommended foods as well as those to be avoided. That is, it takes into account all foods eaten as well as those foods recommended but not consumed. Because of its flexibility, this tool can be adapted for use in small and/or unique studies. Finally, the present study developed adherence scores that were unique to two different eating patterns. Using this comprehensive adherence score, the study was able to demonstrate the effectiveness of the intervention in terms of overall adherence to both eating patterns as well as specific foods eaten.
There has been increasing interest in assessing eating patterns, not just specific foods (e.g. fruits and vegetables) or nutrients (e.g. dietary fat). The Healthy Eating Index (HEI) developed to describe people's quality of diet and an alternate HEI (AHEI) consist of scores based on the intake of a pre-determined set of foods and nutrients. These scores have now been found to be highly predictive of chronic disease and mortality( Reference Belin, Greenland and Allison 30 – Reference de Koning, Chiuve and Fung 34 ). These observational studies suggest that patterns of food intake make an important contribution to health. These tools have not been used to date to monitor adherence in intervention trials. The current study provides an example of one way to develop a tailored adherence score that can be used as a rigorous process measure in a dietary intervention study.
The present study showed that healthy, free-living women were able to make significant changes in their eating patterns even when asked to adhere to a demanding diet for an entire year. Although they did not attain all of the goals set before them, for both groups, the critical period for change was during the first 4 months of the intervention (adoption phase) and these changes were maintained for the remaining 8 months (maintenance phase). This suggests that if specific goal-setting techniques, self-monitoring and action plans are used in the first few months, eating patterns may be maintained over the long term with less intense effort.
Despite the fact that women in the Whole Foods group were introduced to many new and unusual foods and were asked to follow an eating pattern somewhat different from societal norms, they were not required to purchase costly or hard-to-find food items to follow the recommended guidelines. The women in this group significantly increased their intake of beans to almost the recommended two servings daily and of whole grains to nearly four servings daily, one serving short of the daily recommendation. This was considerably higher than that achieved in the Women's Health Initiative Dietary Modification Trial (WHI-DM), which was one serving out of five for total grains( Reference de Koning, Chiuve and Fung 34 ). The vegetable intake of the Whole Foods group did not achieve the recommended five servings daily but remained slightly under four servings daily throughout the intervention along with one serving of fruit daily. The women in the Whole Foods group did better avoiding certain foods and significantly reduced their intakes of meat, poultry and eggs and their decrease in dairy showed a tendency towards significance. This suggests that people are able to reduce their intake of highly palatable foods if provided with motivation and skills.
Unlike the WHI-DM that excluded women whose baseline energy from dietary fat was less than 32 %, the current study had no such mandate. Forty-one per cent of the Moderate Fat group was already eating a diet with less than 30 % of energy from fat at baseline; 83 % of the remaining twenty-nine women (n 24) significantly reduced their energy intake from fat to 28 % (data not shown). The Moderate Fat group women also significantly increased their intake of specifically recommended foods (e.g. fruits and vegetables) and decreased some non-recommended foods (high-fat sweets). These results are similar to those of other studies( Reference Howard, Manson and Stefanick 35 ).
A review of dietary fat reduction studies concluded that those with the strictest recommendations met with the greatest success and that less demanding goals might actually be a disincentive to full compliance( Reference Barnard, Akhtar and Nicholson 36 ). It appears that this principle may have been at work with the Whole Foods group, who may have done well because of the demands of their diet, and the Moderate Fat group, who did not do better perhaps because they were not sufficiently challenged by their eating pattern.
Class attendance was higher for the Whole Foods group than the Moderate Fat group at all time points and this may be attributed to the ‘novelty factor’ of the diet and bonding within the group. Despite the higher attendance scores for the Whole Foods group, attendance was a predictor that approached significance in the longitudinal regression model for the Moderate Fat group but not the Whole Foods group. Increased class attendance has been shown to be a predictor of adherence in a number of studies( Reference Newman, Thomson and Rock 8 , Reference Urban, White and Anderson 18 , Reference Beresford, Johnson and Ritenbaugh 37 – Reference Wanke, Daston and Slonim 39 ) because it is in these classes that the behavioural component is imparted to participants. The small sample size and hence limited statistical power of the Whole Foods group (n 22) compared with the Moderate Fat group (n 49) may have masked results in the Whole Foods group.
It is noteworthy that participants in both food groups increased in adherence (or decreased in non-adherence) following an almost identical trajectory; that is, both groups reduced their non-adherent servings by similar proportions at both adoption and maintenance. Despite their more demanding diet, participants in the Whole Foods group were exposed to a diet that seemed quite exotic and they came to cooking classes excited about what new food or ingredient they would be introduced to that evening. For the Moderate Fat group, the cooking classes and preparation techniques were less interesting because the women were familiar with information about lower-fat foods.
An adherence rate of about 35 % for both groups may seem low, but the score is a very stringent measure as it considers the entire diet, looking at both omissions and additions to the recommended eating patterns. Few studies have taken into account the adherence rate to prescribed dietary protocols as they examine the impact of an intervention on clinical parameters. The results of the current study suggest that such an adherence analysis should be conducted routinely as part of intervention trials. Otherwise study results may be difficult to interpret.
A major limitation of the present study was the small sample size of the final eligible sample despite the large initial recruitment pool. In addition, the loss of 24 h dietary recall data from fifteen women, five from the Whole Foods group, resulted in power issues for the latter. Another limitation was reliance on self-reported dietary data with likely poor estimation of serving sizes. The participants were volunteers and hence may be expected to be more motivated than the general population. This is a limitation that the study shares with most intervention trials.
Strengths of the study were its randomized design, 12-month duration with an 8-month maintenance phase, its population of healthy free-living women, the examination of an eating pattern consisting primarily of plant-based foods high in phyto-oestrogens as well as a more traditional moderate-fat pattern, and the non-adherence score that permitted inclusion of the many disparate dietary recommendations of the eating patterns into one metric. The strength of the behavioural nutrition component of class sessions and hands-on cooking classes was demonstrated in that class attendance approached significance as a predictor of adherence.
An important implication for practice is that health-care providers should not hesitate to advise clients to make major changes in their diets if such changes are clinically indicated. Also, the apparent willingness of the Whole Foods group to decrease meat, poultry and eggs suggests that clients might find it helpful to include meatless meals when attempting to reduce their intake of fat.
The current study suggests some future directions for research. The method used in the study to develop an adherence score provides an example of how adherence scores might be created for the specific purposes of monitoring a given intervention. While eating pattern assessment tools such as the HEI can be considered measures of adherence, they are based on a predetermined set of foods. More research needs to be done on evaluating the usefulness of adherence scores tailored to specific intervention protocols. Given that in the present study the intervention was fully delivered as planned and participant engagement was high, the only variation in process variables was attendance. The adherence score can thus serve as a more rigorous process measure in clinical trials. The tremendous expense of most intervention studies demands increased efficiency and creative approaches. More studies need to look at which behavioural strategies might be particularly effective in increasing adherence rates, especially during maintenance. The time and expense of travel appear to have been deterrents to recruitment and possibly also retention in the current study and suggest that worksite interventions should be considered. Classes could be held at lunchtime with cooking demonstrations and the foods prepared then enjoyed by the participants. Employers might support the cost of such programmes with the expectation of improved health among their employees.
The 24 h recall data in the present study show how many meals participants ate away from home. Studies are needed to look at how to help people determine the ingredients of restaurant or take-out foods. Menu labelling policies being implemented are a start but better methods of determining portion size and nutrient values of composite foods are essential for both participants and nutrition professionals. An approach that shows great promise is photographing meals with smart phones before and after eating. These photographs can be analysed by dietitians for portion size and meal composition( Reference Williamson, Allen and Martin 40 , Reference Swanson 41 ) or they can be directly ‘beamed’ to a computer server in a central data collection point where a computer program can analyse the information( Reference Mariappan, Bosch and Zhua 42 , Reference Zhu, Bosch and Woo 43 ). This method of evaluating plate waste would also be useful in validating food recall data. Technology has much to offer that will aid nutrition education research in the future.
Conclusion
The current year-long study showed that healthy, postmenopausal women who had been randomized to one of three distinct eating patterns, the plant-based Whole Foods and the Moderate Fat with and without added flaxseed, could make significant changes in their diets during a 4-month behavioural intervention and were able to maintain these changes for the next 8 months. A particular strength of this intervention was the fact that the participants were community-dwelling, bought their own food and prepared at least some meals at home, so they had a 12-month real-life experience in following the study recommendations. Finally, a unique feature of the present study was that a non-adherence score was designed to capture how well the participants were able to follow the recommendations of their specific eating pattern. This approach can provide a model of how to develop a tailored tool to evaluate the impact of specific interventions on complex eating patterns.
Acknowledgements
Sources of funding: The study was supported by grant P50 AT00090 from the US National Institutes of Health (NIH), National Center for Complementary and Alternative Medicine (NCCAM). The US NIH, NCCAM had no role in the design, analysis or writing of this article. Conflicts of interest: The authors have no conflicts of interest. Authors’ contributions: All authors were directly involved in the conduct of the study and in the writing of the manuscript: N.C.P. and I.R.C. wrote the manuscript; F.K. reviewed and edited the manuscript; M.C. helped with data management and data analysis and reviewed and edited the manuscript. All authors were involved in the revision.


