


1 Introduction
Campidanese (also called Campidanian) Sardinian consonant lenition has featured prominently in debates over the nature of the constraint set and grammatical architecture in output-oriented phonology. Bolognesi (Reference Bolognesi1998) gives the most detailed English-language description of the Campidanese phonological system, along with an optimality-theoretic analysis, and that description has figured prominently in subsequent phonological work (e.g. Łubowicz Reference Łubowicz2002, Tessier Reference Tessier2004, Hayes & White Reference Hayes and White2015, Storme Reference Storme, Gallagher, Gouskova and Yin2018, Katz & Pitzanti Reference Katz and Pitzanti2019). The patterns Bolognesi describes are particularly problematic for output-oriented phonology, because of what Hayes & White (Reference Hayes and White2015) refer to as the ‘saltatory’ property: one set of consonants undergo changes to a number of features, while a similar set of consonants in the same phonological environment fail to undergo changes to just a subset of those features. This type of pattern cannot be analysed in output-oriented frameworks without fundamental changes to some component of the theory, and each of the works mentioned above proposes some such change. This paper argues that, whatever the independent merits of these theoretical approaches, any phonological account of Campidanese lenition misses important generalisations. In particular, Katz & Pitzanti's (Reference Katz and Pitzanti2019) acoustic study reveals several fundamental properties of Campidanese lenition that are difficult or impossible to capture in feature-based accounts: (i) duration- and intensity-based correlates of lenition extend to virtually all sounds in the language, not just those that show changes in voicing or continuancy; (ii) differences in intensity and manner associated with lenition are mostly predictable from differences in duration associated with lenition; (iii) differences in intensity and manner associated with different phonological features are not predictable from differences in duration associated with those features.
This paper develops a model in which Campidanese phonology derives a ‘normal’ phonological inventory, with no positional effects of fortition or lenition. Target durations for various sounds are then adjusted at the level of phrasal prosody, in a component of the grammar that ‘reads’ phonological features, but does not alter them. Changes in the characteristic duration and timing of a given sound have a probabilistic influence on degrees of undershoot and overlap with adjacent sounds, and variability along these dimensions is what causes lenition and fortition patterns. While the lengthening, undershoot and overlap phenomena are easiest to conceptualise in terms of gestural targets, they could also be conceived of as auditory in nature. The model is based on data from field recordings of Campidanese speakers, and simulations are presented that derive qualitative patterns similar to those observed in the data.
This study more generally concerns the type of characteristically intervocalic, sonority-increasing lenition referred to by Katz (Reference Katz2016) as ‘continuity lenition’. The conclusion is that continuity lenition processes are outside the phonological grammar in Campidanese, or at least the part of the phonology that pertains to computations over contrastive features. This is a rather different perspective from Katz's (Reference Katz2016) phonological approach, but has the potential to explain many of the same cross-linguistic generalisations about the lack of interactions between continuity lenition and phonological contrast (see also Gurevich Reference Gurevich2003) without the use of sui generis constraints.
The next section lays out the basics of Campidanese and the problem it poses for standard constraint-based approaches. §3 presents an abstract phonological analysis that derives basic patterns of contrast in Campidanese. §4 implements a detailed phonetic model that works on the outputs of the phonological component to derive lenition and fortition. §5 discusses the implications of that model in Campidanese and beyond.
2 The saltation problem
The Sardinian obstruent system changes systematically depending on the prosodic position under consideration. In this section, I hew closely to Bolognesi's (Reference Bolognesi1998) description, which has formed the basis for most of the later work discussed here. Some phonetic and phonological aspects of this description will be questioned later in the paper. The two prosodic contexts most relevant to lenition are utterance-initial and phrase-medial, word-initial positions. Utterance-internal post-pausal consonants behave similarly to utterance-initial ones, and initial consonants at phrasal levels above the word are variable, as discussed in more detail in §4. Basic lenition processes are illustrated in (1).
-
(1)

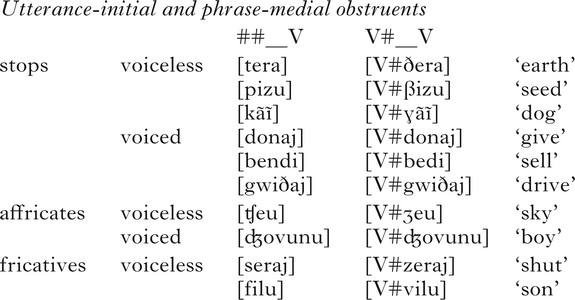
In utterance-initial or utterance-internal post-pausal positions, including citation forms, Campidanese displays voiced and voiceless stops and affricates, and voiceless fricatives. In word-initial position internal to a phrase, Bolognesi (Reference Bolognesi1998) describes all of these consonants as voiced, barring [s] in the exceptional determiner realised as [sa] or [su], and [ʦ], which tend to retain their voicelessness everywhere. Otherwise, sounds that are voiceless stops or affricates utterance-initially become voiced continuants here, as do the voiceless fricatives.
Bolognesi's (Reference Bolognesi1998) analysis of this system is that the underlying representations of these consonants are the forms they take on in utterance-initial position, while the forms they take on in phrase-medial position are derived from those URs by lenition, for the voiceless stops and fricatives only. These intervocalic lenition processes, voicing and spirantisation, are well-established across dozens of languages (see e.g. Kirchner Reference Kirchner1998, Lavoie Reference Lavoie2001). An interesting property of the Campidanese lenition system is that it ties together consonant length and strength (as in fortition, the inverse of lenition): sounds with lenis realisations phrase-medially tend to take on more fortis realisations at the beginnings of some prosodic domains, and these fortis realisations generally look like the geminate versions of such segments that appear word-medially (not shown in (1)). This observation has led to the question of whether non-lenition in initial positions is in some sense ‘the same’ as word-medial geminacy (Bolognesi Reference Bolognesi1998, Mereu Reference Mereu2020; see Ladd & Scobbie Reference Ladd and Scobbie2003 for the related Logudorese variety).
In this section, I focus on one outstanding problem that arises within this standard analysis: it requires us to posit lenition affecting the voicing and continuancy of voiceless stops and affricates, while voiced stops and affricates fail to undergo the less radical lenition of changing only continuancy. This has been referred to as a ‘saltatory’ pattern (Hayes & White Reference Hayes and White2015), because the voiceless stops ‘jump over’ the voiced ones to become voiced continuants. If voicing precedes spirantisation, this can also be considered a phonologically derived environment effect (Łubowicz Reference Łubowicz2002, Tessier Reference Tessier2004, Wolf Reference Wolf2008).
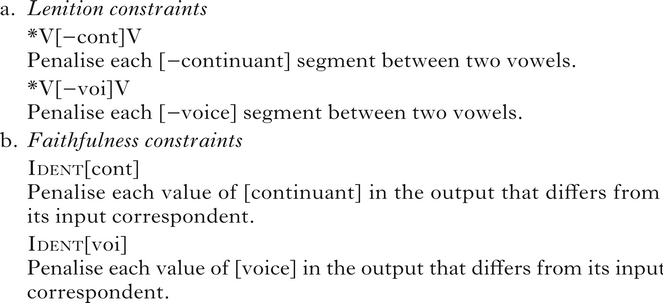
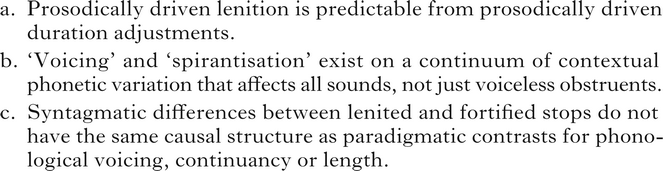
In rule-based approaches, one can simply write a combined spirantisation and voicing rule that applies to voiceless obstruents but not voiced ones. However, such a rule would be unusual and arbitrary: the Campidanese pattern is notable because it is cross-linguistically rare, and in many or most languages it is underlyingly voiced stops that are most susceptible to spirantisation (see e.g. Kirchner Reference Kirchner1998: 182). In OT, the problem becomes even clearer, because if the relevant lenition constraints are high-ranked enough to compel changes in voicing and continuancy, they are necessarily high-ranked enough to compel changes in continuancy alone. To illustrate this issue, I introduce some relevant constraints. For lenition, I assume two constraints that penalise voicelessness and non-continuancy between vowels. For faithfulness, I assume constraints against changing voicing and continuancy.
-
(2)
In order to derive lenition of voiceless stops in the medial context, the relevant lenition constraints must be ranked above the corresponding faithfulness constraints. Because those lenition constraints are positional, they fail to apply in the initial context, and faithfulness favours retaining the UR, as in (3).
-
(3)
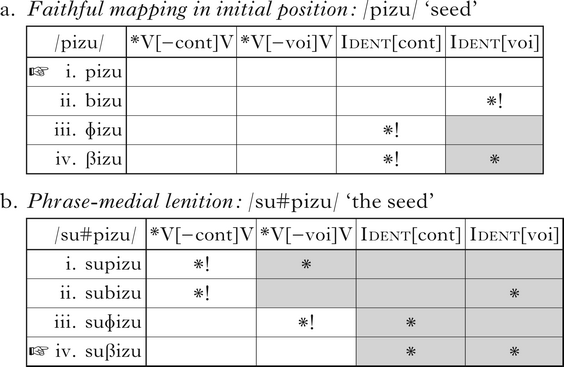
The same ranking, however, entails that underlying voiced stops will also lenite in phrase-medial position, as in (4b). If the markedness constraint against intervocalic stops outranks faithfulness to continuancy, there is no way to avoid this prediction within a standard OT framework.
-
(4)
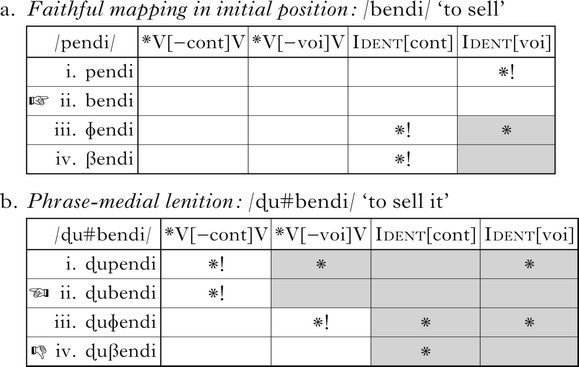
This, in a nutshell, is the saltation problem: lenition constraints must be ranked high enough to compel changes to voiceless stops, while somehow failing to compel the same changes to voiced stops. The pattern has been used to argue for a variety of wholesale changes to the OT constraint set and/or evaluation procedure, including constraints on systemic contrast (Bolognesi Reference Bolognesi1998, Tessier Reference Tessier2004), local conjunction of markedness and faithfulness (Łubowicz Reference Łubowicz2002), faithfulness targeting correspondence between natural classes (Hayes & White Reference Hayes and White2015) and perceptual ‘warping’ of faithfulness scales (Storme Reference Storme, Gallagher, Gouskova and Yin2018). This study will argue that none of these phonological theories is necessary or sufficient to describe the full system of Campidanese lenition and fortition. The principal reason is that lenition extends beyond the changes noted in the Bolognesi (Reference Bolognesi1998) description, and patterns in a fundamentally different way than changes in phonological features of any kind would predict (Katz & Pitzanti Reference Katz and Pitzanti2019). Each of the formal approaches outlined above, however, also has independent problems.
Hayes & White (Reference Hayes and White2015) illustrate in great detail some problematic predictions of the constraint conjunction and comparative markedness approaches, showing that they generate a large number of implausible grammars that favour marked structures over unmarked ones. They propose an approach using *Map constraints. The basics of their analysis are that: (i) faithfulness constraints may penalise any set of input–output mappings, not limited to changes in individual features; (ii) there is an inherent bias for more perceptually distant mappings to be dispreferred; (iii) those biases can be overcome by sufficient positive evidence from linguistic input. The proposal is that the disfavoured saltatory mapping of voiceless stops to voiced fricatives in the absence of voiced stop lenition can be acquired by promoting an inherently low-ranked faithfulness constraint above an inherently high-ranked one (e.g. */d/→[ð] over */t/→[ð]). While this does solve the immediate problem of getting voiceless stops but not voiced ones to lenite, it also comes at a cost. To deal with strident fricatives, which exist in Campidanese but never alternate with stops, the approach will require a large number of faithfulness constraints, of different granularities (e.g. strident fricatives vs. all fricatives), and a number of additional ‘exceptional’ rankings. While perceptual considerations are said to mediate the ranking of faithfulness constraints pertaining to specific manners of consonant, it's harder to see how this would work with natural classes of different granularities. To deal with sandhi phenomena (discussed in §3.3.2), the approach will require faithfulness constraints on mappings between every feasible cluster, geminate and singleton.
An overarching issue with this approach is that faithfulness constraints refer to natural classes rather than features. This is a problem because the relationship between a number of features and the number of natural classes that can be defined using any or all of those features is non-polynomial. For n features, there are n Ident constraints needed to govern mappings for those features. In contrast, two features can define eight natural classes (because either feature can be specified in the absence of the other), three features can define 26 and four features can define 80. In general, for n features, there will be 3n ― 1 possible natural classes with some or all features specified. The number of faithfulness constraints needed to assess mappings that are the Cartesian product of two (or more) such sets of natural classes will necessarily grow in exponential terms as a function of the number of features considered. This enormous set of constraints will potentially need to be multiplied across all prosodic and segmental contexts that may be relevant to phonology.
This is less of an issue for markedness constraints, which must also reference natural classes. There are principled, grounded approaches to markedness constraint induction that can help mitigate the problem (Hayes Reference Hayes, Darnell, Moravcsik, Newmeyer, Noonan and Wheatley1999, Hayes & Steriade Reference Hayes, Steriade, Hayes, Kirchner and Steriade2004). It is not clear that those approaches can help with faithfulness: it is a general axiom of the OT approach that any non-faithful mapping must be penalised by some constraint; otherwise, we would expect gratuitous feature-changing operations not subject to any phonological motivation. In the remainder of this paper, I develop an analysis of Campidanese lenition that doesn't use *Map constraints, or any other phonological constraints, to condition or constrain lenition. Instead, lenition is modelled as a prosodic process that applies to the outputs of phonology. To understand why this alternative is not just viable, but also necessary, we must review the phonetics of Campidanese consonants in more detail.
3 A modular approach to Campidanese lenition
The preceding section was meant to show that phonological approaches to Campidanese lenition run into significant problems even on their own terms, where those terms are essentially Bolognesi's (Reference Bolognesi1998) categorical description of the lenition system. As a first step towards resolving these difficulties, however, it should be noted that Bolognesi's description is incomplete in several respects. Some properties of the lenition system that are missing in that description, moreover, are not specific to Sardinian: they have parallels, to varying degrees, in other languages and language families. As such, taking these facts into account is necessary not only for a satisfactory description of Campidanese lenition, but also for situating the Campidanese system in its typological context.
3.1 The phonetics of lenition in Campidanese and beyond
Bolognesi's (Reference Bolognesi1998) description says that voiced stops never spirantise. But other descriptions of Campidanese either state (Virdis Reference Virdis1978, Katz & Pitzanti Reference Katz and Pitzanti2019) or implicitly show (Blasco Ferrer Reference Blasco Ferrer1984, Frigeni Reference Frigeni2009, Cossu Reference Cossu2013) that phrase-medial voiced stops do sometimes spirantise. They appear to do so somewhat less often than underlying voiceless stops, so there is still a kind of saltation problem, but it is not the case that underlying voiced stops are unaffected by lenition pressure. When the voiced stops do lenite, they are qualitatively similar to the lenited versions of the ‘voiceless’ series (which are not voiceless in this context). Katz & Pitzanti (Reference Katz and Pitzanti2019) show that the two series are distinguished by average differences in duration and intensity even when only lenited realisations are considered: the underlying voiced series is longer and shows a larger drop in intensity during closure on average, though there is phonetic overlap between categories.
A second issue has to do with the output of lenition. Lenited stops are most often realised as phonetically short approximants, the majority of which have clear formant structure and no visible or audible frication (Katz & Pitzanti Reference Katz and Pitzanti2019). This is unsurprising: although intervocalic lenition of this type is traditionally referred to as ‘spirantisation’, most studies that examine the phonetics of these segments find that they are approximants. This is true in many or most varieties of Spanish (Martinez Celdran Reference Martínez Celdrán1984, Hualde et al. Reference Hualde, Simonet and Nadeu2011, Carrasco et al. Reference Carrasco, Hualde and Simonet2012, Figueroa Candia Reference Figueroa Candia2016, Broś et al. Reference Broś, Żygis, Sikorski and Wołłejko2021), Logudorese Sardinian (Ladd & Scobbie Reference Ladd and Scobbie2003), American English (Bouavichith & Davidson Reference Bouavichith and Davidson2013), Gurindji (Ennever et al. Reference Ennever, Meakins and Round2017), Iwaidja (Shaw et al. Reference Shaw, Carignan, Agostini, Mailhammer, Harvey and Derrick2020), Kinande (Katz Reference Katz2016), Bardi (Kakadelis Reference Kakadelis2018), Yoloxóchitl Mixtec (DiCanio et al. Reference DiCanio, Chen, Benn, Amith and Garcíams) and possibly Rome Italian (Hualde & Nadeu Reference Hualde and Nadeu2011).
The analysis in the following sections treats most surface short approximants as underlying voiceless (or unspecified) stops, in line with previous accounts. But nothing in the language or in the theory proposed here rules out the idea that it is the short approximants that are underlying, with stop realisations derived from fortition in initial positions. In §5, I tentatively propose that these segments are more fruitfully analysed as extremely short or even ballistic, lacking targets for sustained closure.
A third issue pertains to the systematicity of lenition. While lenition of voiceless stops may be particularly salient because of changes in voicing and continuancy, it is part of a much more general pattern of prosodically conditioned weakening and shortening in Campidanese. Fricatives are subject to voicing lenition. Katz & Pitzanti (Reference Katz and Pitzanti2019) show that nasals, liquids and vowel-to-vowel transitions also display durational shortening and/or higher intensity internal to at least one type of prosodic constituent. They find that word-medial segments described as geminates also show some degree of lenition, in a few cases as extreme as the singleton segments. Again, this systematicity is probably not an unusual feature of continuity lenition, although there is not a large body of phonetic research in this regard. Kingston (Reference Kingston, Colantoni and Steele2008) finds the same systematicity of lenition throughout the obstruent system of Peruvian and Ecuadorian Spanish. American English shows a host of different lenition processes for obstruents in tapping contexts (Browman & Goldstein Reference Browman and Goldstein1992, Turk Reference Turk1993), which are matched by lenition-like laryngeal adjustments that parallel the distribution and duration of laryngeal segments (Browman & Goldstein Reference Browman and Goldstein1992, Pierrehumbert & Talkin Reference Pierrehumbert, Talkin, Docherty and Robert Ladd1992, Davis & Cho Reference Davis and Cho2003). The ‘initial strengthening’ literature reports shortening and/or weakening internal to prosodic constituents for not only obstruents, but also nasals in English (Fougeron & Keating Reference Fougeron and Keating1997), French (Keating et al. Reference Keating, Cho, Fougeron and Hsu2003), Taiwanese (Keating et al. 2003) and Estonian (Gordon Reference Gordon1996). So, whatever the correct account of continuity lenition, it should not be limited to particular obstruents or phonological features.
One might defend a phonological analysis by saying that the initial strengthening phenomena referenced above are phonetic, while obstruent lenition changes phonological features such as [voice] and [continuant]. There are two reasons why this is not viable. First, Katz & Pitzanti (Reference Katz and Pitzanti2019) show that prosodically conditioned differences in manner for Campidanese consonants (i.e. lenition) can largely be predicted by prosodically conditioned differences in duration. The same is not true for differences conditioned by UR contrasts in features like voicing, continuancy or length. The finding that leniting changes in manner are predictable from shortening extends to Itunyoso Trique (DiCanio Reference DiCanio2012), Yoloxóchitl Mixtec (DiCanio et al. Reference DiCanio, Chen, Benn, Amith and Garcíams), American English (Cohen Priva & Gleason Reference Cohen2020, Parrell & Narayanan Reference Parrell and Narayanan2018), Gurindji (Ennever et al. Reference Ennever, Meakins and Round2017) and, arguably, some varieties of Spanish (Parrell Reference Parrell2011, Parrell & Narayanan Reference Parrell and Narayanan2018). So treating synchronic intervocalic obstruent lenition as a change in phonological features makes the wrong predictions about how it should be phonetically implemented. A second problem is that continuity lenition is almost always anti-structure-preserving. That is, the voicing and continuancy features targeted by continuity lenition in a particular language are almost never contrastive in that language (Gurevich Reference Gurevich2003, Katz Reference Katz2016). This is unexplained if lenition changes phonological features.
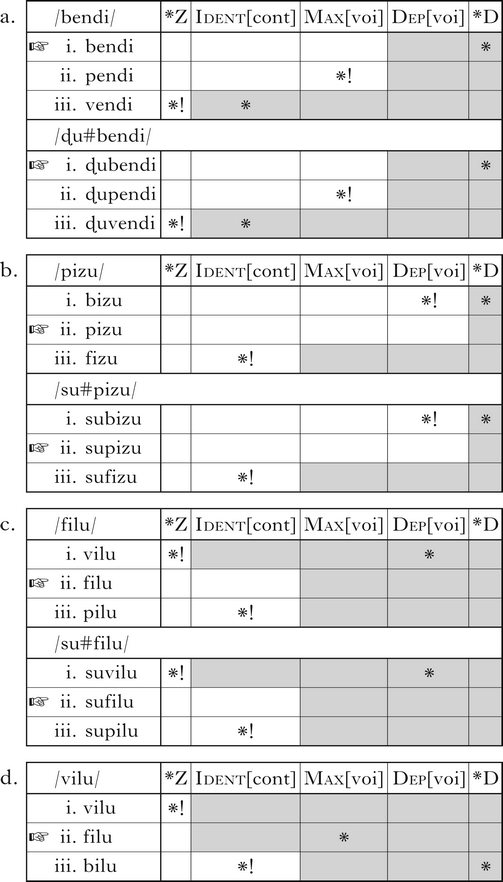
For all of these reasons, a different approach to Campidanese lenition is required. In particular, a satisfactory theory must capture the properties in (5).
-
(5)
The remainder of this paper develops a model that captures these generalisations. The model assigns durations to natural classes that are the output of segmental phonology, deriving continuous and variable manner parameters from those durations. Prosodically driven variation in the phonetic correlates of manner is not limited to one type of sound, because duration adjustments are a global property of prosodic structure pertaining to all sounds. And prosodically driven differences in manner don't work like changes in phonological features, because the relationship between duration and manner is different for sounds with different phonological features. The model can produce phonetic overlap between different phonological classes, but not phonological neutralisation, because it does not change phonological features.
3.2 Basic phonology of singletons
I begin with singleton obstruents in phrase-medial, phrase-initial and utterance-initial positions. Katz & Pitzanti (Reference Katz and Pitzanti2019) show that there is a duration boost at the beginnings of higher prosodic domains, and that those boosts largely suffice to predict differences in manner associated with prosodic position (i.e. lenition). As such, this analysis will not derive lenition in the phonological component: the system of contrasts remains the same in any word-initial position, regardless of higher-level prosodic constituents. Instead, a relatively abstract phonology derives features and contrasts, while the prosodic component implements phrasal lenition and fortition patterns based on those features. In what follows, phonological outputs are notated in IPA without any lenition; this is not phonetically accurate, but captures patterns of contrast. The analysis here is couched in OT, with limited phonetic detail in constraints. This is in part because much of the prior literature on Campidanese uses OT, and in part because I hope to meet the relatively ambitious goal of describing patterns of consonantal contrast in terms of plausible cross-linguistically motivated constraints on sound patterns.
The output of the phonology in phrase-medial, word-initial position includes stops and fricatives unspecified for voicing, as well as voiced stops. Nothing crucially hinges on voicelessness being unspecified, but it fits rather well with the phonetic facts explored later. This entails a privative voicing feature, with featural Max and Dep constraints fulfilling the faithfulness function. I notate obstruents unspecified for voicing with the IPA characters corresponding to voiceless obstruents, and refer to them as ‘voiceless’ in the text. Markedness constraints against voiced fricatives and voiced stops are notated as *Z and *D respectively. Ident[cont] penalises mappings between stops and fricatives. Outputs in initial positions are shown in (6). Utterance-initial and medial word-initial positions behave identically, as shown in (a–c). There are no prosodic effects in this component.Footnote 1
-
(6)
So far, there is nothing particularly complex or unexpected here. This grammar derives stops and voiceless fricatives, but no voiced fricatives, and has no lenition or fortition patterns. The general inventory pattern of voiced and voiceless stops but only voiceless fricatives is widely attested, for instance in Camsá (Howard Reference Howard and Elson1967), Muniche (Michael et al. Reference Michael, Farmer, Finley, Beier and Acosta2013) and Shodon (Martin Reference Martin1970).
3.3 Geminates and clusters
The preceding section laid out the basic obstruent contrasts in Campidanese. I have not yet addressed most of the complexity of the phonological grammar, however. In this section I attempt to model several increasingly complex patterns in an abstract phonological framework. §4 will show how the phonetic implementation grammar affects the outputs of that system.
3.3.1 Underlying geminates
Underlying Campidanese geminates are licensed word-medially between vowels or approximants, but not at word-edges, regardless of the surrounding segments. This is a common pattern cross-linguistically, broadly similar to Italian (Bertinetto & Loporcaro Reference Bertinetto and Loporcaro2005), Japanese (Kawahara Reference Kawahara and Kubozono2015) and Bengali (Hankamer et al. Reference Hankamer, Lahiri and Koreman1989). The actual system of contrasts word-medially is somewhat unclear, because many or most singleton obstruents are approximantised. The result is that phonetically there is a short lenis approximant series, a longer voiced stop series and an even longer voiceless stop series. Phonologically, I treat the short lenis series as singleton voiceless stops, the longer voiced stop series as singleton voiced stops and the longest voiceless stop series as geminate voiceless stops. This is illustrated in (7), along with other geminate/singleton oppositions.
-
(7)
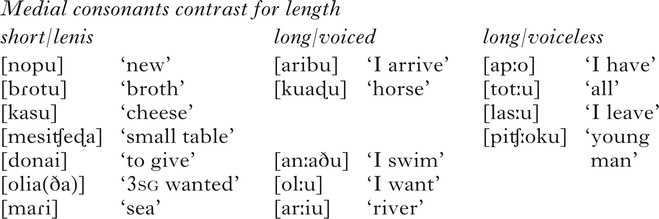
I again use a heavily abstracted IPA notation to represent phonological outputs, which does not capture certain aspects of phonetic realisation; this will be addressed in §4. The short lenis category of stops is almost always approximantised, the short lenis fricatives and affricate are usually voiced, the short lenis nasals are often only weakly consonantal and historic singleton /l/ from Latin is generally realised word-medially as a bilabial approximant, though it is not clear whether this is a synchronic alternation or whether the UR has changed to /p/. The long voiced stops are realised as approximants about half the time. And even the long voiceless series sometimes voice and/or approximantise.
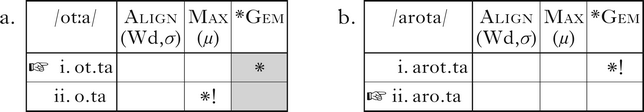
There are a number of theoretical approaches that are intended to capture the distributional properties of geminates. The analysis here adopts the theory of underlying moraicity (Hayes Reference Hayes1989, Davis Reference Davis, Goldsmith, Riggle and Yu2011). Because syllable weight does not figure in this analysis, however, it could likely be recreated using other approaches. Crucial assumptions are that: (i) geminates are underlyingly moraic, (ii) moras must occupy a coda position in the output of the phonology and (iii) surface geminates span syllable boundaries. A number of other parameters need to be set in order to produce an analysis, but the specific settings are not crucial. I ignore output candidates with moras in non-coda positions, or with moraic geminates that occupy a coda but not an onset position. These are likely subject to violable constraints cross-linguistically (Topintzi Reference Topintzi2008), but they are never violated in the particular case examined here. I assume that shortening a UR geminate violates a constraint against deleting input moras, Max(μ), and that there is a markedness constraint against output geminates, *Gem. And I assume that syllabifying a geminate across a word boundary violates some alignment constraint. Here, the constraint is formulated as Align(Wd, σ): every word in the output is aligned with syllable boundaries at its beginning and end. Such constraints are usually targeted to the beginning or ending of domains (‘left’ or ‘right’), but this distinction is not necessary for the current analysis.
The licensing of geminate contrasts word-medially is illustrated in (8), for [ot.ta] ‘time, occasion’ and [arota] ‘wheel’. Here and in what follows, I use the length diacritic to indicate moraicity in URs. To indicate output geminates while transparently showing syllable structure, I use the notation of two identical consonants separated by a syllable boundary, e.g. [k.k], with the understanding that the first is always moraic. Note that while the analysis of [arota] is focused on the singleton obstruent in comparison to [ot.ta], the trill [r] itself is likely a geminate.
-
(8)
None of these constraints mention manner, so geminate fricatives, nasals and liquids will be licensed in this position as well. It should be clear that in utterance-initial position there will be no possibility of a mora surfacing in coda position and underlying geminates will shorten to singletons. More challenging is to explain why no word-initial underlying geminates surface even following a vowel, and this is where the alignment constraint becomes necessary. The analysis is shown in (9) for hypothetical /tːa/ following the preposition /de/.
-
(9)
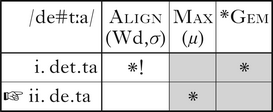
In this analysis, underlying geminates cannot surface word-initially, because either there is no preceding syllable to host their moras (utterance-initially) or preserving the mora would require it to be parsed with a preceding word (utterance-medially). Even if an underlying geminate arose in this position, the analysis predicts it would neutralise with the corresponding singleton. Geminates surface word-medially, however, because they can span two syllables without crossing a word boundary.
There is one morpheme in Campidanese that seems to feature a geminate word-initially. The initial fricative in the definite determiner [su]/[sa] is diachronically derived from a word-medial cluster, like many Sardinian geminates, and is longer and less likely to be voiced in utterance-medial positions than ‘normal’ fricatives. I have no definitive explanation of the synchronic status of this segment, but tentatively suggest that either the ban on non-coda moras may be relaxed for function morphemes, or that some sibilants may be long and resist voicing without being structural geminates (this would extend to [ʦ] and [ʃ], which also resist voicing word-initially). The segment [ɖ] evolved diachronically from geminate [lː], and Bolognesi (Reference Bolognesi1998) treats it as a geminate. It exceptionally appears initially in one morpheme, the object clitic [ɖu]. Unlike [s], however, there is no singleton counterpart to this segment, and there are other voiced stops in this context, so it is not necessary to treat it as a synchronic geminate.
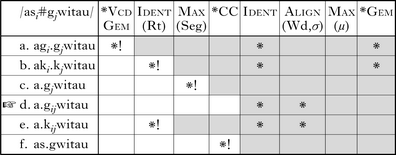
3.3.2 Derived geminates and blocking. A number of interesting patterns involve geminates emerging from underlying consonant clusters (Bolognesi Reference Bolognesi1998; cf. Ladd & Scobbie Reference Ladd and Scobbie2003 for related facts in Logudorese Sardinian). Across a word boundary, sequences of two voiceless obstruents give rise to surface voiceless stops, analysed as geminates. This is true even when the same clusters surface faithfully in tautomorphemic contexts, as shown in (10). Most word-final obstruents in Campidanese occur in inflectional morphemes: in the examples below, it is the 2nd person singular suffix /-s/ in an auxiliary verb that causes gemination. The same outputs occur with inflectional /-t/ and /-st/, and the archiphonemic consonant in the preposition /aC/. The examples below with /-s/ illustrate the fact that identical clusters are resolved differently within a lexical item and between lexical items.
-
(10)
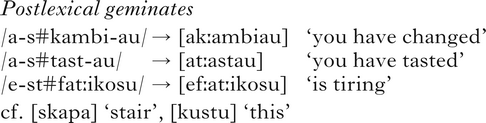
Analysing this pattern requires several additional constraints and a theory of correspondence. To explain why obstruents from inflectional morphemes trigger gemination of a following sound but other obstruents do not, I appeal to the distinction between root faithfulness and affixal faithfulness, which drives pervasive asymmetries cross-linguistically (Beckman Reference Beckman1998). In these Campidanese data, there is never partial assimilation, only total assimilation. For this reason, and to avoid enormous tableaux, I conflate most segmental faithfulness constraints into one specific to roots (Ident(Root)) and one general constraint for roots and affixes (Ident). This conflation includes featural Max and Dep constraints for privative [voice]. Segmental Max is treated separately. I assume a constraint against consecutive consonants, *CC, which is not violated by geminates (for a full account of word-medial clusters, more fine-grained constraints on clusters will be necessary). In terms of resolving clusters, I assume that underlying segments can either coalesce with other segments or be deleted; I represent correspondence using subscript indices {i, j, …}, where input sounds are in correspondence with coindexed output sounds, or are considered deleted if there is no coindexed output sound. For output geminates, I assume that the moraic first half may correspond to C1 in a C1#C2 cluster, while the second half corresponds to C2. The moraicity of coda consonants more generally need not be underlying in this analysis (though it may be). An example of postlexical gemination and word-internal cluster faithfulness is shown in (11).
-
(11)
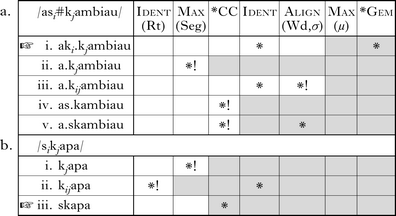
The basic idea is that lexical clusters are tolerated because eliminating them would be unfaithful to root consonants, while postlexical clusters are changed to geminates as long as this can be achieved by changing only affix consonants. The analysis becomes more complex when we consider clusters involving underlyingly voiced stops. In forms such as /a-s#gwit-au/ ‘you have driven’, the auxiliary-final consonant neither surfaces faithfully nor becomes the first half of a geminate. Instead, the following verb-initial consonant sometimes surfaces as a lenis approximant, sometimes as a voiced stop. If we assume that the output lenition means that /g/ has lost its privative [voice] feature, it is difficult to explain why it doesn't geminate like underlying unspecified obstruents in this context (as in (11)). Given that voiced stops sometimes lenite in the corpus, I instead analyse these sequences as yielding an output voiced stop, [agwitau] in this case. I explore whether and why these forms differ phonetically from ‘plain’ voiced stops in §4.4.
The analysis of postlexical clusters with voiced stops is shown in (12). This analysis requires one more constraint: *VcdGem, which penalises geminate voiced obstruents and is undominated in Campidanese.Footnote 2
-
(12)
These clusters are treated fundamentally like the non-voiced ones in (11), but simple gemination is blocked because of voicing, and gemination with devoicing is blocked because it would alter a root consonant. The best remaining repair is to coalesce both consonants into one that preserves the features of the root consonant. It may seem unusual to characterise the output here as a coalesced segment corresponding to both inputs, but trying to derive a ‘normal’ voiced stop would create a ranking paradox with the tableaux in (11). As we will see in §4.4, these segments differ phonetically from the ‘normal’ versions of both voiced and voiceless stops.
4 A phonetic grammar of Campidanese lenition
The phonological grammar developed in §3 derives patterns of contrast for segmental length and features, but does not include any lenition or fortition patterns, and in fact has no higher-level prosodic boundary effects at all: the grammar predicts the same phonological outputs in all prosodic positions. In this section, I show that observed patterns of lenition and fortition can be derived from the outputs of this phonological grammar without any dedicated lenition or fortition constraints, based solely on the interplay between prosody, duration and segmental dynamics.
4.1 A corpus of Campidanese recordings
The model developed here attempts to predict the relative phonetic patterning of various sounds in Campidanese. Data on those patterns come from recordings of 15 speakers, ranging in age from 31 to 64, in the central and western Campidano. These are the same recordings reported on by Katz & Pitzanti (Reference Katz and Pitzanti2019), but with different acoustic analyses and prosodic annotations, as described below. Speakers all reported being born and raised in the region, speaking and hearing Sardinian from early childhood and speaking ‘good Sardinian’. Some of these speakers currently speak more frequently or proficiently in Italian, but all of them speak Sardinian regularly and have since childhood. They were recorded translating sentences from Italian, as Sardinian has no standard orthography and most speakers do not read or write in the language. The Italian sentences were composed in an attempt to elicit a variety of consonants at the beginnings of successively larger prosodic domains from the syllable to the utterance.
Several qualitative and quantitative phonetic properties were measured. Presence of voicing throughout a consonant and presence of visible or audible bursts were coded categorically based on listening and visual inspection of acoustic records. While such annotations can vary based on details of the recording setup, acoustic software settings and analyst's judgement, we expect them to correspond closely to the IPA transcriptions that traditionally are used to describe lenition patterns in phonology, and as such they seem worth investigating. I supplemented these judgements with more objective, pseudo-automated phonetic measurements. The approximate boundaries of each sound to be measured were marked by hand. Duration, maximum rates of intensity change and intensity extrema were then derived automatically from those approximations, using a version of Kingston's (Reference Kingston, Colantoni and Steele2008) method. This method marks duration as the time between maximum negative intensity slope going into a consonantal constriction and maximum positive intensity slope coming out of that constriction. Sounds were bandpassed and intensity contours smoothed before undergoing these measurements; the band from 0 to 3.2 kHz was used, as Kingston's (Reference Kingston, Colantoni and Steele2008) study shows lenition effects in several bands within this range and Katz & Pitzanti (Reference Katz and Pitzanti2019) report optimal results using this range.Footnote 3
The corpus contains 4262 segments from 436 utterances. Not all sounds could be measured for all properties; for instance, the algorithm cannot measure the duration of sounds that don't produce an intensity ‘trough’ between two vowels. Reported sample sizes in various conditions in the following sections reflect the measurable number of sounds. Data for all consonants examined here, and a few others that do not appear in all the relevant prosodic positions and are not examined here, are included as online supplementary materials.Footnote 4
Lenition phenomena involve several levels of prosodic structure, which raises the issue of how to diagnose prosodic boundaries. There is no agreed-upon set of, for example, intonational boundary tones that can be used to diagnose phonological phrases in Campidanese. Vanrell et al. (Reference Vanrell, Ballone, Schirru, Prieto, Frota and Prieto2015) and Katz & Pitzanti (Reference Katz and Pitzanti2019), however, offer some illustrations and suggestions about syntactic configurations that are relatively likely to be associated with higher-level prosodic phrases. Prosodic coding in this study is based solely on syntactic structure, following those accounts. Consonants at the beginning of clauses, verbal arguments and adjuncts, and matrix verb phrases following non-pronominal subjects were singled out as potentially initial in a prosodic phrase. Other word-initial consonants were coded as non-phrase-initial. This coding is likely less than perfect, but it manages to capture several important properties of the Campidanese sound system.
In what follows, I refer to underlying series of obstruents using capital letters: /T/, /D/ and /S/ for the voiceless stop, voiced stop and voiceless fricative series respectively.
4.2 The structure and purpose of the model
The lenition model developed here derives detailed phonetic implementations of consonants from their categorical phonological properties and prosodic context. The outputs of the model are generally stated as probability distributions over phonetic measurements, and by setting the parameters appropriately, we can simulate data from our corpus. While the model is calibrated to capture generalisations from the corpus, it is intended as a model of Campidanese grammar, not of the corpus itself. The distinction is important for several reasons. The most effective way to model the corpus is to use some selection procedure for regression models that take into account all of the fixed and random effects present in the data, i.e. the prosodic and featural factors we are interested in, but also a host of other linguistic and extralinguistic factors that can affect the duration, intensity and relative timing of speech sounds, such as speech rate, speaker identity, recording conditions and word-specific properties. This is essentially what Katz & Pitzanti (Reference Katz and Pitzanti2019) do. My purpose here is different: it is to develop a grammar that generates Campidanese-like phonetic patterns from prosodic structure and phonological features, independent of the myriad other factors reflected in the corpus. I do evaluate the model in terms of how it captures patterns reflected in the corpus, because the corpus is the best source of phonetic data we have at hand. I do not, however, use detailed calculations of likelihood assigned to the specific observations in the corpus, as in a typical acoustic phonetic study. Beyond the many factors in the corpus that we are trying to abstract away from, it also contains far more data points at lower prosodic levels, so any metric for fitting these particular data will weight some prosodic positions as more important than others. Another way of putting this is that the model is not primarily concerned with minimising error over the particular set of observations we have at hand; it is concerned with generating differences between phonological categories and structural positions that will capture information about the corpus, and about Campidanese more generally.
The model is implemented in an abstract phonetic space over units of variability (within-speaker standard deviations). Duration data were log-transformed and z-scored within speaker, to abstract away from differences in overall speech rate. The z scores in which the model is stated could be used as the basis for subsequent modelling of other factors affecting duration and intensity, by adjusting means and/or standard deviations in accordance with those factors. To the extent that the minimal model used here captures patterns in the observed data, it might be worthwhile to extend it in this way. The focus here, however, is on just those factors relevant to prosodically conditioned lenition. I hope to demonstrate that in principle a phonetic grammar of this type produces roughly the patterns of prosodically conditioned lenition and fortition observed in Campidanese, independent of other factors.
The model, summarised in Fig. 1, takes as its input the output of a phonological derivation. The only crucial requirement for the phonological component is that it derive the right number of outputs, distinguished from one another by some categorical property. The implementation above used an OT grammar with binary and privative distinctive features; the lenition model could just as easily be applied to the outputs of any other phonological framework, rule- or constraint-based, with features, elements or gestural parameters. The first component of the model assigns a duration distribution to each output manner (e.g. voiceless fricatives, voiced stops, nasals), and adjustments to that distribution based on prosodic structure. Note that, while prosodic adjustments are mostly referred to here as initial lengthening of consonants, they could also be understood as increased separation between flanking vowels, or as some combination of the two. This is because the automated duration measurements used here are based on acoustic landmarks during the transition from a preceding vowel to a consonantal target. They thus reflect temporal separation between a domain-final vowel and a following domain-initial consonant target, regardless of whether that separation comes from prosodic phrasing effects across domains or from initial consonant lengthening. In §5, I will suggest that, at least for the /T/ series, it may be preferable to think of consonantal targets as relatively invariant, with cross-domain temporal separation as the main conditioning factor for lenition and fortition.
A schematic illustration of the model used to generate lenition and fortition.
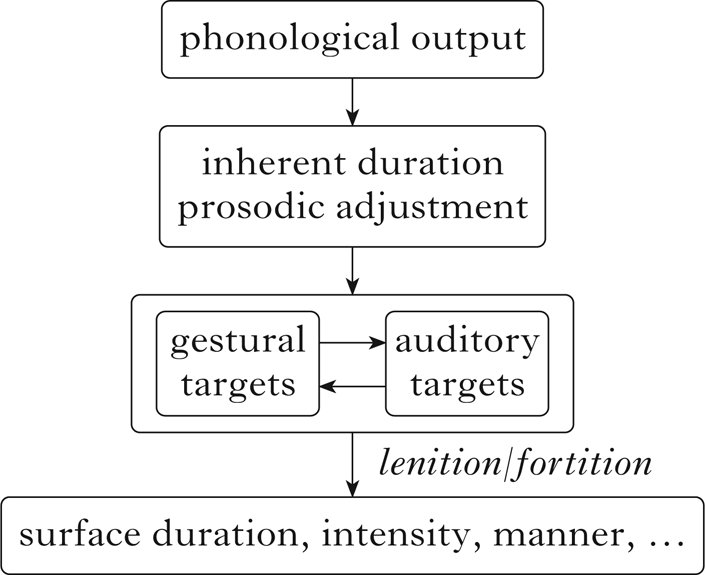
The likelihood of particular phonetic manner or intensity parameters is then derived from duration on a (phonological) manner-specific basis. For instance, both voiceless stops and voiceless fricatives become more likely to undergo passive ‘carry-over’ voicing following a vowel as their distance from that vowel grows shorter, but the precise details of this function may differ for the two types of consonant, which have different gestural and aerodynamic properties. All such duration functions are stated in terms of acoustic parameters, and are derived from acoustic data. As indicated in Fig. 1, however, I take no position on whether the primary goals and targets in lenition processes are gestural (Kirchner Reference Kirchner1998) or auditory (Kingston Reference Kingston, Colantoni and Steele2008) in nature. I use acoustic targets here because those can be inferred from acoustic data; it may be that those goals are primary and have predictable gestural correlates, that gestural goals are primary and have predictable acoustic correlates, or that both kinds of goals are active in synchronic grammar. Whatever the nature of the targets, I assume that they differ in fine-grained ways between languages, which predicts that lenition patterns and duration-lenition functions should also differ between languages. As such, the duration-lenition functions used here need not be seen as an active component of mental grammar, but may instead be predictable consequences of general physical laws applied to a variety of different gestural and/or auditory representations.
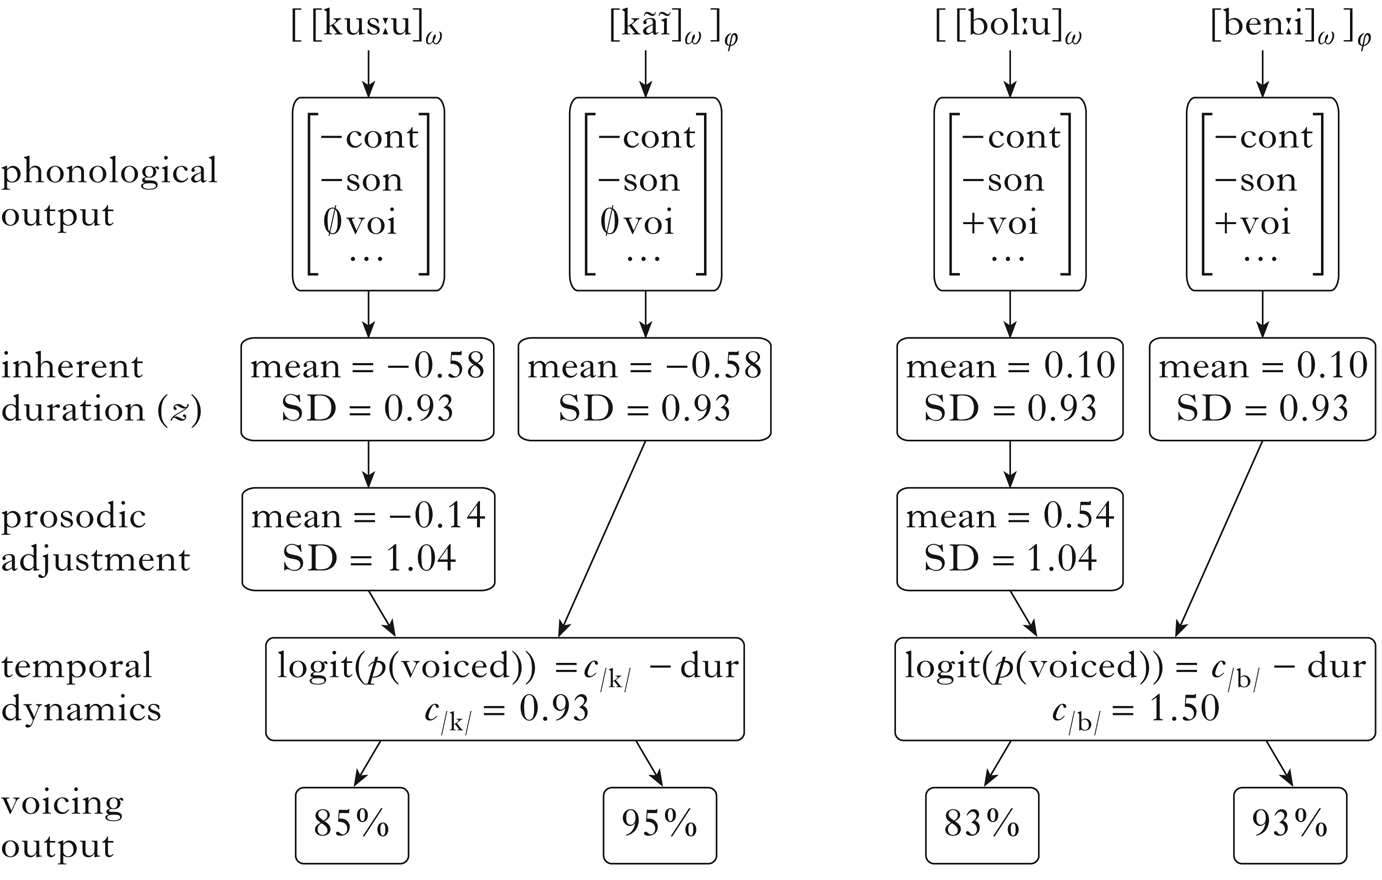
A more concrete illustration of how the model works is given in Fig. 2. Here I zero in on phonological output [k] and [b] segments in phrase-initial and phrase-medial positions. Parameter values are based on the corpus, but not directly fitted from it; I explain the fitting process in the next section. Each set of manner features is associated with a normal distribution of duration values in z-scored log ms. Initiality in a higher prosodic unit boosts both the mean and the standard deviation of the associated distribution. At this point, an actual duration for each token is drawn from the distribution: phrase-initial consonants will be longer on average than medial ones, and voiced stops will be longer on average than unspecified ones, though all distributions overlap to some degree. The equations in the output of ‘temporal dynamics’ express the probability of full voicing throughout closure as a function of duration. It has an intercept c that varies by manner, which is described in detail in §4.3. The difference between the two stops is taken to be a consequence of how their gestural or auditory goals differ from one another. Voicing correlates negatively with duration for both, however, reflecting the fact that full voicing becomes more likely when a consonant closure is temporally closer to a preceding vowel, whether voicing is active or passive. Note that while these are linear functions, I have implicitly set the slope to ―1 in both cases, to simplify fitting and minimise the number of free parameters. Finally, each token is assigned either fully voiced or less than fully voiced status, based on the probability derived from the duration function. In Fig. 2, I show aggregate probabilities over the entire category being modelled, to illustrate how the system works. In an actual simulation, tokens would be assigned either 1 or 0. The figure shows a voicing function; I also fit burst and minimum-intensity functions in the following sections, to reflect spirantisation and gradient lenition.
A schematic illustration of how the model applies to [k] (in the phrase ‘that dog’) and [b] (in the phrase ‘I want to come’) in phrase-initial and phrase-medial positions.
4.3 The phonetics of singletons
The grammar in §3 derives phrase-medial voiceless stops, voiced stops and voiceless fricatives. In this section, I show how these initial consonants undergo varying degrees of lenition and fortition, depending on their prosodically conditioned durations.
4.3.1 Duration
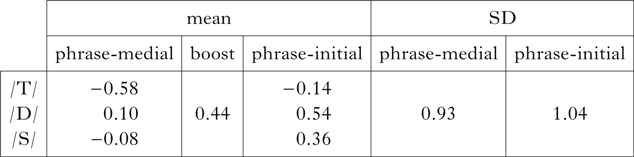
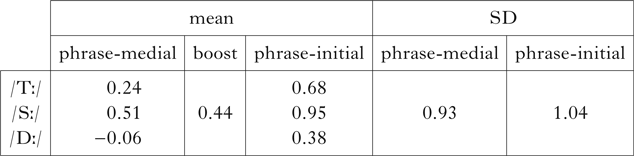
Each natural class is assigned a default duration in phrase-medial position, which differs by manner and voicing. That baseline duration is boosted at the beginning of larger prosodic domains; I model this boost as being the same across consonants in relative (logarithmic) terms. This reflects the hypothesis that initial lengthening is a general property of prosodic systems. Of course, observed initial lengthening effects in the corpus are not exactly equal for all consonants in either absolute (ms) or relative (logarithmic) terms, and a better fit to the corpus could be obtained by giving each manner a different prosodic boost. The attempt to model lenition and fortition patterns using a uniform effect of prosodic initiality amounts to asking whether manner-specific prosodic adjustments to duration are a necessary part of the lenition grammar, or whether we can capture rough patterns of lenition without such adjustments, in the interest of minimising free parameters. The uniform prosodic boost used for consonants was 0.44 z units, the difference in means between phrase-initial and phrase-medial positions pooled across all consonants that appeared in the two positions in the corpus.
The mean baseline duration assigned to each natural class was chosen so as to equalise the model's deviance from observed mean values in phrase-medial and phrase-initial positions. For instance, voiced stops had an average z-scored duration of 0.03 in phrase-medial position and 0.60 in phrase-initial position. Because the model was constrained to have a uniform duration boost of 0.44, these conditions were assigned mean durations of 0.095 and 0.535, which ‘misses’ each observed mean by 0.065. Normal distributions were generated using those simulated means, with standard deviations for phrase-medial and phrase-initial positions derived from the corpus. I hold standard deviations constant across all segment types, though not across prosodic positions. The resulting duration model is shown in Table I.
Simulated duration distributions for singleton obstruents in phrase-medial and phrase-initial position. Units are z-transformed log ms.
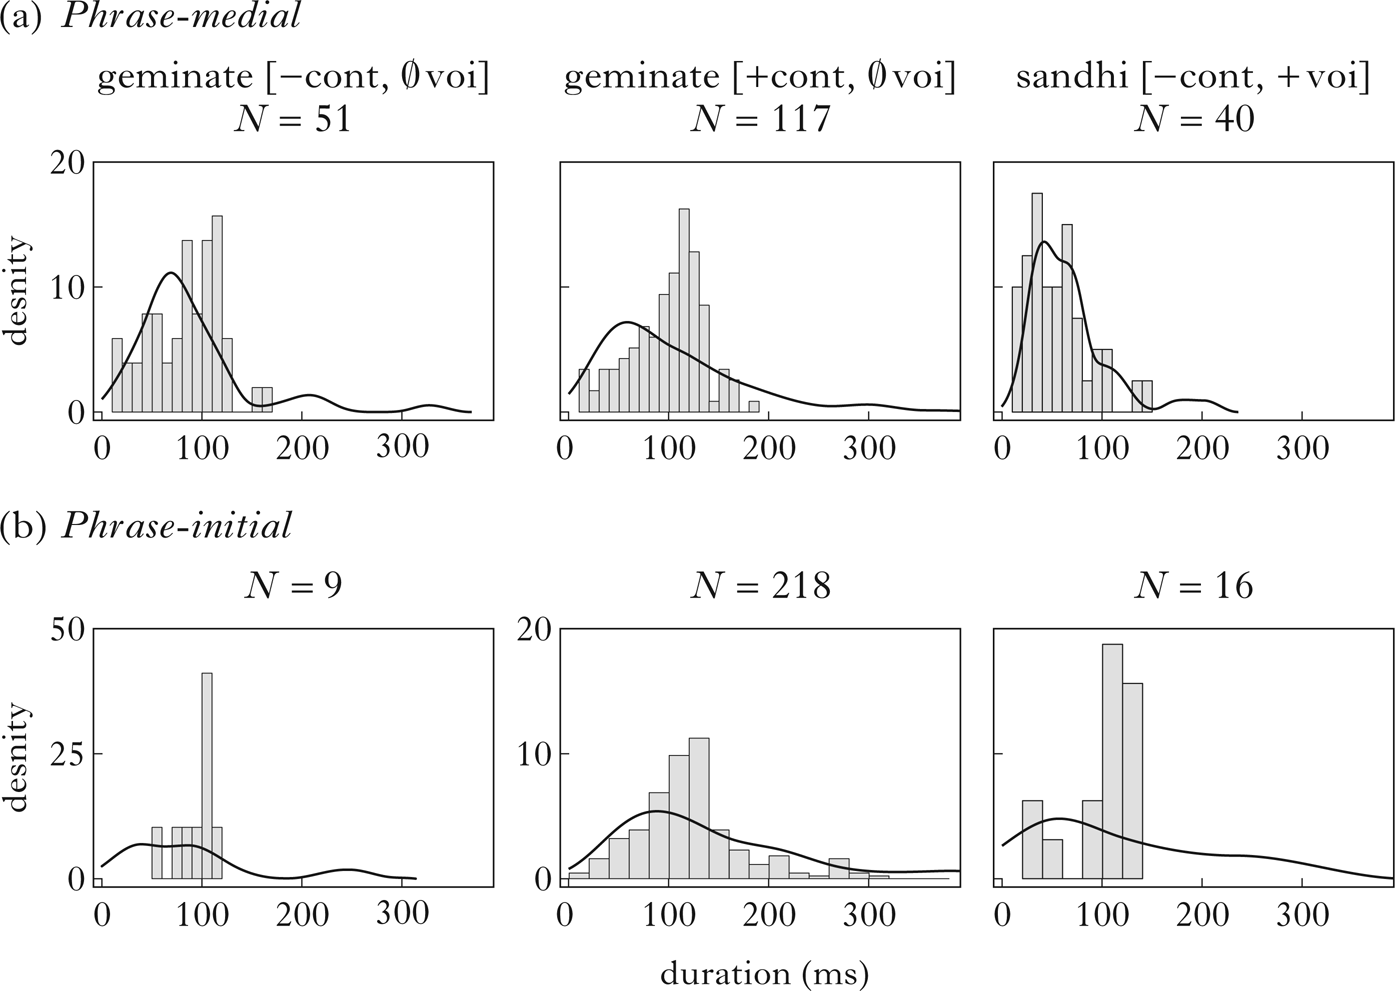
This duration model is derived from the corpus, but greatly simplified. The hypothesis is that, while a large number of linguistic and extralinguistic factors go into generating duration patterns in an actual utterance, the minimal parameters in Table I are sufficient to derive patterns of lenition and fortition. It is still important, however, to assess whether the simplified duration model is broadly consistent with empirical measurements. The plots in Fig. 3 apply the duration model to simulate the corpus. The model is stochastic, so results vary somewhat from run to run, especially for conditions with few data points. Durations are plotted in milliseconds; these values are derived from the z scores in Table I using the observed grand mean and standard deviation across all speakers in the corpus, and so correspond to the profile of a roughly average speaker.
Observed and simulated duration distributions for (a) phrase-medial and (b) phrase-initial intervocalic obstruents: unspecified stops (left), voiced stops (centre) and unspecified fricatives (right). Bars show observed frequencies in the corpus; curves show density generated by one run of the model with the sample size of the corpus.
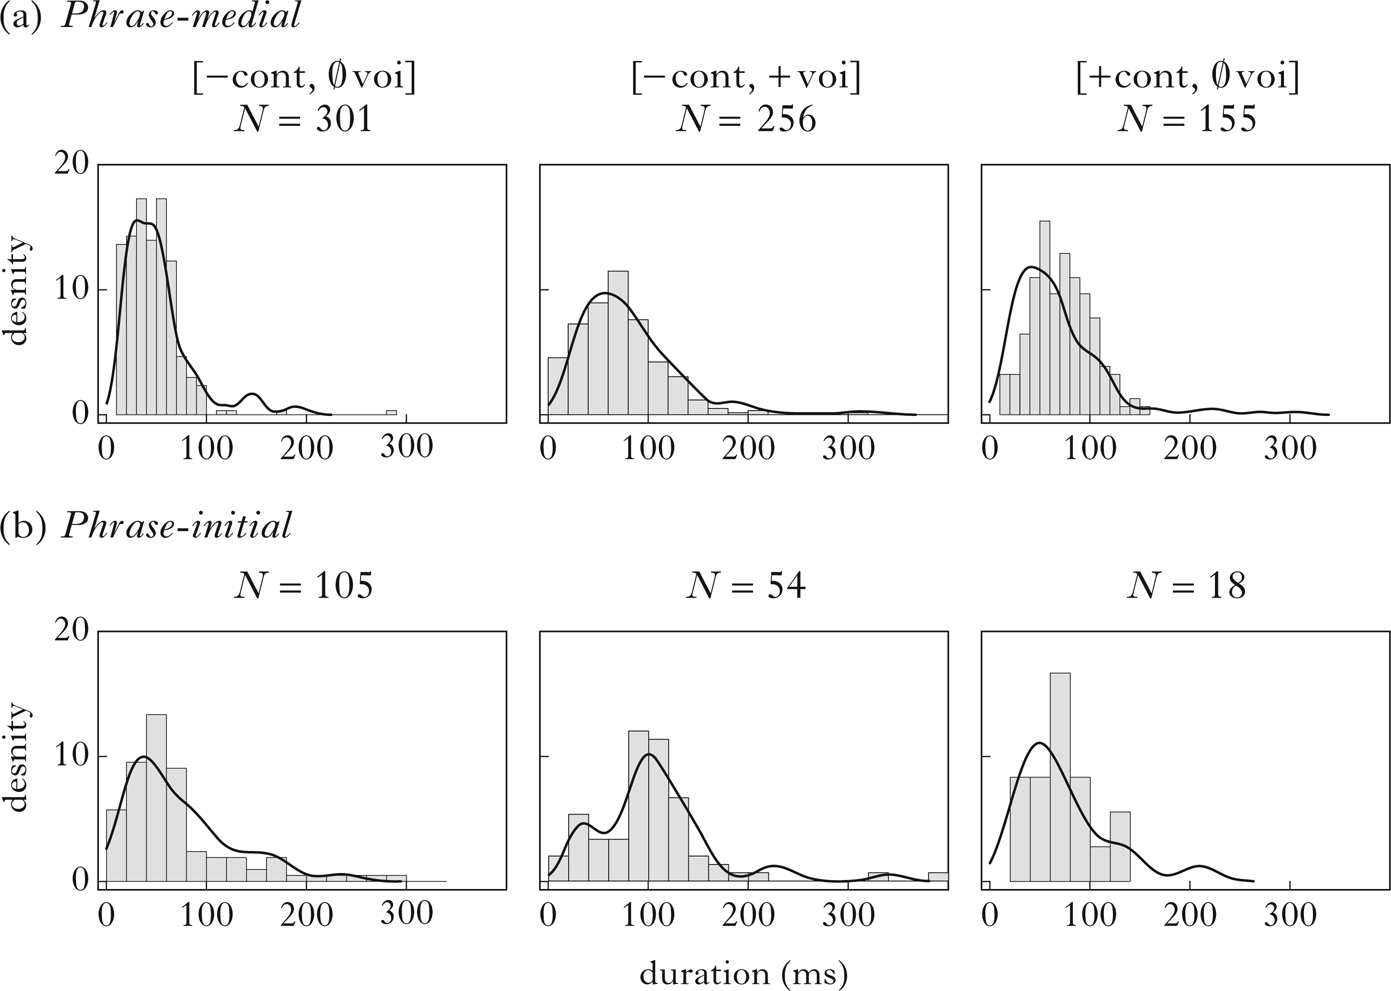
If the model perfectly fitted the observed data, we would expect the density curves to perfectly ‘hug’ the barplots; in an actual, imperfect simulation of a finite corpus, that would likely indicate overfitting. The density curves in Fig. 3 are reasonable approximations of the histograms, despite the many simplifications in this model. Visual mismatches here reflect in part the fact that actual duration samples are not perfectly log-normal, especially for smaller sample sizes. Note that the /T/ series is extremely short on average in both positions, with the majority of tokens less than 60 ms, shorter than either of the other series. This is one reason why I don't think that ‘voiceless stop’ is a likely representation for these segments. Because the phonetic implementation model developed here doesn't treat voicelessness as an inherent target for these sounds, it is consistent with a range of other representations, discussed in §5.1.
4.3.2 Manner and intensity functions
The model can derive from the simulated durations of obstruents in different phrasal contexts a description of how likely they are to display manner-related lenition properties such as voicing and continuancy. While the duration grammar attempted to maintain uniform operations across segments, the ways in which duration interacts with lenition depend crucially on the gestural and auditory goals for a segment. By hypothesis, the presence of voicing in an obstruent not specified for [voice] depends on the presence of a preceding voiced sound (a vowel in this case) and its temporal distance from the obstruent. I use measured consonant duration as a proxy for distance from the preceding vowel, and the dependent variable annotated in the corpus is the presence of at least weak voicing throughout the entire consonant. As the duration of an obstruent gesture increases, the odds that passive voicing will cease also increase. For phonologically voiced obstruents, on the other hand, I assume that voicing gestures have a baseline probability of failing, due to the aerodynamic demands of obstruent voicing (Ohala Reference Ohala and MacNeilage1983). The probability of such failure should decrease if there is a preceding voiced sound temporally close to the consonant. This means that, following a vowel utterance-medially, we expect the probability of full voicing to decrease as the consonant grows longer for all series of consonants considered here. Their behaviour should diverge, however, when the preceding vowel is extremely far away or absent (as in utterance-initial position), as only the voiced stop has voicing as an active goal.
To generate voicing probabilities from segment durations, I seek to optimise a function from duration to a probability of voicing such that consonants with their modelled durations in each prosodic position voice at roughly the rate observed in the corpus. One simple idea is to use logistic regression models for an estimate of the empirical relationship between segment duration and voicing in the corpus, then derive parameters for the grammar from the regression model. This turns out to produce fairly poor fits to longer consonants. Because shorter medial tokens are overrepresented in the corpus and are overwhelmingly likely to be voiced, regression models tend to optimise fit by predicting that almost everything is voiced and then making ‘exceptions’ for a few of the longest consonants. This is an illustration of how the goals of this generative phonetic grammar differ from simply minimising error with respect to the corpus: maximising the likelihood of the corpus involves discounting phrase-initial patterns relative to phrase-medial ones, while developing a generative model entails equal attention to higher and lower prosodic levels. The approach I take is to optimise patterns of contrast across prosodic positions and segment classes.
Because simulated duration distributions are (log-)normal, it is straightforward to translate between quantiles and phonetic values. The approach taken here for categorical variables such as voicing is to identify the proportion of each segment type in each prosodic position that is positive for the variable, then identify a ‘crossover point’, c, above which the corresponding proportion of the simulated distribution is expected to lie, given the mean and standard deviation of the distribution. All segments above c are then assigned positive values on the logit scale, while those below c are assigned negative values; translating those into probabilities ensures that segments above c are relatively likely to display the phonetic property, while those below c are relatively unlikely to do so (note that for voicing simulations, it would be voicelessness that is associated with longer duration, so signs are reversed to model voicing). The challenge in this simulation is to generate lenition functions for segments in the same natural class using a single value for c across prosodic positions, even though, empirically, c has a different value in each prosodic position. This essentially amounts to asking whether the duration-based grammar alone can produce realistic lenition patterns across prosodic positions without special adjustments to phonological features or targets. In the simulations reported here, I averaged the values of c across prosodic positions to assign a single value to each manner of consonant, which ensures equal weighting of the prosodic positions. An example is shown in Table II for the /T/ series.
Fitting criterion values to duration distributions, showing the values for /T/ voicing in phrase-medial and phrase-initial positions. Duration units are z-transformed log ms.
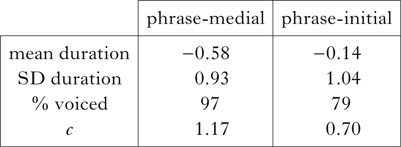
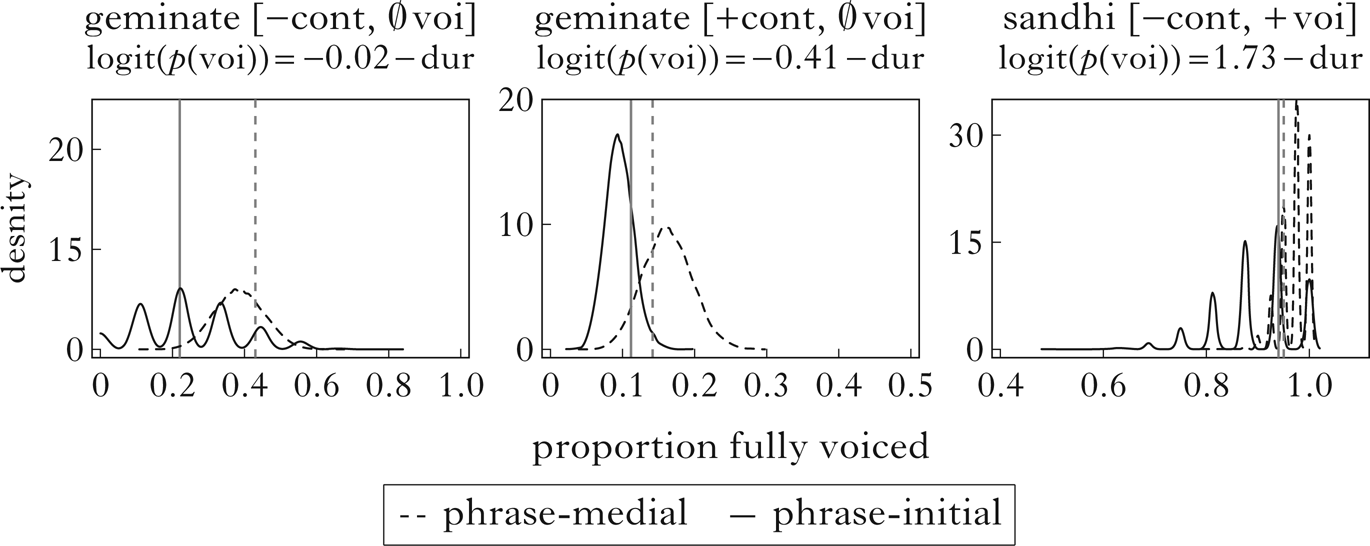
The average of the two c values here is 0.93; this was used to generate simulated voicing data: each voiceless stop has a logit probability of being fully voiced equal to its z-scored duration minus 0.93. The model predicts that 95% of phrase-medial voiceless stops and 85% of phrase-initial ones will be fully voiced, independent of any manner-based phonological lenition processes. We can also use this model to ask how much variability we might expect in a corpus the size of the one here. Figure 4 shows simulations of voicing across obstruent series. Observed voicing probabilities in the corpus are compared to density curves produced by 10,000 simulations with the same sample size. Most of the observed values fall well within the predicted distributions. This means that the model is succeeding in the basic task of predicting lenition from duration without phonological feature-changing operations. Note that ‘spikes’ in the density curve indicate simulations of conditions with sparse data. The model does not predict that these consonants are more variable than others in the grammar of Campidanese, just that they are more variable over the sample sizes in this particular corpus.
Observed and simulated voicing for utterance-medial obstruents. Vertical lines show observed proportions fully voiced in the corpus in phrase-medial and phrase-initial positions. Density curves show proportions of voicing over 10,000 simulations for unspecified stops (left), voiced stops (centre) and unspecified fricatives (right) in both positions.
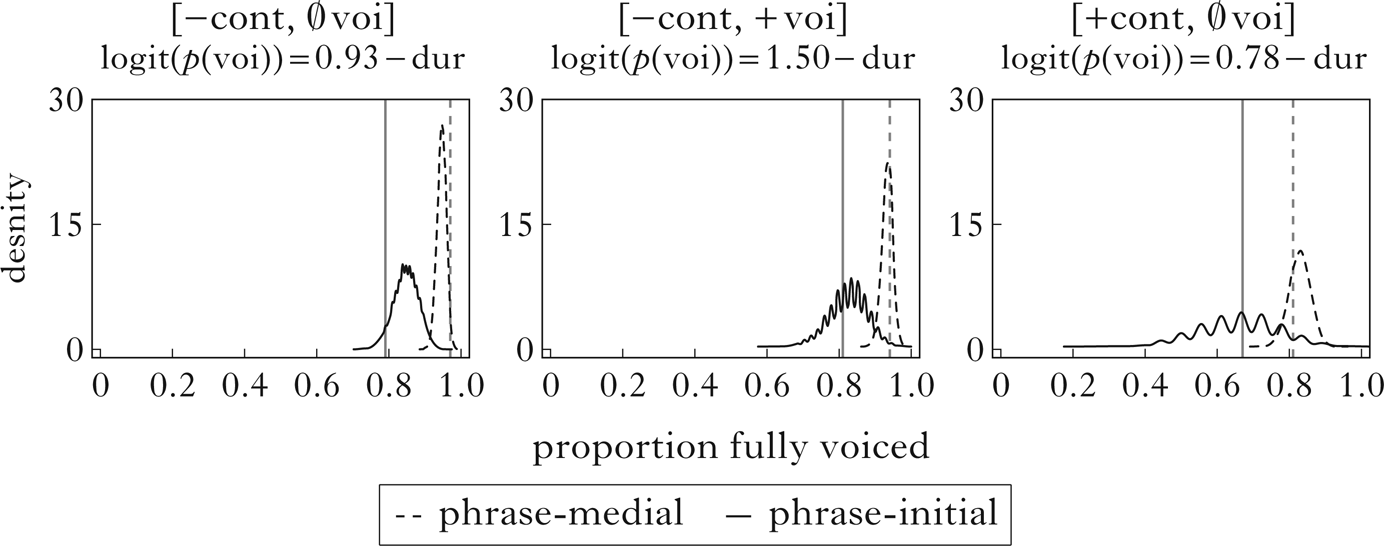
For utterance-initial position, there are no duration measurements to generate predictions, but there is no need for duration as a proxy here. Predictions can be made directly on the basis of distance from a preceding vowel, which is maximal in the absence of such a vowel. As such, the probability of voicing for the unspecified obstruents should be infinitesimally small; this prediction is borne out.Footnote 5 For voiced stops, the probability of voicing failure should be at some baseline level that is higher than in the postvocalic context. This is around 20% in the corpus. Interestingly, this is not much higher than the observed voicing failure rate of 19% in phrase-initial position, suggesting that the longest utterance-medial voiced stops in the corpus are long enough to get little benefit from carry-over voicing from the preceding vowel.
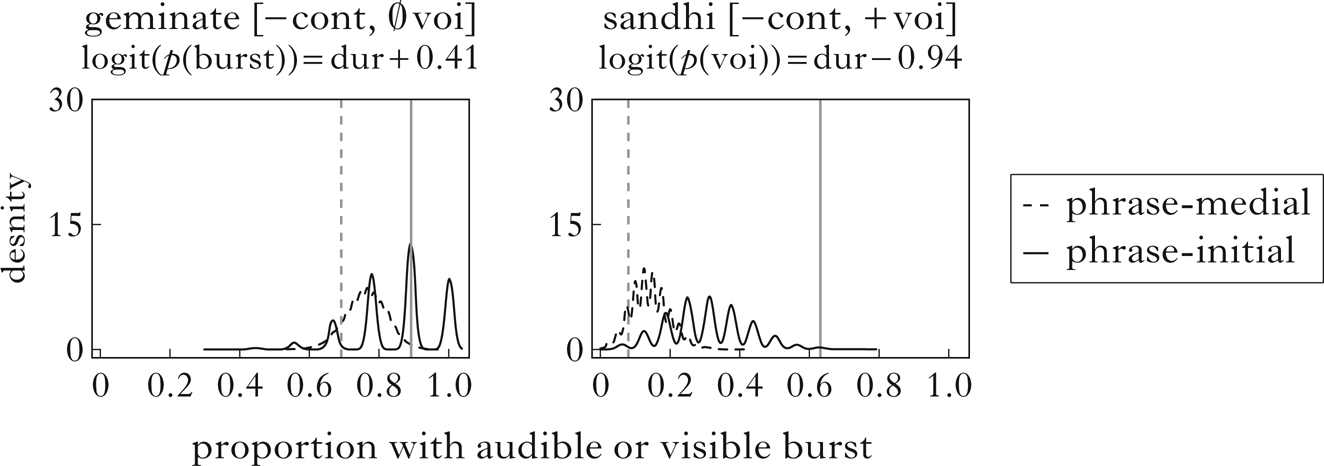
The presence of visible or audible bursts, related to continuancy, was modelled using the same procedure as for voicing. Here, the assumption is that longer consonants are more likely to achieve sustained closure and thus result in a burst (so the slope of duration in the function should be positive for this feature). Observed and simulated burst probabilities for the two stop series utterance-medially, using the same duration model as the previous simulation, are shown in Fig. 5. Again, relative patterns are accurate across both stop series in both prosodic positions, and observed proportions fall within the range of simulated values. The model succeeds in predicting intervocalic approximantisation or its absence on the basis of duration.
Observed and simulated burst probabilities for utterance-medial stops. Vertical lines show observed proportions with an audible or visible burst in the corpus in phrase-medial and phrase-initial position. Density curves show proportions over 10,000 simulations for unspecified stops (left) and voiced stops (right) in the respective positions.
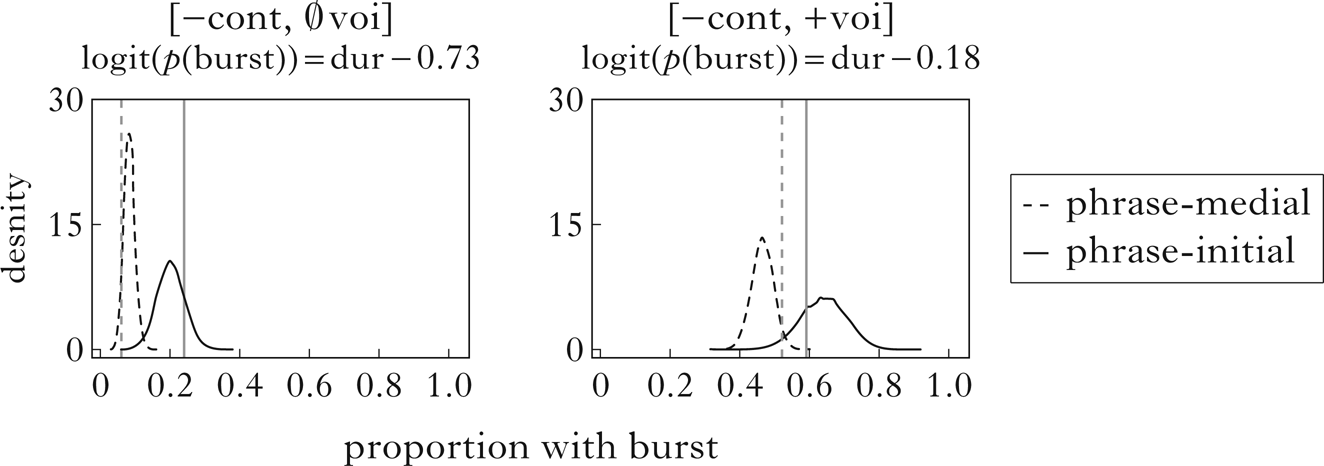
In utterance-initial position, the most straightforward prediction is that both types of segment should have a greater probability of bursts than in utterance-medial positions. One reason is that in absolute initial position the articulators don't need to move into a stop configuration from a preceding vowel configuration, because there is no preceding vowel. If vowels have a maximally open vocal tract, they will be maximally distant from stop configurations, and achieving sustained stop closure will require more time. A second possible factor is that, if prosodic duration boost extends to the utterance level, these stops should be longer than their phrase-initial counterparts, although this is difficult or impossible to measure acoustically. In any case, the observations are in line with either or both of these predictions: 82% of voiced stops and 88% of voiceless ones have bursts in utterance-initial position. Many of the voiceless stops in this context are marked by weak bursts with substantial frication, potentially indicating incomplete closure. I return to this observation in §5, suggesting that these segments are not represented as stops.
4.4 The phonetics of geminates
The phonological grammar derived the presence of postlexical geminates and sandhi consonants in the phonology, spanning word boundaries. Here I turn to their phonetic implementation. One crucial point is that general prosodic duration adjustments and lenition and fortition phenomena extend to geminate consonants, at least to those for which there is sufficient data in the corpus. This is unexpected in a framework where lenition is a change in phonological features, but falls out naturally in an approach where lenition is driven by prosodic adjustments to duration.
To model prosodic effects on duration requires data for phrase-medial and phrase-initial positions. The number of phrase-initial consonants in the corpus in general is relatively low, and these postlexical clusters in that position are even less frequent (several speakers from the Trexeinta resolve these clusters through epenthesis instead of gemination/assimilation). We can nonetheless see relatively clear patterns for the two stop series even with a small number of phrase-initial tokens (fewer than 20 for each series). For the fricatives, only three phrase-initial tokens were elicited. However, the exceptional geminate in the determiner [su]/[sa] is frequent in both positions, so I examine this geminate in what follows.
Duration, voicing and burst modelling followed the same procedure as for singleton consonants, with the same prosodic boost parameter (z = 0.44) and the same standard deviations (0.93 in phrase-medial and 1.04 in phrase-initial position). The resulting duration model is shown in Table III and compared to the corpus in Fig. 6.
Observed and simulated duration distributions for (a) phrase-medial and (b) phrase-initial cluster outputs: geminate stops (left), geminate fricatives (centre) and coalesced voiced stops (right). Bars show observed frequencies in the corpus; curves show density generated by one run of the model with the sample size of the corpus.
Simulated duration distributions for postlexical geminates in phrase-medial and phrase-initial position. Units are z-transformed log ms.
Again, while not every type of segment shows the exact same effect of phrase-initiality, the uniform simulation captures qualitative patterns in the data. The sparse distributions for the sandhi consonants in phrase-initial position are, of course, somewhat different than their log-normal simulations; this is expected as sample sizes get smaller. Data and simulations for voicing in these segments are shown in Fig. 7.
Observed and simulated voicing for phrase-medial and phrase-initial cluster outputs. Vertical lines show observed proportions fully voiced in the corpus in phrase-medial and phrase-initial position. Density curves show proportions of voicing over 10,000 simulations for geminate stops (left), geminate fricatives (centre) and coalesced voiced stops (right) in both positions.
This is not quite as informative as the simulation for singletons, partly because the model predicts that samples this small could have a large range of outcomes, and partly because there is not as much variation in voicing to model for the fricative and voiced stop series. The model at least predicts that the observed patterns should be more frequent than, for example, their opposites. Modelling of bursts, shown in Fig. 8, is somewhat more informative, and also shows a clear failure of the model for the voiced sandhi consonants.
Observed and simulated burst probabilities for phrase-medial and phrase-initial cluster outputs. Vertical lines show observed proportions with an audible or visible burst in phrase-medial (dashed) and phrase-initial (solid) position. Density curves show proportions over 10,000 simulations for geminate stops (left) and coalesced voiced stops (right) in the respective positions.
While the observed probabilities for unspecified stops are well within model predictions, the voiced consonants should be nowhere near the observed separation, on the basis of their duration alone. This suggests that there is a difference in burst likelihood between phrase-medial and phrase-initial realisations of this segment that goes beyond differences in duration; in other words, there is a phonological difference. Inspection of the data bears this out: in syntactic positions singled out as potentially phrase-initial there is little sign of sandhi phenomena, and these segments pattern roughly like ‘normal’ voiced stops. In phrase-medial positions, they have a duration intermediate between the voiced and unspecified stops, but with voicing and continuancy roughly equal to the unspecified series. Essentially, the model is telling us that the differences in manner between these two sets of consonants are not due to one simply being shorter than the other: there must be some other difference in the input to the phonetic implementation component, where the obvious possibility would be a difference in phonological features or structural length.
The phonetic implementation model can be used to ask questions about other phonological ways to represent the phrase-medial sandhi consonants. Could they just be slightly shorter or longer versions of voiced or voiceless stops, for instance? A rough answer to the question can be found by fitting the duration-manner functions (voicing, burst) of those other consonant series to the voiced sandhi series. In practice, only burst data will be informative, because voicing is near-categorical in phrase-medial position for all three types (94–98%). Simulations using the dynamics of unspecified and voiced stops to try to predict those of voiced sandhi consonants are shown in Fig. 9.
Observed and simulated burst probabilities for coalesced voiced stops in phrase-medial position, when treated as equivalent to the ‘normal’ voiced stops (left) or voiceless stops (right). Vertical lines show observed proportions with an audible or visible burst in the corpus for ‘normal’ stops and sandhi consonants in phrase-medial position. Density curves show proportions over 10,000 simulations.
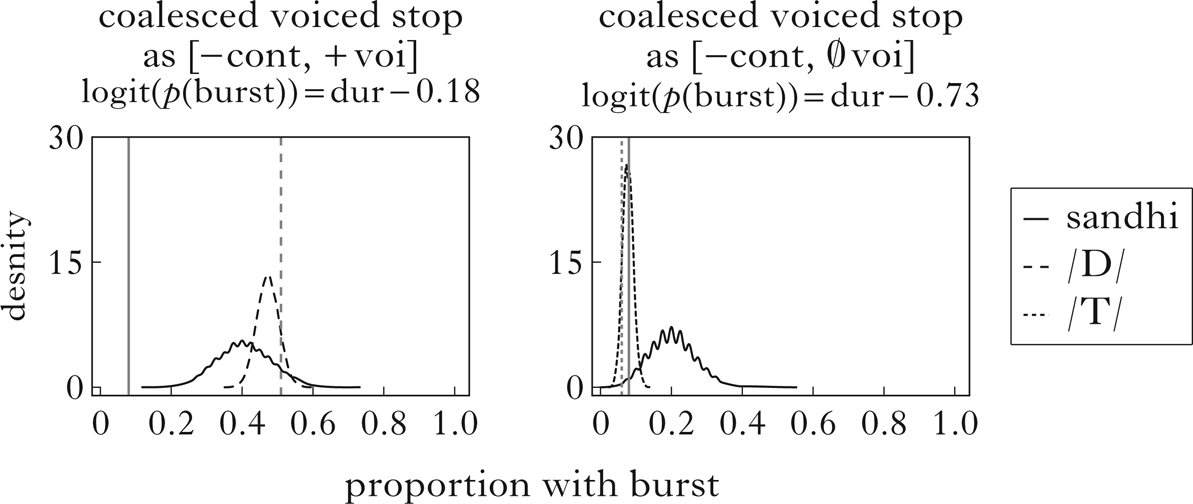
Both simulations arguably fail, the voiced stop one more dramatically (the observed probability in the corpus falls outside the range of all 10,000 simulations). Both simulations overestimate the proportion of sandhi consonants that should have bursts, which is another way of saying that these segments are more lenited than we would expect based on their durations, if they share featural specifications with one of the other UR obstruents in the corpus. This constitutes an argument that the sandhi process with postconsonantal voiced stops produces an output that is not equivalent to any of the other sounds in the Campidanese inventory, i.e. it is non-structure-preserving.
The phonological model produced a voiced stop as output in these cases, and it is not easy to see what type of non-structure-preserving alternative might be better. On a speculative note, however, the output of the sandhi process in our analysis is a voiced stop coindexed to both an input voiced stop and an input unspecified consonant (or alternatively, both a word-initial and a word-final consonant), and differs from all other outputs in this regard. In general, these indices in OT are meant to annotate the phonology-internal correspondence relation, and are not taken to be visible to phonetic implementation in the way that features are. If we change this assumption, however, it might be possible to explain why these sandhi consonants ‘split the difference’ durationally between the two input series, and why they pattern differently with regard to lenition. I tentatively suggest that the coalescence of two consonants in this case leaves some type of ‘trace’ in the phonological output that is interpreted by the phonetic component.
4.5 The non-equivalent phonetics of lenition and features
The preceding investigation of voiced sandhi consonants assumed that, if two sets of observed sounds share the same phonological features in the input to the phonetic implementation component, it is possible to model their phonetic properties in terms of duration with reasonable accuracy. If they differ in phonological features, however, it is not necessarily possible to do so. This corresponds to the common-sense observation that sounds with different manner and voicing features differ not only in their duration, but also in parameters related to their constrictions, laryngeal manoeuvres and/or the acoustic consequences thereof. Given that I have argued that lenition patterns can't be reduced to feature changes, it is important to test whether this modelling prediction actually holds: is it the case that differences between consonants with different URs can be predicted from their durations? If so, then lenition and fortition can plausibly be analysed as changing phonological features. If not, then they are better analysed as driven by duration, without any concomitant changes in phonological features.
I begin by asking whether prosodic duration boost is akin to phonological gemination. Because utterance-initial obstruents are qualitatively similar to the medial realisation of geminates (voiceless stop, voiceless fricative, voiced stop in the Bolognesi account), it is tempting to say that unlenited forms are equivalent to geminates, and geminates are exempt from lenition (Bolognesi Reference Bolognesi1998, Mereu Reference Mereu2020; cf. Ladd & Scobbie Reference Ladd and Scobbie2003 for Logudorese). The simulation in Fig. 10 asks whether phrase-initial singleton consonants can be modelled as phonologically equivalent to phrase-medial geminates, but with duration differences. The crossover values here come from the geminate series in Figs 7 and 8, and I apply those functions to putative singletons in phrase-initial position.
Observed and simulated phonetic features for phrase-initial singleton unspecified stops (left, centre) and fricatives (right), treated as geminates. Vertical lines show observed proportions with voicing or burst in the corpus for phrase-medial geminates and their phrase-initial singleton counterparts. Density curves show proportions over 10,000 simulations.
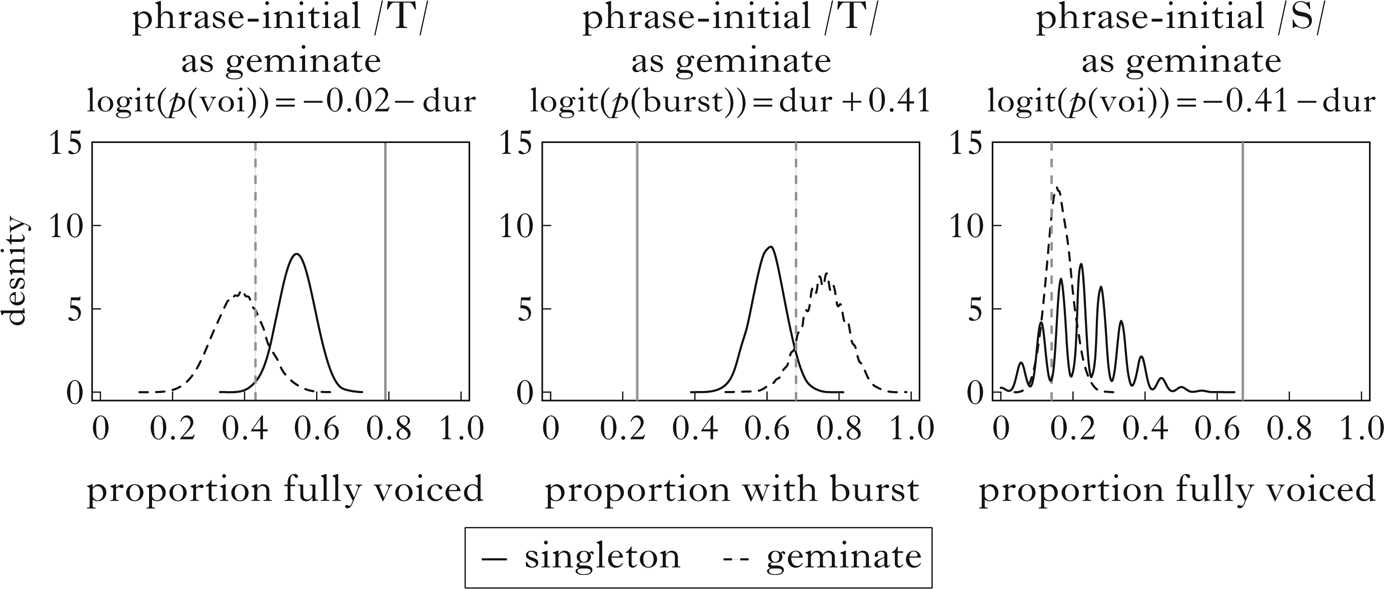
The simulations suggest that the distinction between putative singletons and geminates involves more than just duration. Observed probabilities of phonetic features in the corpus lie outside the range of all 10,000 simulations for both stops and fricatives. The lenis–fortis distinction does not behave like a phonological length contrast: lenition and fortition largely reduce to changes in duration, while geminacy contrasts must involve differences in constriction targets in addition to duration.
We can use the same reasoning to ask whether lenition and fortition change phonological features like [voice] or [continuant]. Perhaps, for instance, lenition changes underlyingly voiceless stops to [+voice], and differences in spirantisation between the two series are a function of the fact that the underlying [+voice] series is longer. Alternatively, lenition changes stops to [+continuant] and differences in voicing lenition between underlying stops and fricatives are due to duration. These two hypotheses are implemented in Fig. 11.
Observed and simulated phonetic features for non-voiced stops, treated as voiced stops (left) or continuants (right). Vertical lines show observed proportions with voicing or burst in the corpus for voiced stops or fricatives respectively and unspecified stops in phrase-medial position. Density curves show proportions over 10,000 simulations.
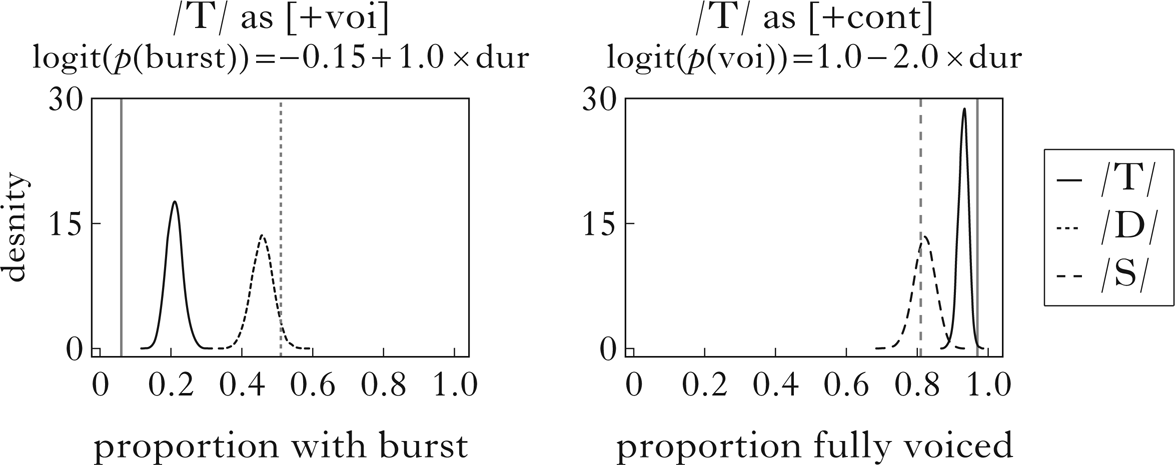
Again, these simulations fail, with the observed voicing of the unspecified stops outside the range of all 10,000 simulations, and observed burst presence on the extreme tail. Differences in voicing and continuancy between contrasting UR consonants are not predictable from their relative durations in the way that differences in voicing and continuancy between lenis and fortis consonants are. This constitutes an argument against treating lenition (or fortition) as a change in phonological features.
4.6 Sonorants and continuous phonetic measures
While lenition and fortition patterns are most conspicuous when they affect features such as voicing and continuancy, the theory of lenition as shortening also predicts gradient effects on the relative intensity or intensity slope of a consonant even in the absence of any qualitative manner changes. This is what Katz & Pitzanti (Reference Katz and Pitzanti2019) report in Campidanese, and there are similar findings in other languages (e.g. Kingston Reference Kingston, Colantoni and Steele2008 for Spanish, Ennever et al. Reference Ennever, Meakins and Round2017 for Gurindji and Cohen Priva & Gleason Reference Cohen2020 for American English). In this section I show that the model proposed here derives such effects, and argue that lenition and fortition should be considered global properties of the Campidanese prosodic system, rather than processes targeted at specific features.
A number of intensity-related measurements have been shown to be robust correlates of lenition processes, including minimum intensity (Bouavichith & Davidson Reference Bouavichith and Davidson2013), minimum intensity relative to other consonants with the same underlying features (Cohen Priva & Gleason Reference Cohen2020), minimum intensity relative to some part of a flanking vowel or transition (Warner & Tucker Reference Warner and Tucker2011, Ennever et al. Reference Ennever, Meakins and Round2017) and intensity slope/velocity during transitions to and from flanking vowels (Kingston Reference Kingston, Colantoni and Steele2008, Hualde et al. Reference Hualde, Simonet and Nadeu2011). We expect intensity to correlate with narrowness of constriction, and thus with manner: all else being equal, more sonorous sounds have higher intensity, with vowels being the most intense, and longer consonants are expected to achieve narrower constrictions. We therefore predict that lenition, whether it has obvious qualitative effects on manner or not, should increase intensity. In what follows, I model the minimum intensity during consonants, or, in the case of vowels, during transitions.
Katz & Pitzanti (Reference Katz and Pitzanti2019) report that drops in intensity during vowel-to-vowel transitions, when they exist, are longer and larger at higher-level prosodic boundaries. It is hard to know how to characterise this in gestural terms: even if prosodic boundaries boost the duration of domain-initial and domain-final vowels, we wouldn't necessarily expect there to be any intensity drop between two such vowels unless the offset of the first precedes the onset of the second. This could be the case for the minority of tokens in the corpus with an audible pause. For cases where there is no such pause, it may be that the two vowels are separated by a glide, which would itself be prosodically lengthened at higher-level boundaries (there is no apparent evidence for a VV vs. V-glide-V distinction in Campidanese). In a theory where the proximal goals of lenition are auditory rather than gestural (Kingston Reference Kingston, Colantoni and Steele2008, Katz Reference Katz2016), an intensity dip in this context can be seen as a goal in itself: rather than boosting the duration of consonants, the presence of a prosodic boundary in this type of theory boosts the duration of a disruption in intensity, however that goal is accomplished in gestural terms. This would help explain the presence of a variety of phonetic realisations of VV sequences in the corpus, including glide-like transitions, glottalisation and occasionally an audible pause. While we cannot settle this issue definitively with the data at hand, I assume that some target is elongated at a VV boundary, whether the target is primarily about separation between vowels or about specific phonetic events such as glides or glottalisation.
For the intensity model, I ran simulations much like those for the qualitative manner features in the preceding sections. All types of segment are assumed to have the same boost in (log) duration in phrase-initial position, but different inherent duration targets. Unlike the categorical variables, we can directly find the slope and intercept of the linear relationship between mean duration and mean intensity minima in phrase-medial and phrase-initial positions for each segment. Those slopes and intercepts, as well as intensity predictions, are shown in Fig. 12 for the unspecified stop series, nasal consonants and vowel-to-vowel transitions.
Observed and simulated minimum intensity for voiceless stops (left), nasals (centre) and vowel-to-vowel transitions (right). Vertical lines show observed mean values in the corpus for phrase-medial and phrase-initial positions. Density curves show mean values over 10,000 simulations with the sample size of the corpus.
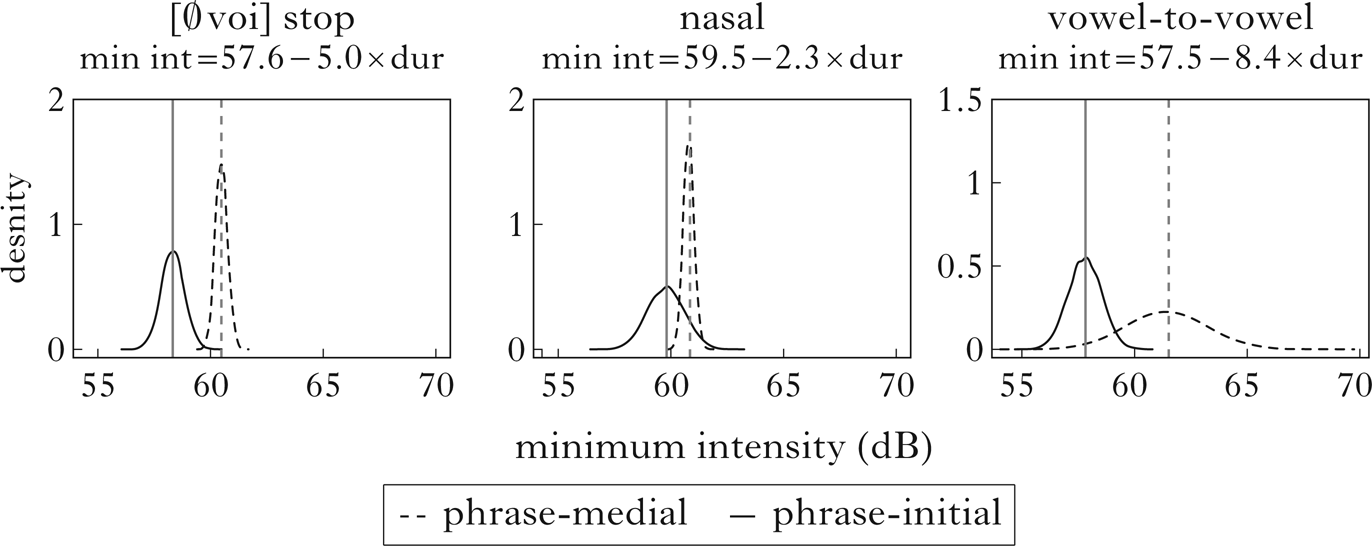
The model succeeds in predicting relative patterns of intensity minima in the corpus. Importantly, it captures the fact that intensity-based correlates of lenition are present for segments with clear qualitative manner changes (obstruents) and for segments without such qualitative changes (nasals, vowel-to-vowel transitions). Like stop bursts or voicing, minimum intensity differences by prosodic position are predictable from duration differences.
5 Implications of the model
5.1 What's special about Campidanese?
The formulation of the Campidanese lenition problem as ‘saltatory’ creates a number of issues for phonological accounts. I have attempted to show here that a phonetic formulation avoids those issues, while also offering a more unified and grounded approach to a greater variety of lenition facts. The phonetic model proposed here has no trouble describing the facts about voiced and non-voiced stops in Campidanese. There is still, however, a conceptual problem related to the ‘saltatory’ property of the non-voiced stop series. In this section I offer some tentative observations about the solution to that problem.
In Bolognesi's (Reference Bolognesi1998) account and following analyses, it is problematic that several features change in the /T/ series, while in the /D/ series a subset of those features fails to change. In the model proposed here, this problem can be recast as the fact that the /T/ series shows more phonetic variation between absolute-initial and non-initial positions than other consonants. Differences between utterance-initial and phrase-medial /T/ are near-categorical, as opposed to less categorical oppositions between these two contexts for other consonants. So there is a sense in which this model doesn't explain why saltation happens, but simply pushes it off into the phonetics.
There are a number of potential answers to the question of why this series of consonants changes so drastically between prosodic contexts. One possibility is that the Campidanese /T/ series is inherently variable because these consonants are unspecified for voicing. Because they have no laryngeal target, no effort is made to counteract any contextual influences on voicing or devoicing. While this does seem to be an accurate description of their laryngeal qualities, it can't be the only reason why these consonants pattern differently. Research in the laryngeal realism framework suggests that voiceless stops are phonologically unspecified for voicing in several other Romance languages, for example Italian and Spanish (Beckman et al. Reference Beckman, Jessen and Ringen2013), yet those stops do not behave the same way with regard to lenition. There are varieties of Spanish (Hualde et al. Reference Hualde, Simonet and Nadeu2011, Broś et al. Reference Broś, Żygis, Sikorski and Wołłejko2021) and Italian (Hualde & Nadeu Reference Hualde and Nadeu2011) with more extensive lenition of voiceless stops, but this is not a consistent feature of most varieties of either language. A related possibility is that the Campidanese /T/ series is unusual in being specified as having a shorter duration than other obstruents. Again, though, this can't be the whole explanation. I showed at length in §4.5 that differences in lenition between /T/ and other consonants cannot be reduced to differences in duration alone.
My preferred alternative to these hypotheses, which links short duration and context-dependency, is that the /T/ series is ballistic. This is what makes these sounds different from other obstruents in Campidanese, and from voiceless stops in other languages. By ‘ballistic’, I mean that these segments have a gestural or acoustic target that is point-like in time, and includes a direction of motion (towards the teeth, towards a lowered F3, etc.), but no specified or sustained degree of achievement (e.g. closure, target formant values). By hypothesis, the point-like targets for these sounds show relatively little variation in inherent duration by prosodic position (or any other factor), but their reflexes in terms of intensity, voicing and degree of closure will be highly variable, based on their degree of temporal overlap with preceding and following vowel targets. This would explain why they near-categorically voice, and fail to reach sustained closure between two domain-medial vowels, which presumably have the highest degree of overlap with each other and the consonantal gesture. The hypothesis also explains why these sounds are never voiced, and are usually stop-like in utterance-initial position. In the absence of carry-over voicing, there is no reason why they would spontaneously voice. And in the absence of a preceding wide-aperture or sonorous sound, the action of propelling some articulator in some direction is more likely to result in contact with another articulator, all else being equal. The ballistic hypothesis also helps explain why these utterance-initial stops are so unusual: as noted in §4.3, they often show weak bursts with substantial (non-aspiration) frication. More than half exceed 20 ms of frication following the burst. The idea that these ‘stops’ have no target for sustained closure helps explain why: ‘flinging’ one articulator towards another will sometimes result in contact, but rarely in the sustained closure characteristic of normal stops.
While the phonetic implementation model treated the /T/ series as stops unspecified for voicing, there is nothing in the model inconsistent with them being ballistic instead. The automated duration measurements used here, as noted in §4.1, can be seen as tracking temporal separation between a preceding vowel and a following consonantal target. We would expect the voicing and degree of closure for a ballistic sound to vary with its distance from the preceding vowel, just as for an underspecified stop.
There are a few pieces of independent evidence that support the ballistic hypothesis. Word-medially, consonants following a stressed vowel tend to have longer acoustic duration, but the /T/ series does not. This was tested with a linear mixed-effects model of word-medial consonant duration. Fixed effects are preceding and following stress, manner of articulation and the interaction between /T/ manner and stress. The model includes random intercepts for subject and word. The posttonic lengthening effect for all other consonants is roughly 0.35 standard deviations (t = 3.28), but for the /T/ series it is 0.63 standard deviations less (plausibly a shortening effect; t = ―3.18 for the interaction). The ballistic hypothesis offers a way to make sense of this difference: consonant targets are generally lengthened in posttonic position, but the point-like targets of the /T/ series have no inherent duration and thus can't be lengthened. This is different from the situation with regard to a prosodic boundary, which increases temporal separation between a consonant and preceding vowel regardless of whether the consonant can be lengthened.
Similar evidence comes from speech-rate effects in utterance-initial consonants. In general, we expect slower speech rate to correlate with longer segmental targets. This is normally the case for the acoustic duration of utterance-initial features such as pre-voicing in voiced stops, frication in voiceless fricatives and the overall duration of liquids and modal vowels. The duration of each of these segments and subsegmental components was hand-measured in utterance-initial position, and all correlate with mean syllable duration over the utterance (inverse of speech-rate): r ranges from 0.27 to 0.47 across manners, with all lower 95% confidence intervals greater than 0. For the /T/ series, however, the duration of burst and frication noise shows a slight effect in the opposite direction (r = ―0.17, p = 0.07): the noise portions of these stops are clearly not growing longer at slower speech rates. In this regard, they pattern more like sporadic glottalisation of initial vowels, which (when present) also fails to correlate robustly with speech rate (r = 0.04, p = 0.61). This is consistent with the idea that the closure and release properties of the /T/ series are not specified with targets of any duration, instead varying more or less randomly with regard to speech rate. In this regard they are like the glottalisation that occasionally accompanies the initiation of voicing in utterance-initial vowels, which is presumably not a gestural or acoustic target. Of course, we wouldn't necessarily expect VOT to correlate with speech rate even if these were ‘normal’ voiceless unaspirated stops (Beckman et al. Reference Beckman, Helgason, McMurray and Ringen2011, Schwarz et al. Reference Schwarz, Sonderegger and Goad2019), though we would expect VOT to be shorter than the observed median of 32 ms.
Finally, there are several varieties of Campidanese, including Iglesias, Cagliari and Maureddinu, where putative /t/ (and possibly /d/) is realised as the tap [ɾ] in lenition contexts (Bolognesi Reference Bolognesi1998, Mereu Reference Mereu2020). This shows that it is possible for the lenis forms of such consonants to be ballistic.
5.2 What's not special about Campidanese?
While the model presented here pertains to language-specific details of Campidanese, it should be clear that the general framework is meant to apply to lenition phenomena in many languages. In particular, §4.1 reviewed cross-linguistic evidence for longer and more fortis consonants at the beginnings of larger prosodic constituents, for lenition patterns that introduce changes distinct from those associated with any phonological contrast in the language in question and for lenition patterns that are predictable from prosodically driven changes in duration. The model proposed here links these properties to one another, and could be applied to any language with the type of non-neutralising or non-structure-preserving ‘continuity lenition’ discussed by Katz (Reference Katz2016). This includes a number of widely attested intervocalic lenition processes, such as spirantisation, voicing and tapping.
How would one assess whether the model makes the right predictions for other languages? First, in order to be within the scope of the model in the first place, there must be some prosodically conditioned lenition pattern that results in increased intensity or decreased duration in prosodic domain-medial intervocalic position (with extensions to other positions possible but not necessary). The model predicts that, if such a pattern exists, it is driven by the phonetic implementation of high-level prosodic structure and not by changes in phonological features. As such, we would expect these patterns to always involve duration, and segmental changes in manner or intensity to be partly or fully predictable on the basis of prosodically mediated duration. We would also expect that these segmental changes are unlikely to neutralise contrasts associated with phonological features. To the extent that this cluster of prosodic, phonetic and phonological factors tends to co-occur, it would support the current model over phonological feature-changing accounts of continuity lenition.
While I have reviewed evidence above for one or more of these properties occurring in many languages, there are few languages where all of them have been extensively investigated. American English is one of those languages. Coronal tapping is conditioned intervocalically preceding an unstressed syllable (or foot-medially), and has the potential to neutralise the /t/–/d/ distinction, but does so through non-structure-preserving means and frequently in an incomplete way (see de Jong Reference De Jong, van Oostendorp, Ewen, Hume and Rice2011 for a review). This forms part of a larger pattern of temporal and gestural reduction that affects other consonants in the same environment (Turk Reference Turk1993, Fougeron & Keating Reference Fougeron and Keating1997, Bouavichith & Davidson Reference Bouavichith and Davidson2013). The gradient increase in intensity associated with these effects appears to be largely predictable from prosodically conditioned differences in duration (Cohen Priva & Gleason Reference Cohen2020, Parrell & Narayanan Reference Parrell and Narayanan2018). Many varieties of Spanish display voiced stop spirantisation that is conditioned in intervocalic position within some prosodic domain (Harris Reference Harris1969), doesn't neutralise any phonological contrasts and is mirrored by shorter and more intense realisations of several other types of consonant (Kingston Reference Kingston, Colantoni and Steele2008). It has been suggested on the basis of correlations between duration and various articulatory and acoustic lenition measures that voiced stop lenition is predictable from changes in duration (Soler & Romero Reference Soler, Romero, Ohala, Hasegawa, Ohala, Granville and Bailey1999, Parrell Reference Parrell2011, Parrell & Narayanan Reference Parrell and Narayanan2018). But I am not aware of any study that tests this directly, or examines such correlations for any sounds other than stops. This state of affairs, where some subset of the relevant phonetic and phonological properties are known but others are not, holds in most languages described as having intervocalic lenition. The proposal in this paper is meant in part as a suggestion that future work on the phonetics and phonology of lenition attempt to explore links between prosodic structure, duration, gradient phonetic features and categorical phonological ones.


 Open access