


Introduction
Long-term exposure to the outer space environment may have blunted the immune functions of astronauts, which can increase the risk of infectious diseases caused by certain pathogenic microbes (Sonnenfeld and Shearer, Reference Sonnenfeld and Shearer2002; Buchheim et al., Reference Buchheim, Matzel, Rykova, Vassilieva, Ponomarev, Nichiporuk, Hörl, Moser, Biere, Feuerecker, Schelling, Thieme, Kaufmann, Thiel and Choukèr2019). Microgravity is a key factor of the outer space environment, where microbes can adapt and respond to the special environment stress through gene modification and phenotypic alterations (Wilson et al., Reference Wilson, OTT, Hoener zu Bentrup, Ramamurthy, Quick, Porwollik, Cheng, McClelland, Tsaprailis, Radabaugh, Hunt, Fernandez, Richter, Shah, Kilcoyne, Joshi, Nelman-Gonzalez, Hing, Parra and Dumars2007). Due to expensive cost and limited space, high-aspect-ratio rotating-wall vessels (HARVs) developed by NASA has been applied to cultivate microbes and thus provide low-shear simulated microgravity (LSSMG) in the conventional laboratory (Nickerson et al., Reference Nickerson, ott, Wilson, Ramamurthy and Pierson2004; Rosenzweig et al., Reference Rosenzweig, Abogunde, Thomas, Lawal, Nguyen and Jejelowo2010; Wang et al., Reference Wang, Yan, Rong, Wang, Wang, Liu, Wang, Yang and Han2016). Salmonella typhimurium showed increased virulence and resistance to acid stress and macrophage killing under SMG (Nickerson et al., Reference Nickerson, Ott, Mister, Morrow, Burns-Keliher and Pierson2000; Wilson et al., Reference Wilson, Ramamurthy, Porwollik, McClelland, Hammond, Allen, OTT, Pierson and Nickerson2002b), on the contrary, diminished virulence was found in some bacteria grown under SMG (Castro et al., Reference Castro, Nelman, Nickerson and Ott2011).
The genus Yersinia, a member of the family Enterobacteriaceae, is composed of 11 species, three of which (Y. pestis, Y. pseudotuberculosis, and Y. enterocolitica) are pathogenic for rodents and humans (Perry and Fetherston, Reference Perry and Fetherston1997). The most notorious species, Y. pestis, is the causative agent of plague. After Y. pestis invades the host, the type III secretion system encoded by the pCD1 plasmid can secrete a variety of effector proteins, which can inhibit the phagocytosis of host macrophages and down-regulate the inflammatory response, so that the Y. pestis can survive and multiply in the host (Pujol and Bliska, Reference Pujol and Bliska2005). The deadly pathogen is always maintained in nature dependent upon cyclic transmission between fleas and mammals. Y. pestis is regarded as a model pathogen for studying the mechanism of vector-mediated dissemination and pathogenesis.
Surprisingly, two non-pathogenic members of Yersinia genus, Y. frederiksenii and Y. intermedia have been found during several spaceflights of the International Space Station (Singh et al., Reference Singh, Wood, Karouia and Venkateswaran2018). Low-shear force might be common stress upon exposure of Y. pestis to spaceflight board or systematic infection within the human body and flea proventriculus. Previously, the Rosenzweig's group has initiated studies on the effect of microgravity on Y. pestis growth physiology and virulence potential. Y. pestis exhibited the impaired ability of cytotoxicity but no alterations in growth kinetics, cold-resistance, or antibiotic-sensitivity (Lawal et al., Reference Lawal, Jejelowo and Rosenzweig2010, Reference Lawal, Kirtley, van Lier, Erova, Kozlova, Sha, Chopra and Rosenzweig2013). Blood meals of fleas might provide the low-shear-force-like microenvironment to Y. pestis. The blocked bacterial masses in the flea proventriculus due to biofilm formation further contribute to the subsequent spread of mammalian infection. However, biofilm formation ability could not be observed in Y. pestis KIM derivative strain lacking of the pigmentation locus pgm (Lawal et al., Reference Lawal, Kirtley, van Lier, Erova, Kozlova, Sha, Chopra and Rosenzweig2013). How Y. pestis respond to mid-long-term microgravity stress remains to be investigated. Based on these considerations, here we used the Y. pestis biovar Microtus strain 201, which is avirulent to humans but highly lethal to mice, to evaluate the strain-specific effects of stimulated microgravity lasting for 40 days on virulence and biofilm production.
Material and method
Bacterial Strains and culture conditions
Y. pestis biovar Microtus strain 201 was isolated from Microtus brandti and is extremely lethal to mice but avirulent to humans and other large animals (Song et al., Reference Song, Tong, Wang, Wang, Guo, Han, Zhang, Pei, Zhou, Qin, Pang, Han, Zhai, Li, Cui, Qi, Jin, Dai, Chen, Li, Ye, Du, Lin, Wang, Yu, Yang, Wang, Huang and Yang2004). Y. pestis wild-type (WT) strain 201 was reserved in our lab, and used in this study. In general, Y. pestis was grown in lysogeny broth (LB) or agar plate at 26 or 37°C, unless otherwise specified. Resuscitated Y. pestis biovar Microtus strain 201 was inoculated at a dilution of 1:20 into the HARV bioreactors. When HARVs were filled with ~58 ml fresh LB medium and the bubbles were removed, the simulated microgravity (SMG) condition was generated by the HARVs' axis of rotation perpendicular to the gravity direction. On the contrary, the normal gravity (NG) cultivation condition was generated by the axis parallel to the gravity direction (Wang et al., Reference Wang, Yan, Rong, Wang, Wang, Liu, Wang, Yang and Han2016). There was a silicified gas-permeable membrane on the back of the HARVs, which can provide oxygen supply and prevent the leakage of liquid during bacterial culture.
Under the condition of 26°C and rotary speed of 25 rpm, Y. pestis was respectively grown to the middle exponential phase (2 × 10⁸ CFU ml−1) under the SMG and NG conditions, then diluted 20 times to new HARV bioreactors for 40 consecutive passages of cultivation.
Crystal violet staining
The biofilm formation ability of Y. pestis is assessed by the crystal violet staining as follows. With the cultures being removed, the bioreactors were washed lightly with phosphate buffer saline (PBS) and then were stained with 0.1% crystal violet solution for 20 min at room temperature.
In order to quantitatively analyse the difference of biofilm formation ability between SMG and NG group, the cultures were taken on a 24-well plate at a dilution of 1:100 (added 10 μl of bacterial culture to 1 ml of LB per well) and incubated for 24 h on a shaker at 37°C and 200 rpm. The optical density (OD) values were measured for each well at 620 nm. Remove the bacterial solutions thoroughly and put the 24-well plate at 80°C for 15 min to fix the biofilm. Each well was dyed with 3 ml 0.1% crystal violet solution for 15 min and washed three times with PBS. Each well was added with 2 ml dimethyl sulfoxide solution to dissolve the crystal violet, and measured the OD values at 570 nm. Finally, the ratios of OD570nm to OD620nm of each well were calculated.
RAW 264.7 cells intracellular survival assay
We used RAW 264.7 cells to evaluate the bacterial intracellular survival ability. The cultures grown to the middle exponential phase under SMG and NG groups were added to 24-well plates that contained 70–80% single-layer adherent RAW 264.7 cells at a multiplicity of infection (MOI) of ~5. At 0.5 h past infection (hpi), gentamycin was added to kill the extracellular bacteria and the infected cells were lysed by 500 μl of Triton-X solution. Then living bacteria counting of the lysate was performed on the agar plates in triplicate. The above operations were repeated at 4, 6, 8 hpi.
HeLa Cells cytotoxicity/rounding assay
HeLa cells were selected to evaluate the cytotoxicity of Y. pestis. Following the published methods for the HeLa cell rounding/cytotoxicity assay (Lawal et al., Reference Lawal, Jejelowo and Rosenzweig2010), saturated cultures of the SMG and NG groups were added to infect the HeLa cells in 12-well plates for 2.5 h at a MOI of ~50. The HeLa cells cytotoxic effects were evaluated by observing the cell rounding phenotype through optical microscopy.
However, HeLa cells may be rounded due to crowded growth and errors deriving from observing cell morphological changes with naked eyes. We decided to utilize the xCELLigence real-time cell analysis (RTCA, ACEA Biosciences Inc) system to analyse the dynamic and quantitative response profile of HeLa cells in vitro, and this technology is non-invasive and label-free. Cellular changes including cell number (cell index, CI) were recorded and analysed via the RTCA system (Pan et al., Reference Pan, Khare, Ackah, Huang, Zhang, Gabos, Jin and Stampfl2013; Roshan Moniri et al., Reference Moniri, Young, Reinheimer, Rayat and Warnock2015; Cetin and Topcul, Reference Cetin and Topcul2019). The principle of the RTCA system is to read the electronic readings change from the gold-plated sensor electrodes located on the bottom of microplates(E-plate). Electronic readings changes as the HeLa cells adhere or detach to the surface of the electrodes, CI values are drawn via the software calculation (Qiao et al., Reference Qiao, Xu, Zhao, Zhao, Shi, Zhao, Ye and Zhang2008).
Hella cells were added into the 8-well microplates (E-plate) and cultured at 37°C with 5% CO2 for 12 h. The bacteria grown under SMG and NG conditions were added into the E-plate for 24 h at a MOI of ~5. The cell index data were collected and analysed by the RTCA Data Analysis Software 1.0, and then the data was reanalysed per 2 h from 3-h to 36-h point using GraphPad Prism 5.0 software.
BALB/c mice infection assay
Saturated cultures grown under SMG and NG conditions were centrifuged at the rotary speed of 4,500 rpm, the supernatant was discarded, and the cells were diluted to a concentration of one hundred microliters containing 100 CFU or 10 CFU with phosphate-buffered saline (PBS). The actual number of bacteria contained per 100 microliters is counted through dropping on the Hottinger's Agar plates. We randomly divided 32 8-week-old BALB/c female mice into four groups, and the diluted bacteria of 40th passage were inoculated into each group with an intraperitoneal route. The infected mice were monitored for 14 consecutive days and recorded the number of dead mice daily. The survival curves were drawn with GraphPad Prism 5.0 software, and the p-values less than 0.05 were considered statistically significant through log-rank (Mantel-Cox) test. The BABL/c mice used in this experiment were provided by Beijing Vital River Laboratory Animal Technology Co. Ltd [laboratory animal permit no. SCXK (Jing) 2016-0006]. All mice participating in this experiment were treated in accordance with the guidelines for the welfare and ethics of laboratory animals.
RNA-seq-based Transcriptional analysis
The cultures in SMG and NG bioreactors were grown to saturation (OD620nm = 1.0) as mentioned before. Each group was set as three biological replicates. The mRNAs were obtained by removing the ribosomal RNA (rRNA) from the total RNA extracted by the PureLink™ RNA Mini Kit (Invitrogen, Thermo Fisher Scientific, USA), and then used for creating cDNA library and deep sequencing. According to the values of FPKM (Fragments Per Kilobase Million), the ratio of transcript levels between SMG and NG groups were used as the logarithm to the base of 2 (Two-Fold Change), for example, a two-fold change value of 1.0 indicates a 2-fold greater expression of a certain gene. The differential values at least 2-fold were applied to analyse the differential expression of genes according to the Y. pestis 91001 genome annotation.
Quantitative real-time PCR
The total RNA was extracted as described above, and purified by TURBO DNA-free ™ Kit (Invitrogen, Thermo Fisher Scientific, USA) upon the manufacturer's instructions. The total RNAs were reverse transcribed into cDNA as templates by SuperSript™ Reverse Transcription Kit (Invitrogen, Thermo Fisher Scientific, USA). Seven genes were selected and performed for quantitative RT-PCR (qPCR). All primer pairs were designed to produce amplicons with expected sizes of 50–200 nt through the Primer Premier 5.0 software (Table 1).
Primers of the target genes used in qRT-PCR

Meanwhile, the highly expressed 16S ribosomal RNA gene was chosen as the reference gene to draw the relative standard curve, in order to quantitatively compare and analyse differential expression levels of the target genes. We diluted each cDNA sample to a concentration of 5 ng μl−1 as the template of the qRT-PCR reaction. The components of the qRT-PCR reaction system are shown in Table 2.
The reaction system of qPCR

The qPCR was carried out in the Light Cycler R480 quantitative PCR instrument (Roche, CA, USA) and its software would calculate the relative fold change of target genes in the RNA samples of SMG and NG groups. The reaction procedure of qPCR is shown as Table 3.
The reaction procedure of qPCR

Results
Assessment of biofilm formation ability of Y. pestis grown under SMG
The biofilm formation ability was assessed by evaluating the amount of biofilm formed and adhered on the silicified gas-permeable membrane on the back of the bioreactors. We found that the amount of biofilm in the SMG bioreactor was higher than that in the NG bioreactor (Fig. 1(a)).
Biofilm measurement of Y. pestis grown under SMG or NG conditions by crystal violet staining. (a) The biofilms formed on the back of bioreactors were stained with crystal violet. (b) By calculating the ratio of the OD570 nm to OD620 nm values, the biofilm formation ability was quantitatively analysed by GraphPad Prism 5.0 software (p = 0.0067, using Student t test).
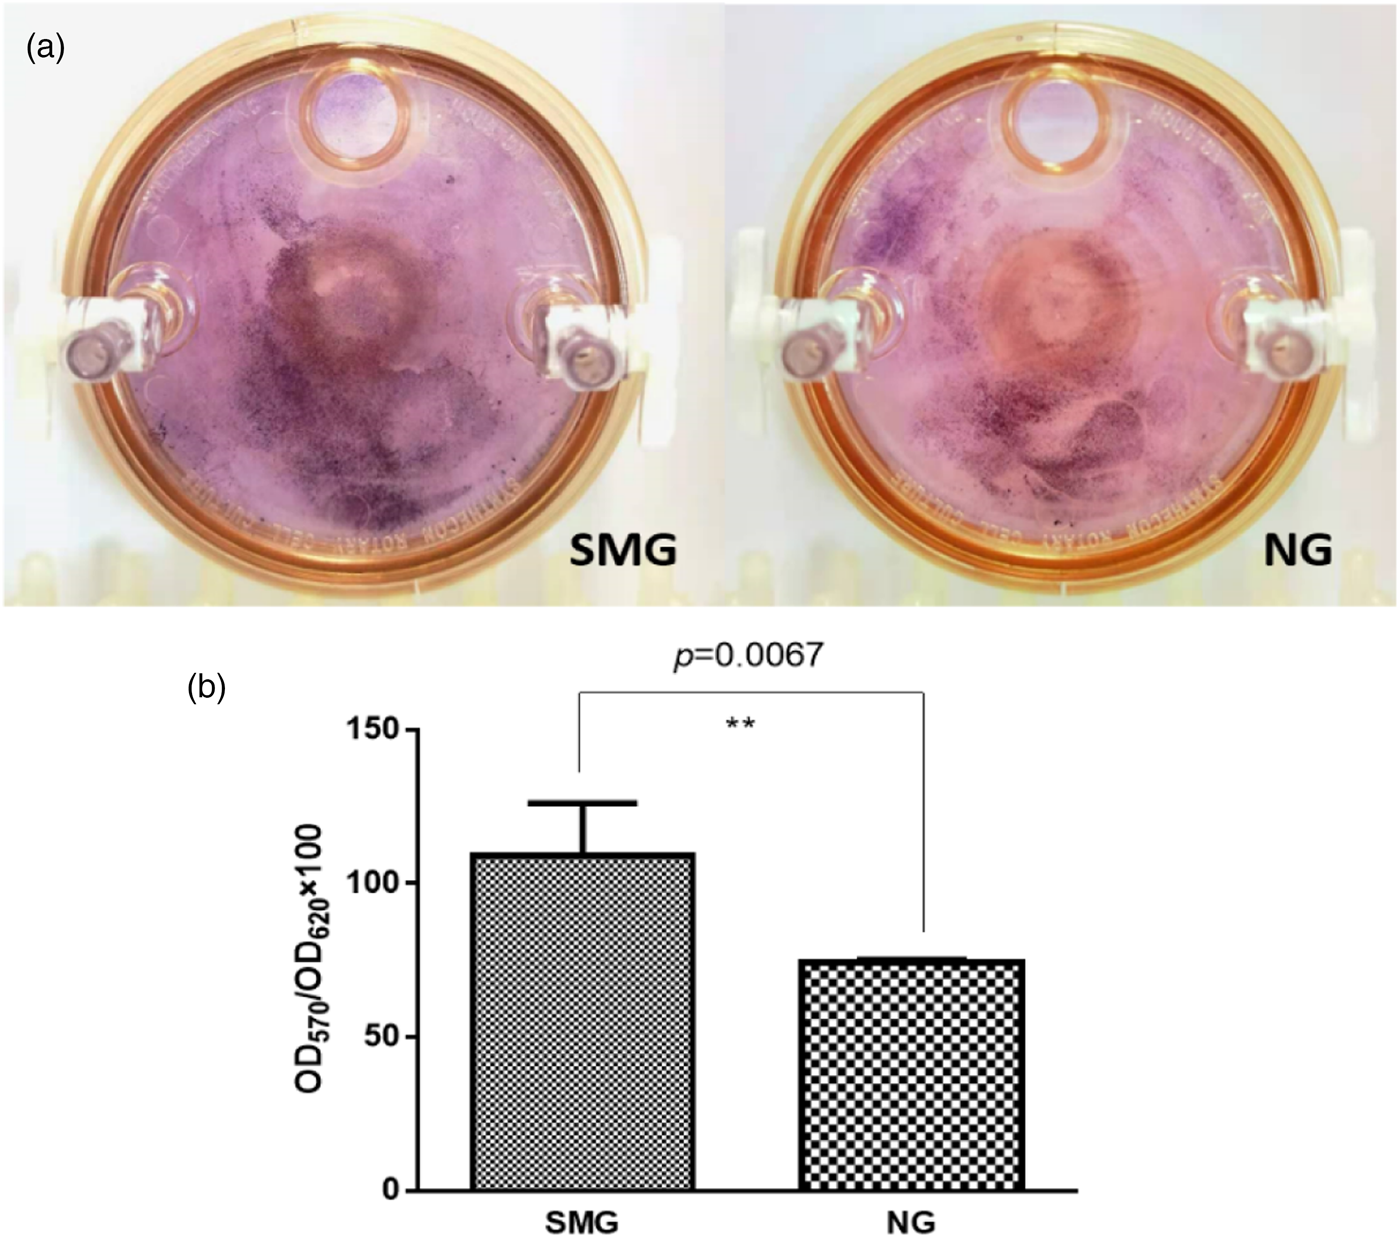
In order to quantitatively evaluate the biofilm formation ability, the OD570nm values of crystal violet staining were divided by the OD620nm values of cultures in the 24-well plates before staining. This operation eliminated the influence of the different numbers of bacterial in each well. By calculating the ratio of OD570nm to OD620nm values, the SMG group had higher values than the NG group (~109 and 74.3 of mean value in the SMG and NG group, respectively) (Fig. 1(b), p < 0.05, using Student t test), indicating that SMG condition increased the biofilm formation ability of Y. pestis.
Assessment RAW 264.7 cells intracellular survival ability of Y. pesits grown under SMG
In RAW 264.7 cells intracellular survival assay, the trend of the SMG group was almost consistent with the NG group (Fig. 2(a)). The mean values of survival rate at 8-hour past infection (hpi) were 2.85% (SMG) and 2.47% (NG), respectively. The survival rates of Y. pestis in RAW 264.7cells at 8-hpi had no statistically significant difference (p = 0.5835, using the Student t test) between SMG and NG groups (Fig. 2(b)). The figure of 8-hpi was just the representative result in that the same trend was shown at other time points. This result indicated that the microgravity environment cannot change the viability of Y. pestis in macrophages.
Survival dynamics of SMG- and NG-grown Y. pestis within RAW 264.7 macrophages. (a) The amount of RAW264.7 cells in each hole of the 24-well plate is 4 × 10⁴ and RAW 264.7 cells of each hole were infected by 10 μl cultures (OD620nm = 1) grown under SMG or NG condition at a MOI of ~5. The survival percentage was expressed as the ratio of the amount of intracellular living bacteria at a certain-time point to the absolute amount of that at 30-min. (b) At 8-hpi, the differences in RAW 264.7 cells intracellular survival rate were not statistically significant.

Assessment of cytotoxicity of Y. pestis under SMG
The normal morphology of HeLa cells was irregular fusiform, while the infected HeLa cells were shown varying degrees of rounding. At a MOI of ~50, approximately 23% of SMG-grown Y. pestis-infected HeLa cells (Fig. 3(a)) were extremely rounded relative to 68% of NG-grown counterpart (Fig. 3(b)) at 3-h past infection (hpi), indicating that SMG reduced the cytotoxicity of Y. pestis to some extent.
Monitoring of HeLa cells damages by comparing the proportion of rounding cells between SMG and NG group. The saturated HeLa cells were infected by Y. pestis grown under SMG (a) and NG (b) conditions at a MOI of ~50, that is, each hole of a 12-well plate contains 5 × 10⁴ HeLa cells, and 12.5 μl cultures (OD620nm = 1) were added in. Based on the number of rounding cells in the vision field, rough ratios of rounding cells were calculated.

The xCELLigence RTCA system could be used to quantitatively assess the degree of cytotoxicity (Roshan Moniri et al., Reference Moniri, Young, Reinheimer, Rayat and Warnock2015). Due to differences in cell growth in the first 12 h (Fig. 4(a)), the cell index was normalized at the 12-h point to eliminate the influence of different cultivated cell number of each well. The cell index data per 2 h from 3-h to 36-h point was reanalysed using GraphPad Prism 5.0 software (Fig. 4(b)). Apoptosis of HeLa cells appeared under SMG condition was relatively less than NG condition, indicating that SMG weakened the cytotoxicity of Y. pestis.
Quantitative Analysis of HeLa cells cytotoxicity by the real-time cell analysis (RTCA). 300 μl of HeLa cell suspension at a concentration of 5 × 10⁵ cells ml−1 was added into each well of the E-plate and cultivated in the E-plate for 12 h, and then added 3.75 μl cultures (OD620nm = 1.0) grown under SMG or NG condition into each hole at a MOI of ~5, the cultures grown under SMG and NG conditions were respectively into each well in triplicate. (a) The last well containing HeLa cells only was regarded as the negative control. (b) After being normalized by index data at 12 h, the cell index data was drawn per 2 h during the period of 3 to 36 h using GraphPad Prism 5.0 software.

Assessment of virulence of Y. pestis under SMG
Mice were separately inoculated intraperitoneally with Y. pestis grown under SMG or NG conditions. The 40th passage cultures were injected into each mouse with a high (100 CFU) or a low (10 CFU) challenge dose. For the high dose, the actual number of bacteria injected into a mouse was 414 CFU for the SMG group and 323 CFU for the NG group. For the low dose, the actual number of bacteria was 42 CFU for SMG and 36 CFU for NG.
At the higher challenge dose, 7 of 8 mice infected with the SMG-grown Y. pestis survived on the day 3 post infection (p.i.), while 4 of 8 mice with NG group died despite starting with relatively low numbers of inoculated bacteria. Upon day 5 p.i., all mice infected with NG-grown Y. pestis died while the deaths of all mice with SMG were delayed by 3 days (Fig. 5(a)). A similar tendency was also seen at the lower challenge dose as shown in Fig. 5(b). The difference of survival percentage between the two groups of infected mice was statistically significant (p = 0.0006). This result indicated that the virulence of Y. pestis was weakened under a microgravity environment.
Survival curves of BABL/c mice infected by Y. pestis grown under SMG and NG conditions. (a) Each mouse was intraperitoneally inoculated by actual dose of 414 CFU of SMG group and 323 CFU of NG group. The survival curve had statistical significance (p = 0.206). (b) Mice were challenged with 42 CFU of SMG cultures and 36 CFU of NG cultures. The survival curve indicated a significant difference between two groups (p = 0.0006). Survival was monitored for 14 days.

Detection of the differential expressions of 218 genes between SMG and NG groups
To identify the differential expressions of genes which were regulated by SMG condition relative to NG condition, RNA-seq and quantitative RT-PCR technologies were used to compare the transcripts between SMG and NG groups (The raw data of RNA-seq was submitted to the SRA database on NCBI Accession to cite for these SRA data: PRJNA700490). According to the RNA-seq data, a total of 218 genes were found, including 91 upregulated and 127 downregulated genes which were indicated by at least a 2-fold change in expression (with 95% confidence) in the SMG group relative to the NG group. According to the KEGG pathway database, some of the differentially regulated genes were classified into 32 functional classes (Table 3), of them most were related to biosynthesis and material metabolism. We also found different expression of some virulence-related genes, such as YP_RS21365 (yopE), YP_RS21080 (yopH) in Yersinia infection pathway and YP_RS19170 (virG/yscW) in the bacterial secretion system pathway (Table 4).
KEGG pathway of differentially regulated genes in Y. pestis under SMG condition

Of all the differentially expressed genes, we noticed that dozens of well-characterized virulence genes of Y. pestis were downregulated, including genes responsible for Type-III secretion system (yopH, yopE, yscW, yscA, yscB, lcrH), for iron metabolism (fyuA, irp and ybt cluster), caf1 operon encoding capsular antigen and the pla gene encoding plasminogen-activating protease. The downregulation of these genes might partially account for the impaired virulence observed in cell cytotoxicity and mice infection assays. The RT-PCR result correlated well with the RNA-seq data as shown in Fig. 6, although the relative values were obtained higher based on RT-PCR than that on RNA-seq.
Relative expression of SMG group relative to NG group by qRT-PCR (black) and RNA-seq (grey).

Discussion
In recent years, microgravity-induced responses of many pathogenic bacteria have been widely characterized. Salmonella typhimurium grown under SMG exhibited increased virulence and resistance to acid stress and macrophage killing (Nickerson et al., Reference Nickerson, Ott, Mister, Morrow, Burns-Keliher and Pierson2000; Wilson et al., Reference Wilson, Ramamurthy, Porwollik, McClelland, Hammond, Allen, OTT, Pierson and Nickerson2002b), while diminished virulence was found in Staphylococcus aureus grown under SMG (Castro et al., Reference Castro, Nelman, Nickerson and Ott2011). In our study, Y. pestis showed increased biofilm formation ability and reduced cytotoxicity and virulence under SMG. These results suggest different microbes respond differently to the microgravity. The research scope in this field has been extended beyond pathogens directly related to spaceflight (Klaus and Howard, Reference Klaus and Howard2006; Singh et al., Reference Singh, Wood, Karouia and Venkateswaran2018). Phenotypic variation accelerated by stimulated microgravity or spaceflight broadens our insights into virulence mechanisms of various bacteria. In this study, SMG-induced changes of both pathogenesis and biofilm formation were observed in Y. pestis strain 201 grown for 40 successive passages within the HARV bioreactor. In agreement with the research finding of Rosenzweig's group focusing on the short-term effect of SMG on Y. pestis cells (Lawal et al., Reference Lawal, Jejelowo and Rosenzweig2010, Reference Lawal, Kirtley, van Lier, Erova, Kozlova, Sha, Chopra and Rosenzweig2013), the degree of HeLa cells damage was reduced to some extent upon infection of SMG-grown Y. pestis compared with NG-grown counterpart. The decreased cytotoxicity could be mainly attributed to repression of type III secretion system (T3SS) function, which allows Y. pestis to inject the effector proteins into the cytosol of eukaryotic cells (Cornelis, Reference Cornelis2002; Torruellas et al., Reference Torruellas, Jackson, Pennock and Plano2005) and thus impede the phagocytosis and killing from host cells (Rosqvist et al., Reference Rosqvist, Forsberg, Rimpiläinen, Bergman and Wolf-Watz1990; Iriarte and Cornelis, Reference Iriarte and Cornelis1998). These speculations were also corroborated by our results of RNA-seq data.
The type III secretion system (T3SS) of gram-negative bacteria is responsible for delivering the effector proteins (e.g. Yops, Ysc, and so on) directly into the interior of host cells (Ghosh, Reference Ghosh2004). The effector proteins interfere with the host cell's natural immune function, including inhibiting the host's inflammatory response, inhibiting non-specific immune protection, preventing the bacteria from phagocytosis and killing by phagocytes, etc., so that the bacteria can survive and proliferate, and then establish a continuous infection (Torruellas et al., Reference Torruellas, Jackson, Pennock and Plano2005). In addition to the differential expression of the T3SS-related genes, we also observed the changes in the expression of many virulence factors of Y. pestis strain 201 such as pH6 antigen (Lindler et al., Reference Lindler, Klempner and Straley1990), Pla (Sebbane et al., Reference Sebbane, Jarrett, Gardner, Long and Hinnebusch2006; Zimbler et al., Reference Zimbler, Schroeder, Eddy and Lathem2015), F1 antigen (Du et al., Reference Du, Rosqvist and Forsberg2002) and other iron-metabolism-related proteins (Ybt and FyuA) (Bearden et al., Reference Bearden, Fetherston and Perry1997; Fetherston et al., Reference Fetherston, Kirillina, Bobrov, Paulley and Perry2010) under SMG condition. The differential expression of these genes might be implicated in virulence attenuation of SMG-grown Y. pestis. However, this alteration of virulence phenotype was not observed in mice challenged with 1 × 10⁸ CFU of NG- and SMG-grown Y. pestis KIM/D27 by Rosenzweig's group. Similarly, the bacterial cultures of the 20th passage used to infect mice failed to attenuate the virulence (data not shown). In spite of different dose administration and different strain usage between the two studies, we are more inclined to speculate that the long-duration maintenance under SMG might be a more important contributor for the virulence alteration. Then we considered whether the current phenotypic differences were caused by mutations or loss of certain genes, so the Y. pestis strain 201, 15th, 35th and 60th bacteria grown under SMG and NG conditions were selected for whole-genome sequencing. The results failed to find obvious single nucleotide polymorphism or fragment insertion-deletion of the target genes, which also shows that the phenotypic change of Y. pestis under SMG conditions is not caused by certain gene mutation or fragment insertion-deletion.
Biofilm is a membrane formed by the adhesion of polysaccharides, lipoproteins, fibrin and other substances secreted by bacteria and it can improve the ability of bacteria to adapt to the environment, anti-phagocytosis and drug resistance (Costerton et al., Reference Costerton, Stewart and Greenberg1999; Mah and O'Toole, Reference Mah and O'Toole2001; Branda et al., Reference Branda, Vik, Friedman and Kolter2005). Enhanced ability of bacterial biofilm formation under SMG condition has been reported in Salmonella, K. pneumoniae and etc. (Wilson et al., Reference Wilson, Ott, Ramamurthy, Porwollik, McClelland, Pierson and Nickerson2002a; Wang et al., Reference Wang, Yan, Rong, Wang, Wang, Liu, Wang, Yang and Han2016). It is generally supposed that the ability of biofilm formation is positively correlated with bacterial pathogenesis. However, the opposite trend of biofilm formation ability and virulence was seen in SMG-grown Y. pestis. This phenomenon might be explained by the complex life cycle of Y. pestis, in which fleas are used as vectors to involve in bacterial dissemination. Y. pestis occurring in natural foci relies on the complex network of dissemination between wild rodents and fleas. Y. pestis colonizes the flea guts and gradually forms thick biofilms that block the flea proventriculus. The constant biting of the starving fleas injects the blood containing Y. pestis into new host bodies, which promotes the spread of plague (Hinnebusch et al., Reference Hinnebusch, Jarrett and Bland2017). We noticed however, that the putative biofilm-related genes of Y. pestis didn't exhibit the differential expressions.
Conclusions
In this study, we used HARV to study the phenotypic changes of Y. pestis in a microgravity environment. SMG condition reduces the expression of plague-related virulence genes, resulting in weakened virulence, which is different from other Gram-negative bacteria. The blood cells can maintain a continuous suspension state, indicating that bacteria could also face with a microgravity-like environment during the process of disseminating with blood. Therefore, research on pathogens in the microgravity environment is helpful to study their changes in the body (Lawal et al., Reference Lawal, Jejelowo and Rosenzweig2010). Since the regulation of Y. pestis biofilm is a very complicated process, and post-transcriptional regulation is considered to be the most important process (Martínez and Vadyvaloo, Reference Martínez and Vadyvaloo2014), our future work will focus on relevant sRNAs to explore the potential effects on enhanced biofilm formation ability of Y. pestis under SMG condition.
Authors contributions
YL performed experiments, analysed the data and wrote the manuscript. LW, YC and YL carried out the experiments and investigated the literature. RY provided overall directions throughout the study. YH designed the experiments, analysed the data, provided overall directions and contributed to manuscript revisions.
Financial support
This study was funded by the Key Program of Logistics Research (Grant No. BWS18J012 & BWS17J030).
Conflict of interest
All authors declare that they have no conflict of interests.
Ethical standards
This study was carried out in compliance with the ARRIVE guidelines. The ethical approval of animals was obtained from the Beijing Institute of Microbiology and Epidemiology Ethics Committee. This article does not contain any studies with human participants performed by any of the authors
Data availability statement
We guarantee that all data in the study are true and reliable. Data to support the findings in this study can be obtained from Ye Li.


