


Introduction
With herbicide resistance continuing to spread across the United States in weeds such as Palmer amaranth (Amaranthus palmeri S. Watson), waterhemp (Amaranthus spp.), and horseweed [Conyza canadensis (L.) Cronq.], there is a need for new herbicides to provide control of these broadleaf weeds in soybean and cotton (Heap Reference Heap2017; Kruger et al. Reference Kruger, Davis, Weller and Johnson2010; Meyer et al. Reference Meyer, Norsworthy, Young, Steckel, Bradley, Johnson, Loux, Davis, Kruger, Bararpour, Ikley, Spaunhorst and Butts2015). Research has documented that dicamba will effectively control these problem weeds and others when used properly in DR cotton and soybean (Byker et al. Reference Byker, Soltani, Robinson, Tardif, Lawton and Sikkema2013; Cahoon et al. Reference Cahoon, York, Jordan, Everman, Seagroves, Culpepper and Eure2015). However, off-target movement of herbicide to susceptible crops is of concern.
Off-target movement of pesticides can be complex, in that spraying equipment, wind speed, crop stage, crop sensitivity, atmospheric conditions, and properties of the spray solution may all interact to influence the extent of a drift event (Heidary et al. Reference Heidary, Douzals, Sinfort and Vallet2014; Lofstrom et al. Reference Lofstrom, Bruus, Anderson, Kjaer, Nuyttens and Astrup2013). Many regulations have been enacted pertaining to these variables for dicamba application in DR soybean and cotton to limit off-target movement of the herbicide (Anonymous 2017c, 2017d). Although lack of applicator training could still result in misapplications, uninformed applicators are not the sole cause of misapplication (Bish and Bradley Reference Bish and Bradley2017).
Off-target movement may occur as primary or secondary movement. Primary movement occurs at the time of application with the physical movement of spray droplets from the target to an off-target site. Influences on primary drift include spray droplet spectrum, wind speed, boom height, temperature, relative humidity, and spray pressure (Bueno et al. Reference Bueno, da Cunha and de Santana2017; Maybank et al. Reference Maybank, Yoshida and Grover1974, Reference Maybank, Yoshida and Grover1978; Threadgill and Smith Reference Threadgill and Smith1975).
Herbicides can also be prone to volatilization after application occurs. Some formulations of dicamba, such as the dimethylamine (DMA) salt formulation, have been known to readily volatilize and cause injury to nearby non-DR soybean (Behrens and Lueschen Reference Behrens and Lueschen1979). Increased temperature from 20 to 30 C is documented to double soybean response from the DMA salt of dicamba within closed chambers. Furthermore, reduced humidity of 70% to 75% increased soybean response from volatility of the DMA salt of dicamba in closed-chamber experiments (Behrens and Lueschen Reference Behrens and Lueschen1979).
Recently, lower volatile formulations of dicamba have been labeled for use in DR crops (Anonymous Reference Anonymous2017a, 2017b, 2017e). XtendiMax® with VaporGrip® (Monsanto Company, St Louis, MO) is a combination of the previously available diglycolamine (DGA) salt of dicamba and an additive that is purported to reduce volatility by inhibiting formation of free dicamba acid (MacInnes Reference MacInnes2017). DuPont Crop Protection (Wilmington, DE) also markets this exact formulation under the brand name FeXapan™ herbicide plus VaporGrip® technology. Additionally, the N,N-Bis-(aminopropyl) methylamine form of dicamba (Engenia®, BASF Corporation, Research Triangle Park, NC) was granted registration. This form of dicamba is also purported to have reduced volatility compared with other formulations (Westberg and Adams Reference Westberg and Adams2017).
Currently, 26 nozzles are approved for use in the application of XtendiMax® with VaporGrip® (Anonymous 2017c), whereas only 13 nozzles are allowed for use with Engenia® (Anonymous 2017d). Nozzle selection is very important in achieving the desired droplet size to limit primary off-target movement (Heidary et al. Reference Heidary, Douzals, Sinfort and Vallet2014). Herbicides tank mixed with dicamba may also influence droplet size of the spray solution, as the addition of S-metolachlor to Engenia® was documented to reduce median droplet size by 28% when Turbo TeeJet® air induction (TTI) nozzles were used (Meyer et al. Reference Meyer, Norsworthy, Kruger and Barber2016).
An ecological risk assessment for dicamba under the Endangered Species Act, using soybean as a bioindicator of risk based solely on plant height and weight reduction but not the presence of symptoms or yield loss, was completed by the Environmental Protection Agency before approval of the herbicide for use in DR soybean and cotton (EPA 2016). The XtendiMax®, FeXapan™, and Engenia® labels require a 33.3- or 67.1-m downwind application buffer to the field edge when applying 560 or 1,120 g ae ha−1 of dicamba, respectively, if vegetation exists, such as a grass strip or tree line; the higher rate may only be used before crop emergence. Hence, this buffer must be present from the last row treated (or planted, if applied before emergence) to any non-crop vegetated area. However, buffers are not applicable when DR cotton or soybean are bordered by at least 33.3 m (or 67.1 for the 1,120 g ae ha−1 rate) of DR cotton or soybean, corn (Zea mays L.), sorghum [Sorghum bicolor (L.) Moench], proso millet (Panicum miliaceum L.), small grains, sugarcane (Saccharum officinale L.), fields prepared for planting, areas covered by the footprint of a manmade structure with walls and roof, roads, paved surfaces, or graveled surfaces.
Soybean is highly sensitive to dicamba and may develop injury symptoms, such as leaf cupping, following low-dose exposure (Auch and Arnold Reference Auch and Arnold1978; Weidenhamer et al. Reference Weidenhamer, Triplett and Sobotka1989). However, injury to soybean from dicamba does not always translate into seed yield reduction (Al-Khatib and Peterson Reference Al-Khatib and Peterson1999; Barber et al. Reference Barber, Norsworthy, Scott and Hightower2017; Kelley et al. Reference Kelley, Wax, Hager and Riechers2005; Miller and Norsworthy, Reference Miller and Norsworthy2018; Solomon and Bradley Reference Solomon and Bradley2014; Soltani et al. Reference Soltani, Nurse and Sikkema2016; Weidenhamer et al. Reference Weidenhamer, Triplett and Sobotka1989; Westberg et al. Reference Westberg, Schmitz, Brommer and Bowe2016). Although some research has documented yield reduction to be similar among growth stages (Foster and Griffin Reference Foster and Griffin2016; Kelley et al. Reference Kelley, Wax, Hager and Riechers2005; Weidenhamer et al. Reference Weidenhamer, Triplett and Sobotka1989), others have documented the early flowering stages (R1 to R2) to be most yield limiting when compared with vegetative stages (Griffin et al. Reference Griffin, Bauerle, Stephenson, Miller and Boudreaux2013; Robinson et al. Reference Robinson, Simpson and Johnson2013; Soltani et al. Reference Soltani, Nurse and Sikkema2016; Solomon and Bradley Reference Solomon and Bradley2014). Conditions such as drought and high temperatures around the time of exposure to dicamba have been shown to influence soybean yield (Al-Khatib and Peterson Reference Al-Khatib and Peterson1999; Andersen et al. Reference Andersen, Clay, Wrage and Matthees2004; Auch and Arnold Reference Auch and Arnold1978; Kelley et al. Reference Kelley, Wax, Hager and Riechers2005; Weidenhamer et al. Reference Weidenhamer, Triplett and Sobotka1989). Soybean growth habit has also been cited as influencing response to low rates of dicamba (Auch and Arnold Reference Auch and Arnold1978; McCown et al. Reference McCown, Barber, Norsworthy, Rose, Ross and Collie2016b; Wax et al. Reference Wax, Knuth and Slife1969; Weidenhamer et al. Reference Weidenhamer, Triplett and Sobotka1989). Therefore, the variability in seed yield loss among growth stages could possibly be due to environmental conditions or growth habit of soybean used in the conflicting studies.
Previous research has examined herbicide drift from ground applications (Bueno et al. Reference Bueno, da Cunha and de Santana2017; Heidary et al. Reference Heidary, Douzals, Sinfort and Vallet2014; Lofstrom et al. Reference Lofstrom, Bruus, Anderson, Kjaer, Nuyttens and Astrup2013). Drift models have proved useful from these studies, and practices of reducing physical drift of herbicides by increasing droplet size or velocity are now used by applicators. However, these studies were conducted at close range (<50 m) and attempted to quantify drift by using materials to catch particles to later be analyzed by laboratory equipment. Furthermore, the use of materials to catch drifting particles may underestimate or be unable to quantify the amount of dicamba reaching farther distances, because the carrier may evaporate or dicamba may volatize before settling. Because of the high sensitivity of soybean to dicamba, the crop is an excellent bioindicator to measure off-target movement.
The objectives of this research were to: (1) identify the distance dicamba moved after a foliar application of the DGA salt of dicamba to reproductive soybean from a high-clearance sprayer using soybean injury, height, and yield as bioindicators; (2) evaluate correlations between soybean injury, height, pod malformation, and yield when exposed to dicamba through an actual drift event; and (3) determine the relationship between soybean response variables and the distance from the area where DGA dicamba was applied. At the initiation of these experiments, new formulations of dicamba (Engenia®, XtendiMax®) were not available; therefore, Clarity® herbicide was used. Newer forms of dicamba may indeed be lower in volatility than Clarity and hence result in less off-target movement. However, the scope of this experiment was not solely to evaluate the distance of off-target movement but to establish relationships among environmental and injury variables and strive to understand dicamba drift effects at various reproductive growth stages.
Materials and Methods
Twenty-five field experiments were conducted in 2014 and 2015 at the Northeast Research and Extension Center in Keiser, AR, to examine off-target movement of DGA dicamba using a sprayer setup that was anticipated as meeting requirements for applying new formulations of dicamba in DR soybean and cotton (Anonymous 2013, 2014). One additional experiment was conducted at the Lon Mann Cotton Research Station (LMCRS) near Marianna, AR, in 2015 in a commercial production field. Indeterminate, glufosinate-resistant soybean, MG 4.7-4.9, was planted on 96-cm-wide rows in all experiments at a rate 300,000 seed ha−1. All drift experiments were conducted using the commercially available DGA formulation of dicamba branded Clarity® (BASF Corporation, Raleigh, NC). Timing for dicamba applications was restricted to the soybean reproductive stages of R1 through R6. The growth stage breakdown of the 25 experiments are as follows: R1 (6), R2 (6), R3 (5), R4 (2), R5 (2), and R6 (4). Dicamba was applied at 560 g ae ha−1 using a Bowman MudMaster Sprayer (Bowman Manufacturing, Newport, AR 72112) with an 8-m-wide boom at 50 cm above the crop canopy traveling 16 km h−1. The high-clearance sprayer was equipped with TeeJet® AIXR 11003 nozzles (TeeJet Technologies, Wheaton, IL 60187) and calibrated to deliver 93.5 L ha−1 at 275 kPa to achieve a very coarse droplet spectrum. It is acknowledged that the current nozzles recommended for the new formulations of dicamba do not include AIXR 11003 nozzles. Rather, the current labels permit use of certain nozzles that produce either an extremely coarse or ultracoarse droplet spectrum. However, at the beginning of this study, it was publicized that very coarse spray spectrums, along with outputs of 93.5 L ha−1, would be allowed for dicamba application (Anonymous 2013, 2014).
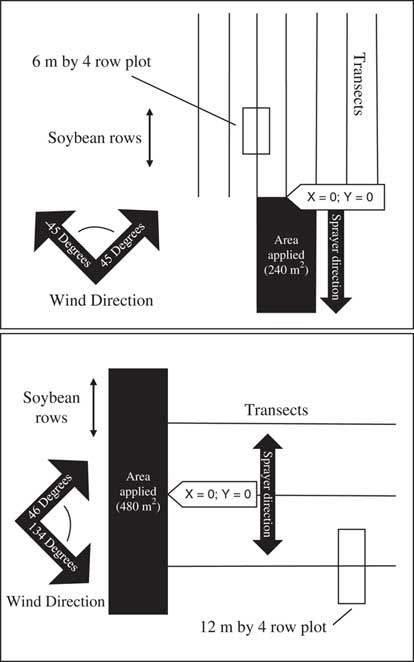
The application area was 8 by 30 m in size where the wind blew parallel or less than 45° to the soybean rows (Figure 1A) and 8 by 60 m in size where the wind blew perpendicular or greater than 45° to the soybean rows (Figure 1B). There was only one application area per experiment. In some cases, multiple experiments were executed in one day but with enough distance between them so that contamination between experiments did not occur as indicated by uninjured soybean between experiments. Handheld Kestrel anemometers (Nielson-Kellerman, Birmingham, MI) were used to record wind speed every second during applications. Angle of wind direction, temperature, and relative humidity were also recorded at the time of application. At 28 d after application (DAA) in experiments where the wind was greater than 45° from the soybean rows, three transects were established across rows extending downwind from the area sprayed (Figure 1B). The centers of transects were initiated at 18, 30, and 42 m into the 60-m application swath. Each plot was 4 rows, spaced 96 cm and 12 m in length, with only the center two being used for data collection. Plots were established every 4 rows along transects until no injury was observed or the end of the field was reached. In experiments in which the wind was less than 45° from the soybean rows, transects were laid out extending downwind from the center and to the left and right side of the downwind edge of the 8 by 30 m application area in 4-row increments until no injury was observed laterally. Plots were established down rows in 6-m lengths until no injury was observed. Again, rows were spaced 96 cm, and data were collected from the center 2 of 4 rows. Grid coordinates were given to each plot, with x = 0 and y = 0 being the center of the downwind edge of the application.
Design of drift trials with wind predominately occurring (A) down rows and (B) across rows.

Visible soybean injury and three random canopy heights were recorded at 28 DAA for each plot. A visual scale from 0% to 100%, with 100% being plant death, was used to estimate soybean injury. The percent of pods malformed and the height to the terminal node of 3 individual plants per plot were recorded at soybean maturity. Both canopy height and mature height were converted to a percent relative to uninjured plots by selecting three random plots having 0% soybean injury (outside the drift plume) at 28 DAA. The percentage of pods malformed was recorded on a 0% to 100% scale, with 0 being no pod malformation and 100 being all pods having malformation. A small-plot combine was used to harvest plots, and grain yields were corrected to 13% moisture before being converted to a percentage yield relative to uninjured plots.
Correlation analysis was conducted using JMP Pro v. 12 (SAS Institute, Cary, NC), and Pearson pairwise correlations were produced between injury at 28 DAA, relative canopy height at 28 DAA, percentage of mature pods malformed, relative terminal height at maturity, and relative yield. Contour maps were constructed using SAS v. 9.4 (SAS Institute) for all trials illustrating 28 DAA injury, 28 DAA relative height, relative terminal height at harvest, percent of pods malformed at harvest, and relative yield. Regression analysis was performed using a single line of data closest to the center of the drift plume as determined by the contour maps in conjunction with injury ratings and exact distance to the center of each plot from the center of the edge of the application area. Essentially, the plot reported to have the highest injury at 28 DAA in each transect was closest to the center of the drift plume. These same plots were used in the regressions for 28 DAA relative canopy height, percent of pods malformed, relative terminal height, and relative yield.
Because the location of each plot was represented by an x and y value, exact distance to the center of each plot was computed using the Pythagorean theorem. These data were used to construct models to determine the distance to 5% injury at 28 DAA, 5% canopy height reduction at 28 DAA, 5% terminal height reduction at harvest, pod malformation at harvest of 5%, and 5% yield loss for each drift event. Five percent injury was chosen, as the authors believe this is an amount of injury that will be easily noticed by the average grower. The regression models were tested using SigmaPlot (Systat Software, San Jose, CA) regarding significance (α = 0.05) and goodness of fit [r2, Akaike Information Criterion (AIC), Baysian Information Criterion (BIC)]. Exponential models have been used previously to describe spray deposition as a function of distance from a drift event (Bueno et al. Reference Bueno, da Cunha and de Santana2017). One-, two-, three-, and four-parameter models were tested, and a three-parameter exponential model was chosen. Measures of AIC and BIC were used to compare across models with the lowest values indicating the best fit. Regression figures were assembled using JMP Pro v. 13 (SAS Institute).
Results and Discussion
Correlations between Soybean Injury, Height, Pod Malformation, and Yield
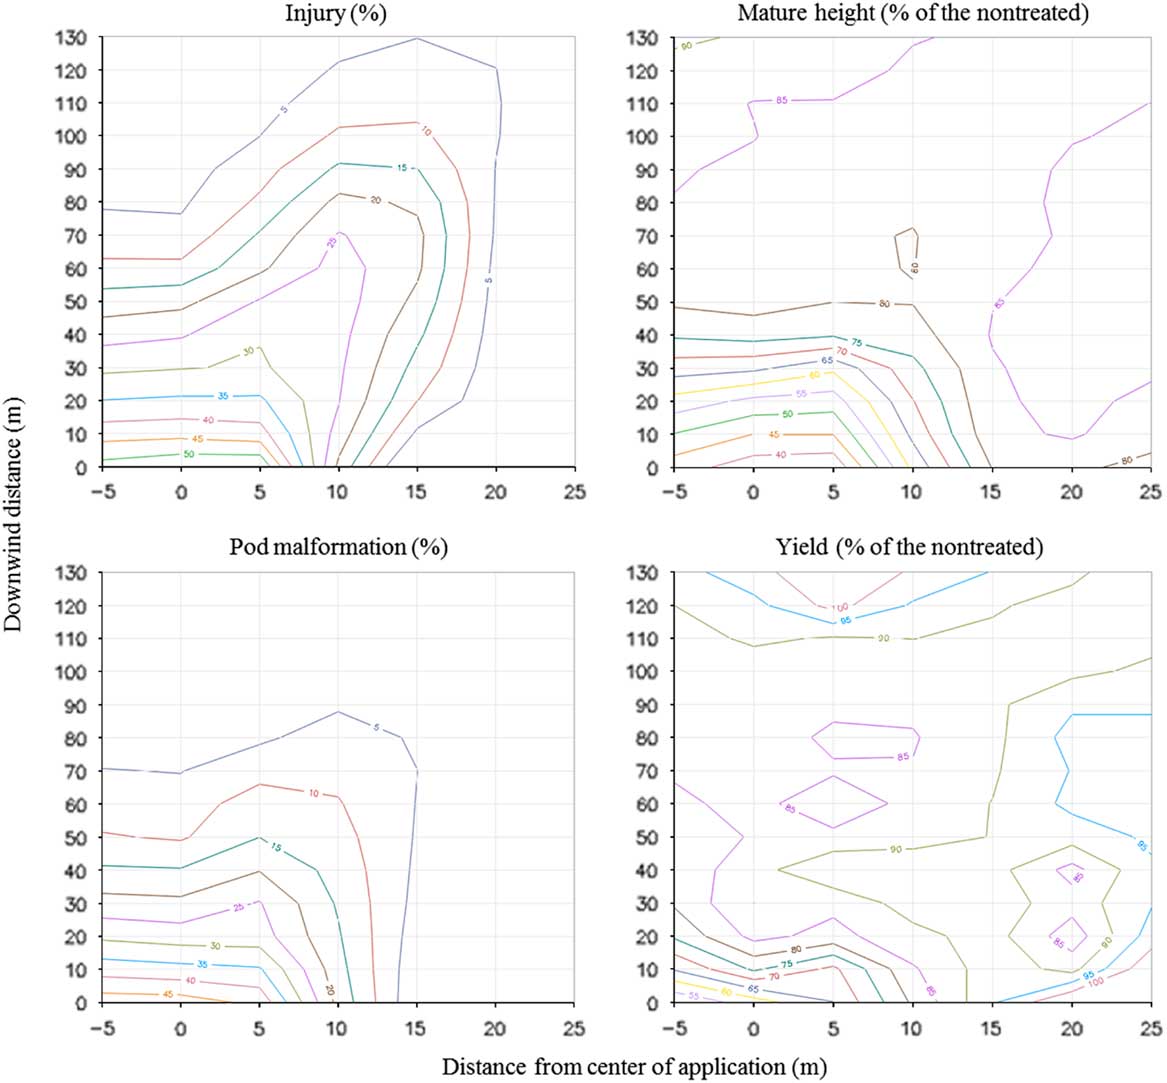
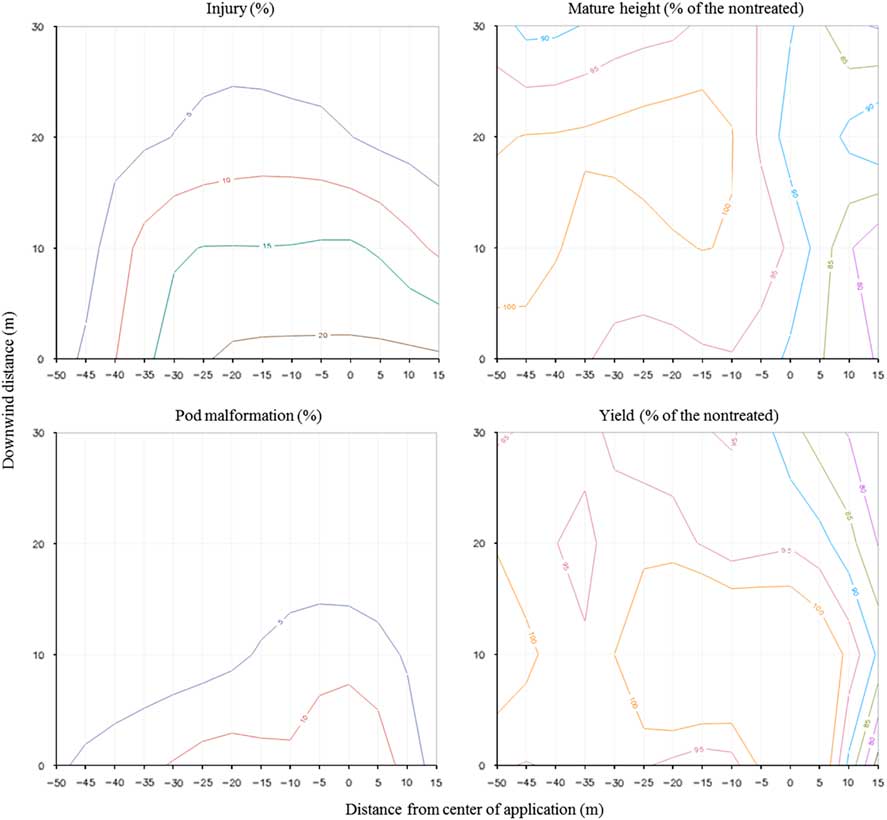
Generally, relationships between parameters evaluated were stronger following drift events at flowering stages (R1 to R2) than at pod (R3 to R4) or seed-forming stages (R5 to R6) (Table 1; Figures 2–7). For example, the resemblance in contour maps among pod malformation at harvest, plant height at harvest, and injury 28 DAA, and to a lesser extent grain yield, can be seen for a, R1 and R5 growth-stage drift event (Figures 8 and 9). Correlations between observations were greatest when the drift events occurred at the R1 growth stage, likely because the opportunity for growth before maturity is greater at the R1 growth stage (Table 1). Previous research has also documented the flowering stages to be most sensitive to seed yield loss compared with vegetative or later reproductive stages (Auch and Arnold Reference Auch and Arnold1978; Griffin et al. Reference Griffin, Bauerle, Stephenson, Miller and Boudreaux2013; Robinson et al. Reference Robinson, Simpson and Johnson2013; Solomon and Bradley Reference Solomon and Bradley2014; Wax et al. Reference Wax, Knuth and Slife1969).
Correlation coefficients and confidence intervals (95%) for soybean injury, height at 28 d after application (DAA), height at harvest, pod malformation at harvest, and yield after a diglycolamine dicamba drift event.a
a Correlation coefficients were computed on a pairwise method.
b Sample sizes: R1(481), R2(557), R3(333), R4(118), R5(81), R6(66).
c Soybean injury was rated on a 0% to 100% scale with 100% being plant death.
d Heights and yield were converted to a percentage of the uninjured, with the uninjured being the average of three random plots within each trial having no injury at 28 DAA.
e Pod malformation ratings were taken as a percentage of pods malformed per plant.
* Significance to α ≤ 0.01.
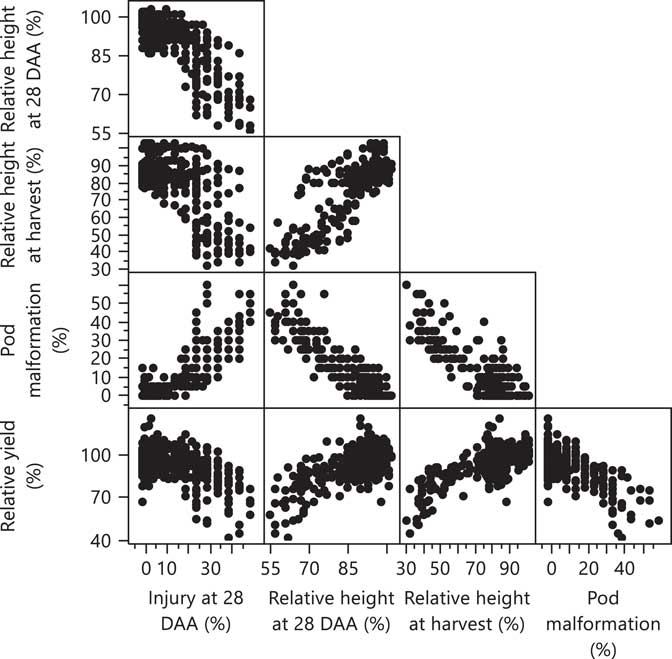
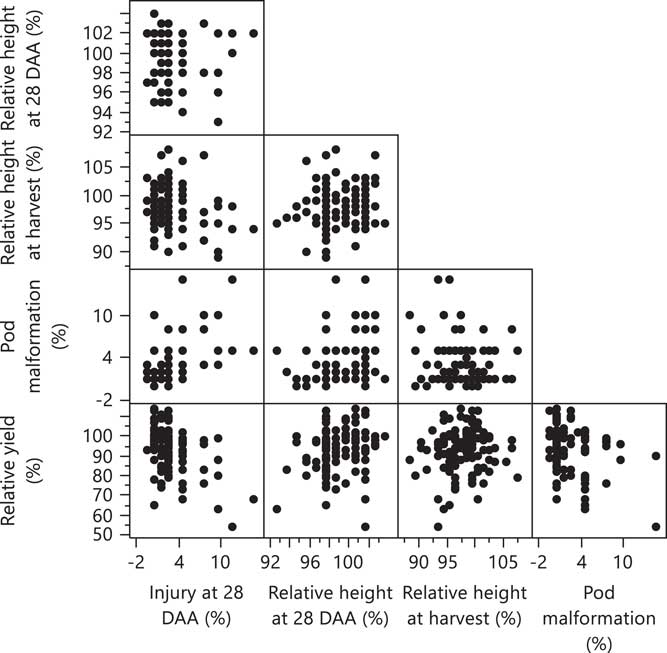
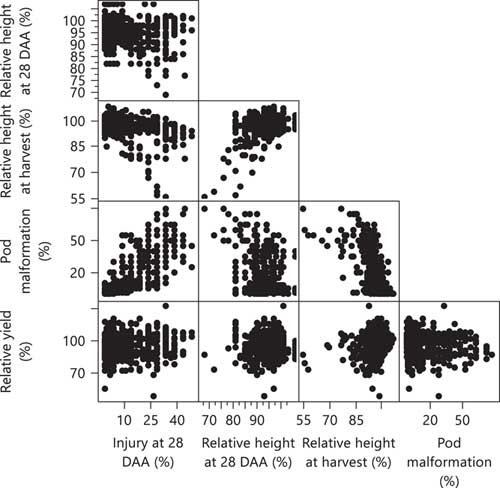
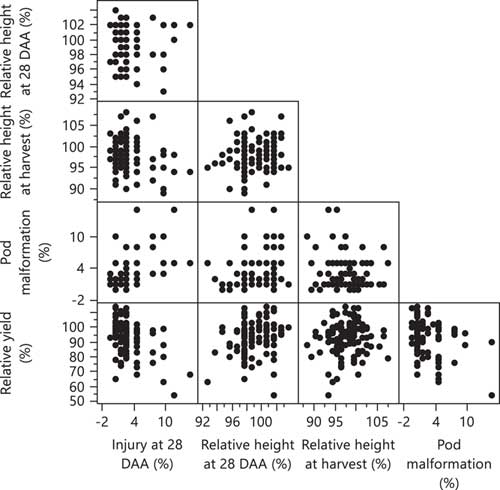
Scatter plot matrix of soybean observations after a diglycolamine dicamba drift event at R1. Heights and yield are reported as percentage of the uninjured. Uninjured is referring to the average of three random plots outside the drift plume that were recorded to have no visual injury at 28 d after application (DAA).
Scatter plot matrix of soybean observations after a diglycolamine dicamba drift event at R2. Heights and yield are reported as percentage of the uninjured. Uninjured is referring to the average of three random plots outside the drift plume that were recorded to have no visual injury at 28 d after application (DAA).
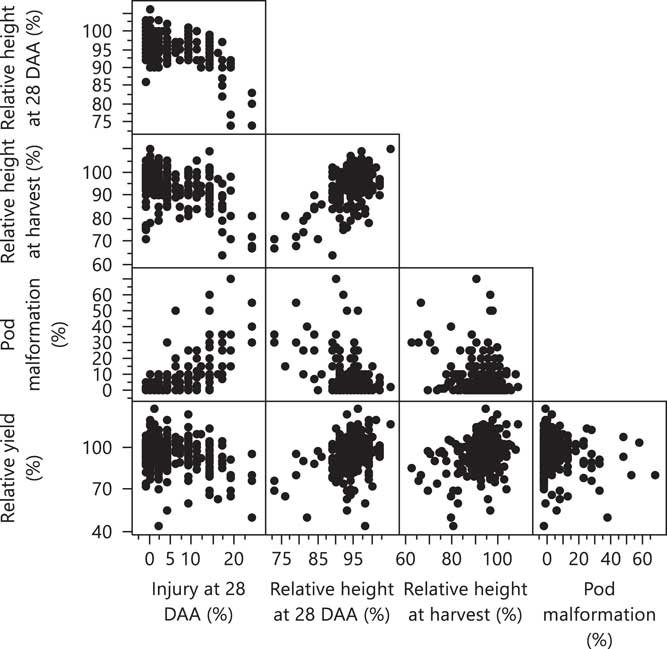
Scatter plot matrix of soybean observations after a diglycolamine dicamba drift event at R3. Heights and yield are reported as percentage of the uninjured. Uninjured is referring to the average of three random plots outside the drift plume that were recorded to have no visual injury at 28 d after application (DAA).
Scatter plot matrix of soybean observations after a diglycolamine dicamba drift event at R4. Heights and yield are reported as percentage of the uninjured. Uninjured is referring to the average of three random plots outside the drift plume that were recorded to have no visual injury at 28 d after application (DAA).
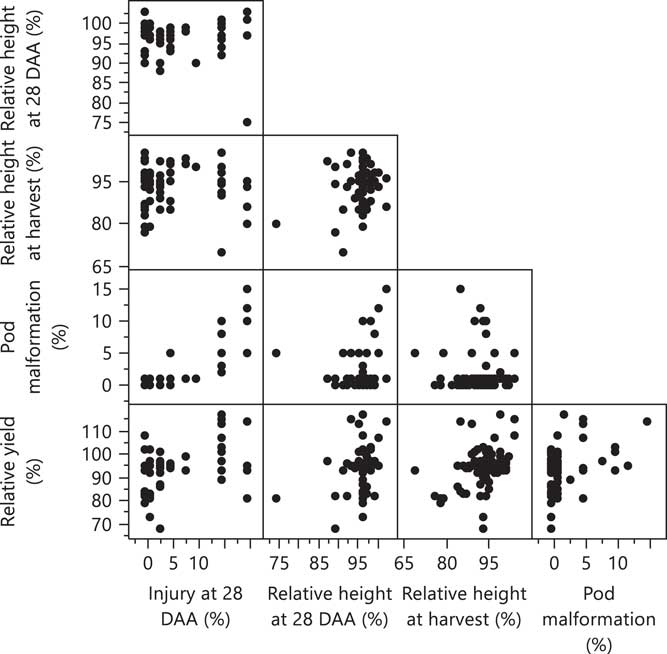
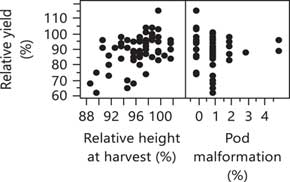
Scatter plot matrix of soybean observations after a diglycolamine dicamba drift event at R5. Heights and yield are reported as percentage of the uninjured. Uninjured is referring to the average of three random plots outside the drift plume that were recorded to have no visual injury at 28 d after application (DAA).
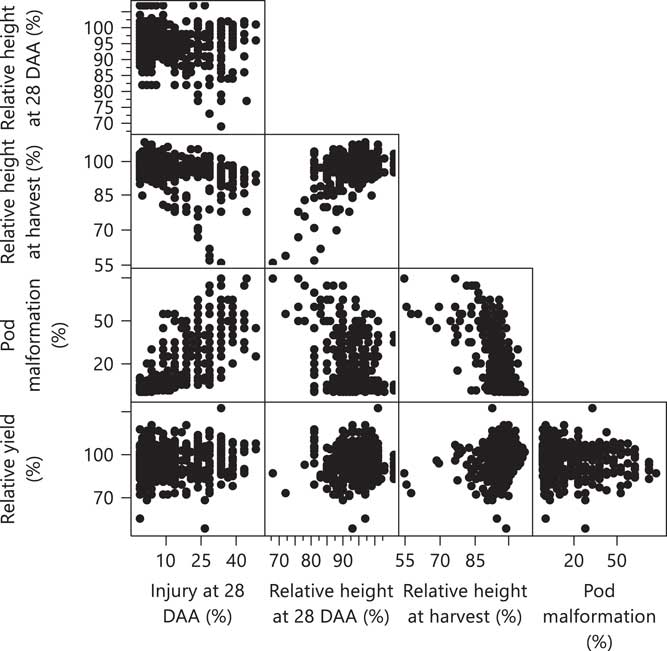
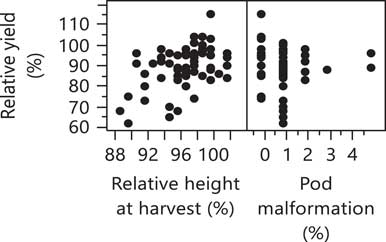
Scatter plot matrix of soybean observations after a diglycolamine dicamba drift event at R6. Measurements at 28 d after application (DAA) were not taken for R6 drift trials due to soybean leaf drop as the crop was approaching maturity. Heights and yield are reported as percentage of the uninjured. Uninjured is referring to the average of three random plots outside the drift plume that were recorded to have no visual injury at 28 DAA.
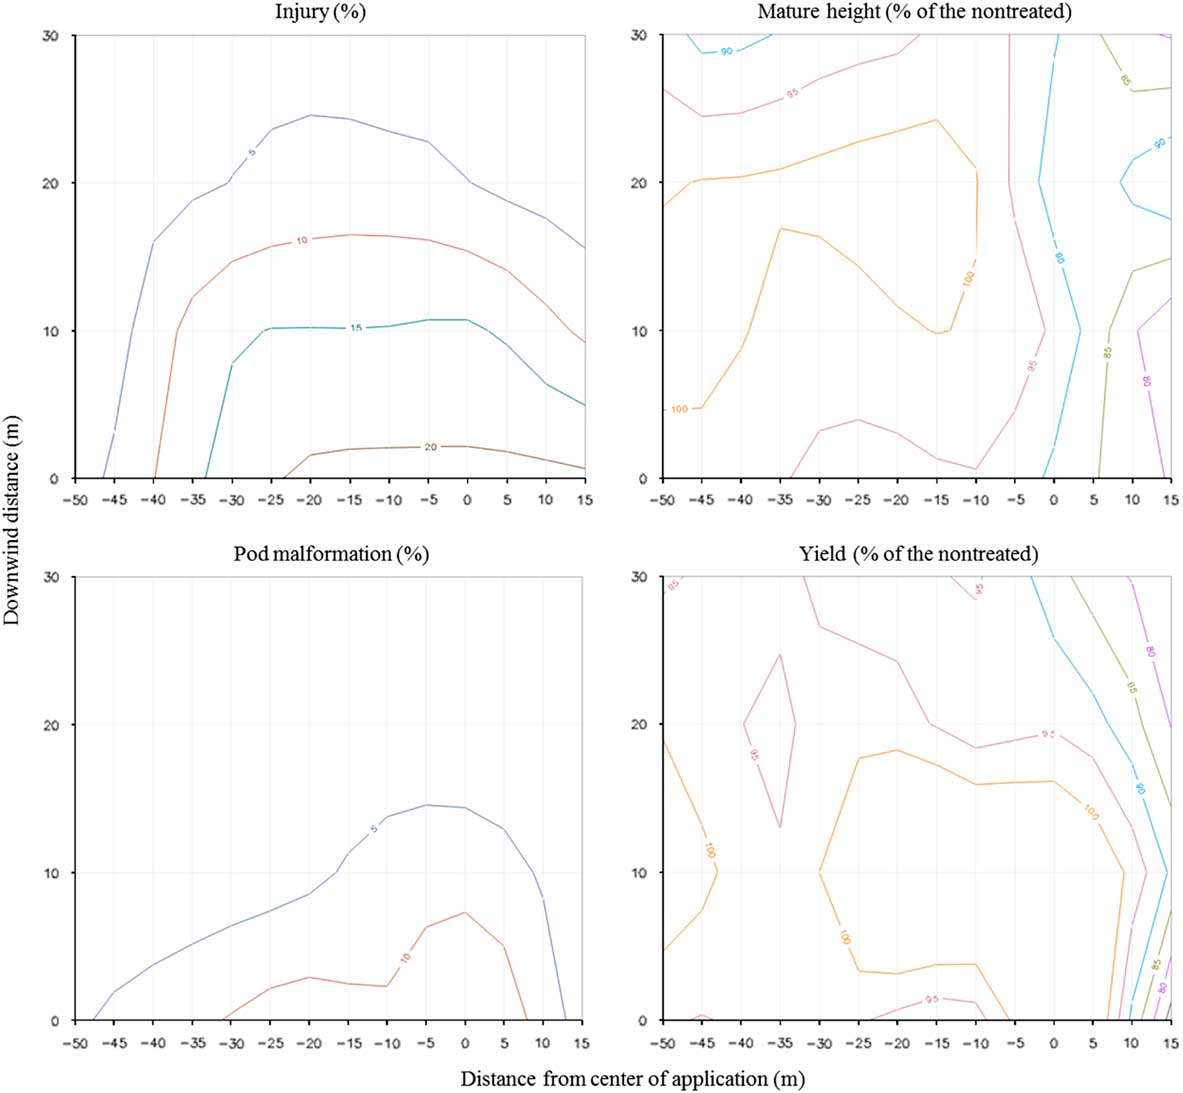
Contour maps illustrating soybean injury, mature height, pod malformation, and yield for off-target movement of dicamba onto R1 soybean in Trial 1. Soybean injury was rated on a scale from 0% to 100%, with 0% being no injury and 100% being plant death. Pod malformation is presented as a percent of total pods malformed. The nontreated is the average mature height or yield of three random plots within the trial (but outside the drift plume) observed to have no injury at 28 d after application.
Contour maps illustrating soybean injury, mature height, pod malformation, and yield for off-target movement of dicamba onto R5 soybean in Trial 20. Soybean injury was rated on a scale from 0% to 100%, with 0% being no injury and 100% being plant death. Pod malformation is presented as a percent of total pods malformed. The untreated is the average mature height or yield of three random plots within the trial (but outside the drift plume) observed to have no injury at 28 d after application.
Soybean injury associated with R1 and R2 drift events was often 2-fold that seen in later drift events (Figures 2 and 3). When soybean is exposed to dicamba, the effects are only seen in new growth, because dicamba translocates to newly formed meristematic tissue (Senseman Reference Senseman2007). Therefore, injury seen after early reproductive soybean is exposed to dicamba will primarily be noticed as leaf cupping, because vegetative growth is still occurring at a rapid pace in indeterminate cultivars (Heatherly and Elmore Reference Heatherly and Elmore2004). When pod formation begins (R3), vegetative growth slows considerably, resulting in less visible soybean injury (Figure 4).
The impact of dicamba drift on soybean height and pod malformation at harvest varies across growth stages (Figures 2–7). Reductions in height appear more common at earlier reproductive stages. As soybean plants approach maturity, there is less capacity for height reduction, because plants are at or near maximum height. The percentage of soybean pods malformed was as high as 80% for R2, 70% for R3, and 60% for R1 drift events (Figures 2–4). Because all varieties used in these studies were indeterminate in growth habit, pod malformation was still noticed in the upper nodes of soybean plants at up to 15% for R4 and R5 and 5% for R6 field experiments (Figures 5–7).
Of utmost importance is the relationship between relative yield (%) and the other measured parameters, as seen in Figure 2 for the R1 drift events. The correlation coefficients relating relative yield to injury at 28 DAA, relative height at 28 DAA and at harvest, and pod malformation at harvest were −0.5055, 0.6157, 0.6687, and −0.6535, respectively (Table 1; Figure 2). For drift events beyond the R1 growth stage, there appeared to be less of a relationship between the measured soybean parameters and relative soybean yield. Even for drift events as early as the R2 growth stage, assessment of injury at 28 DAA was not correlated with relative yield, which further points to the fact that growing conditions following a drift event will partially dictate the potential for soybean recovery.
Wind Speed versus Distance Moved
Twenty of the 26 drift trials were included in the wind by distance analysis. Six trials were removed due to having an insufficient number of data points. Average and maximum wind speeds during application for each of the 20 drift trials are shown in Table 2. There was no significant correlation between average or maximum wind speed during application and the calculated distance to 5% soybean injury when analyzed within a growth stage or across growth stages (unpublished data). Although wind speed has been documented to greatly affect drift of pesticides, atmospheric conditions such as temperature and humidity could play a vital role in dicamba off-target movement (Behrens and Lueschen Reference Behrens and Lueschen1979). Other research also observed the amount of 2,4-D drift (also a synthetic auxin) not to be highly dependent on average wind speeds (Wolf et al. Reference Wolf, Grover, Wallace, Shewchuk and Maybank1992). Yet more research in this area may be needed, as the range of wind speeds observed may have been limiting in our research. Furthermore, the difference in injury documented at various growth stages could have also played a role and could be more useful if trials were completed at the same growth stage.
Growth stage, and maximum and average wind speeds during application and the calculated distance to 5% observed soybean injury, 5% reduction in height at 28 d after application (DAA), 5% reduction in height at harvest, 5% pod malformation, and 5% reduction in yield for drift trials.a,b
a Trials with fewer than 5 data points were excluded from the analysis.
b Distances were calculated using the reverse prediction function in JMP Pro v. 13 (SAS Institute).
c Wind speeds were recorded at 1-s intervals during application.
d Value recorded from the equation resulted in extrapolation with the asymptote being well beyond 100; therefore, the distance was estimated based on a 100% yield potential rather than use of the asymptote
e Not a significant regression; therefore, a distance of 0 m was used.
f Data not recorded.
When temperatures are high (32 C and above), evaporation of spray droplets may occur before they reach their intended site (Maybank et al. Reference Maybank, Yoshida and Grover1974). The more solution that evaporates from a spray particle, the lighter it will become and the further it may therefore travel before deposition. In the case of dicamba, evaporation of its carrier could in turn lead to volatility. Volatility after application could have occurred because of the impact of temperature and humidity. However, Maybank et al. (Reference Maybank, Yoshida and Grover1974) did not record temperature and humidity following application to use for analysis. In the present study, considerable upwind injury or injury in multiple directions was noticed in some applications, possibly attributable to volatile movement of dicamba.
In addition to the effect of temperature on spray particle movement, environmental conditions at the time application and soon after could affect the extent of symptomology and ability of soybean plants to recover from dicamba exposure. Previous research documented that dry soil conditions increased the sensitivity of soybean to dicamba (Andersen et al. Reference Andersen, Clay, Wrage and Matthees2004; Auch and Arnold Reference Auch and Arnold1978; Kelley et al. Reference Kelley, Wax, Hager and Riechers2005; Weidenhamer et al. Reference Weidenhamer, Triplett and Sobotka1989). Furthermore, higher temperatures near the time of exposure resulted in increased sensitivity of soybean to dicamba (Al-Khatib and Peterson Reference Al-Khatib and Peterson1999).
Soybean Parameters versus Distance Moved
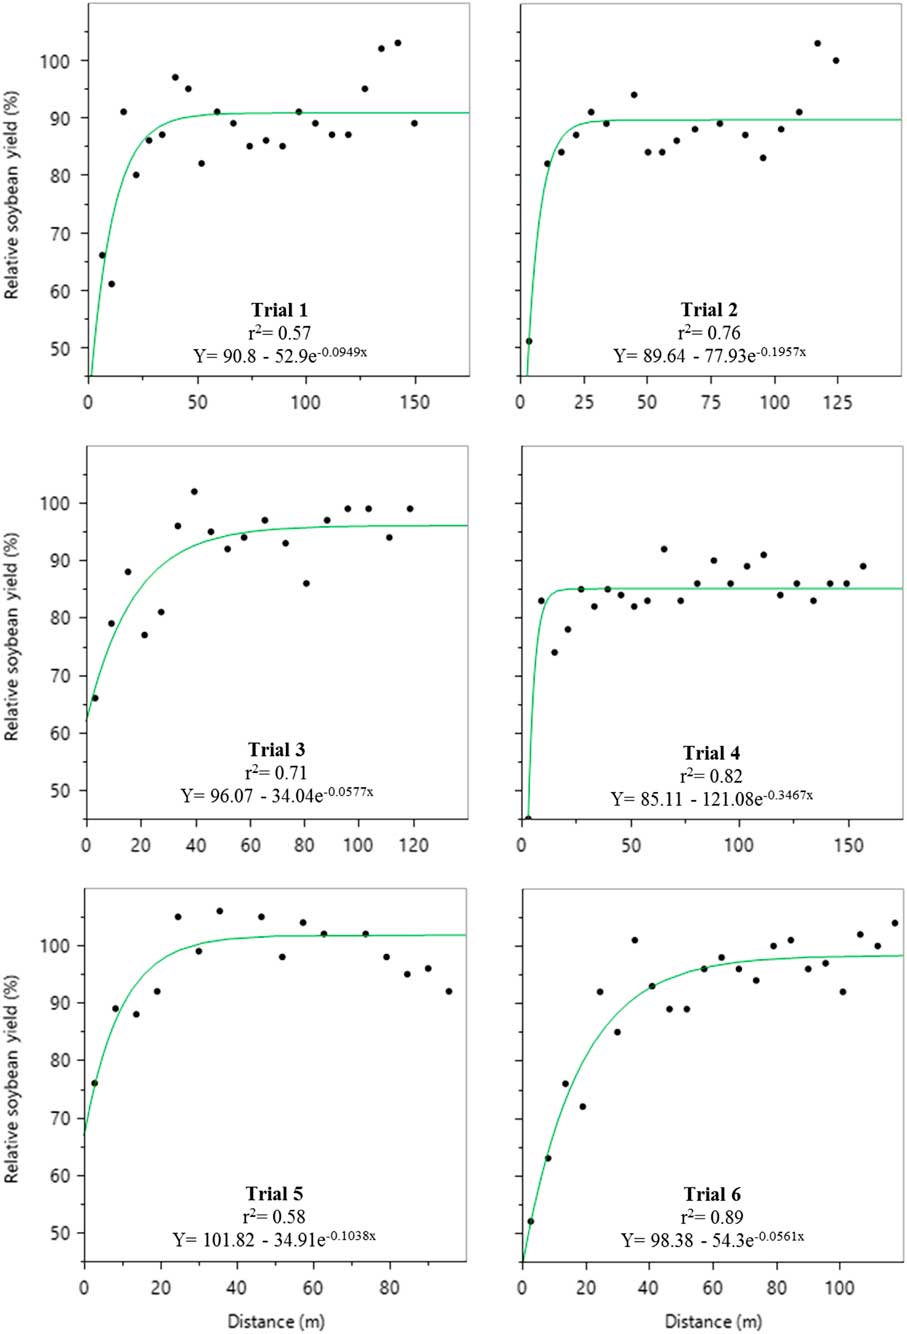
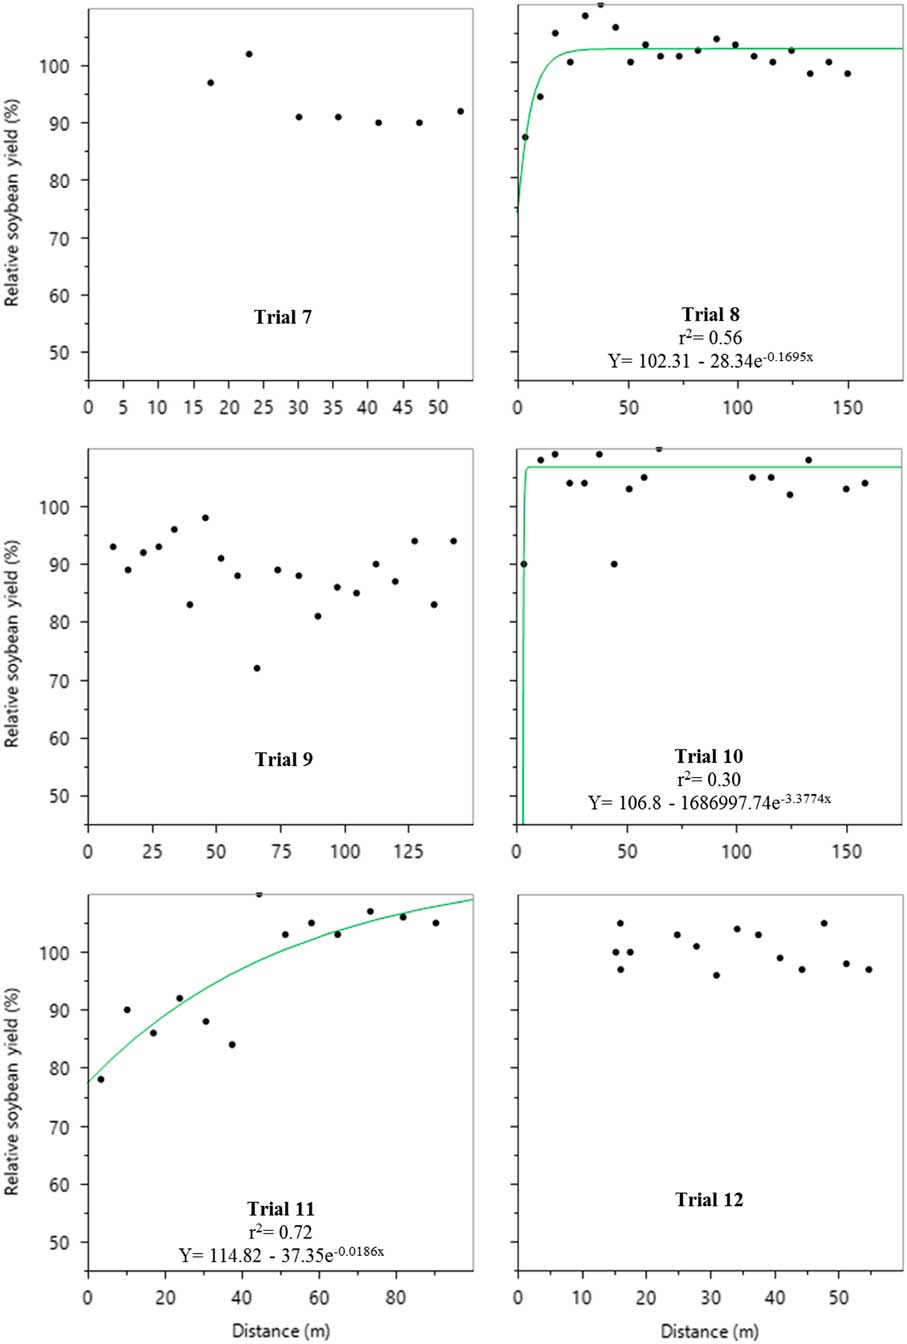
The best fit for the exponential models evaluated relating distance to various soybean variables was generally for applications at the R1 and R2 growth stages. For this reason, figures are only shown for the experiments initiated at the R1 and R2 growth stages, and even then the models were not always significant for every variable and experiment. A three-parameter exponential model often best related soybean variables with distance from the applied area. Drift trials occurring at R6 were not included in this analysis, because injury symptoms were only observed near the application, which resulted in these trials only spanning 20 m from the treated area.
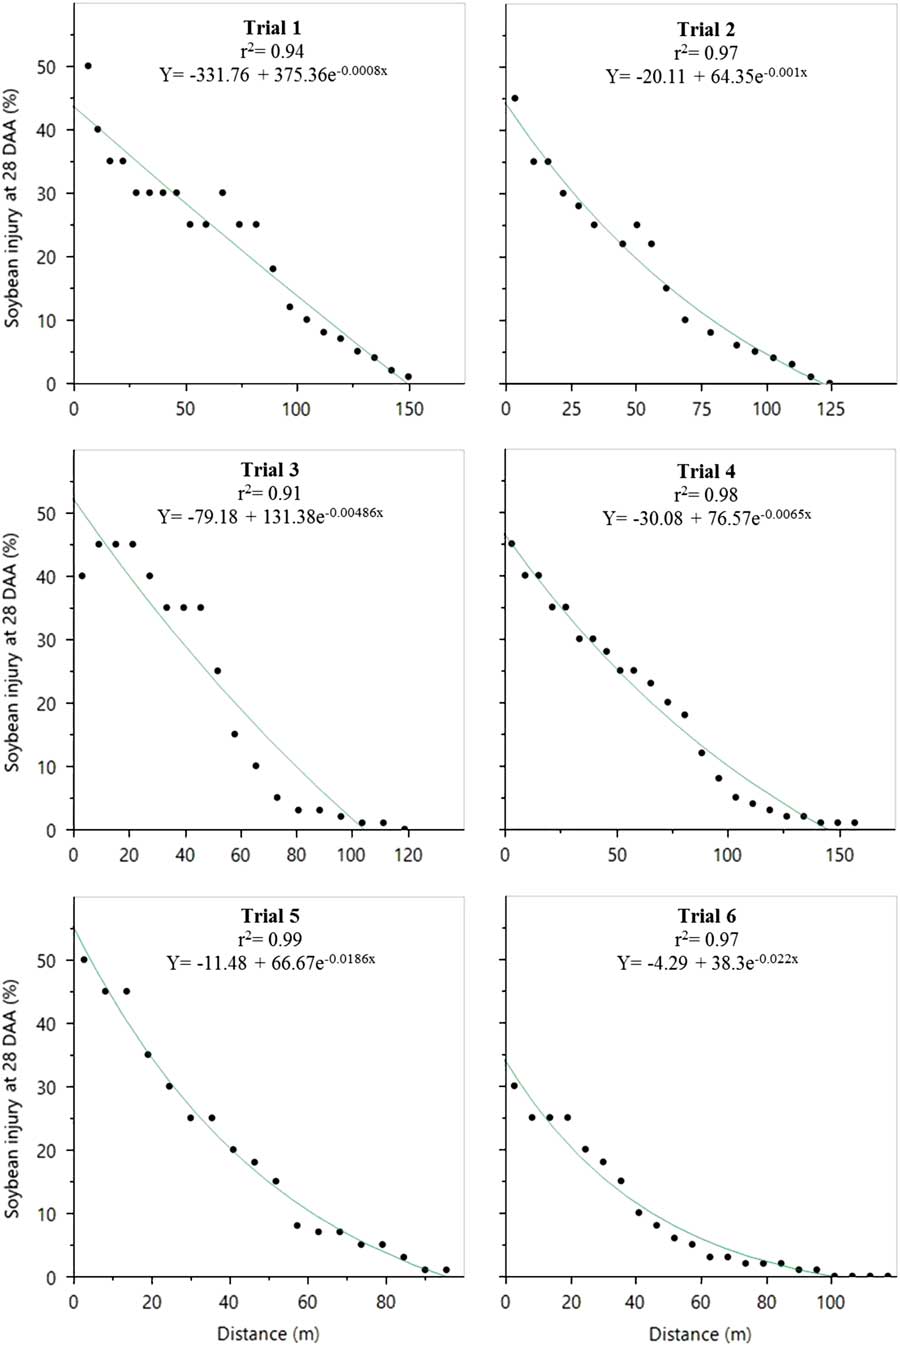
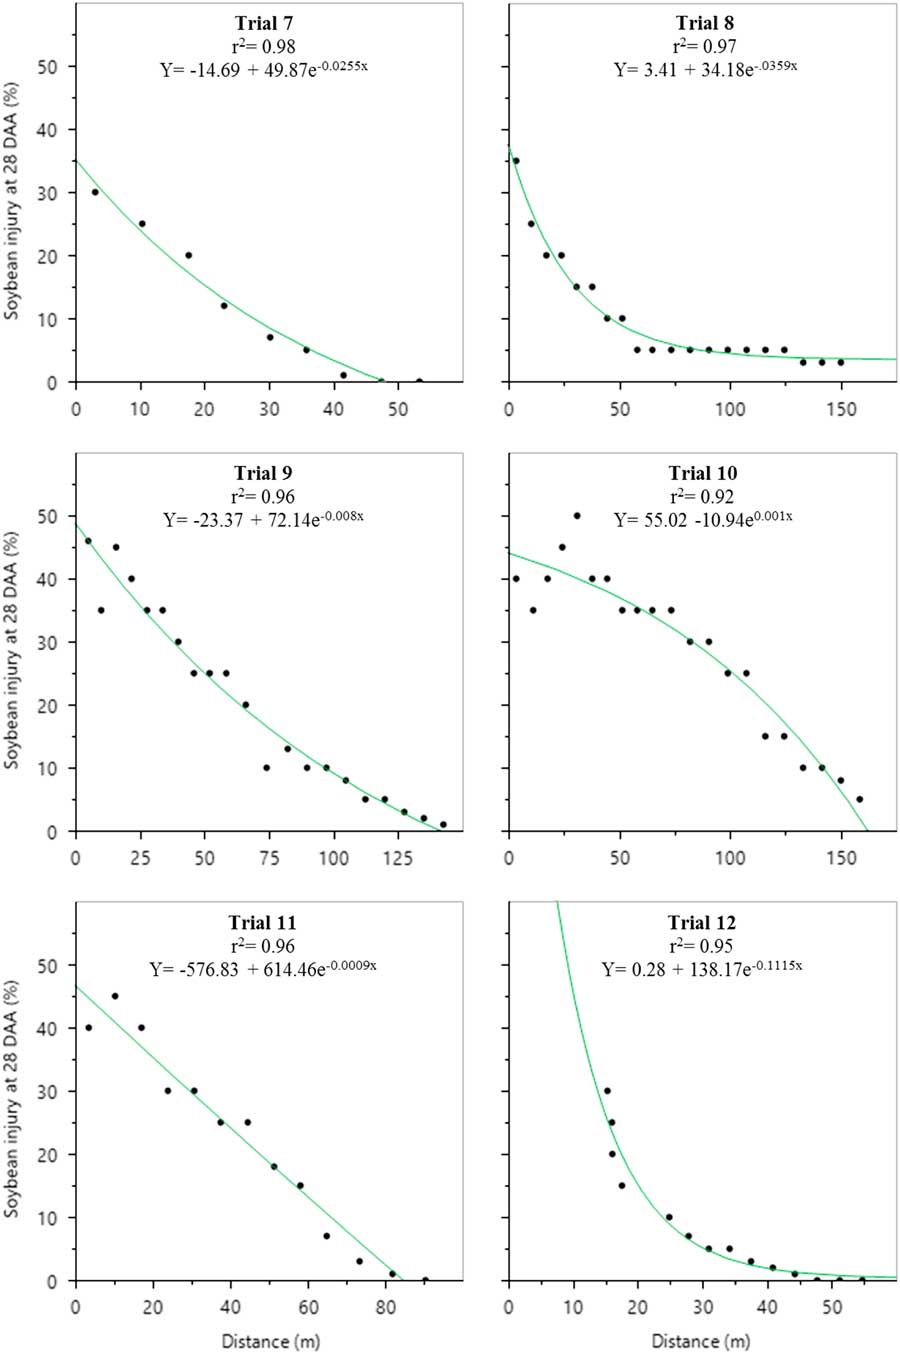
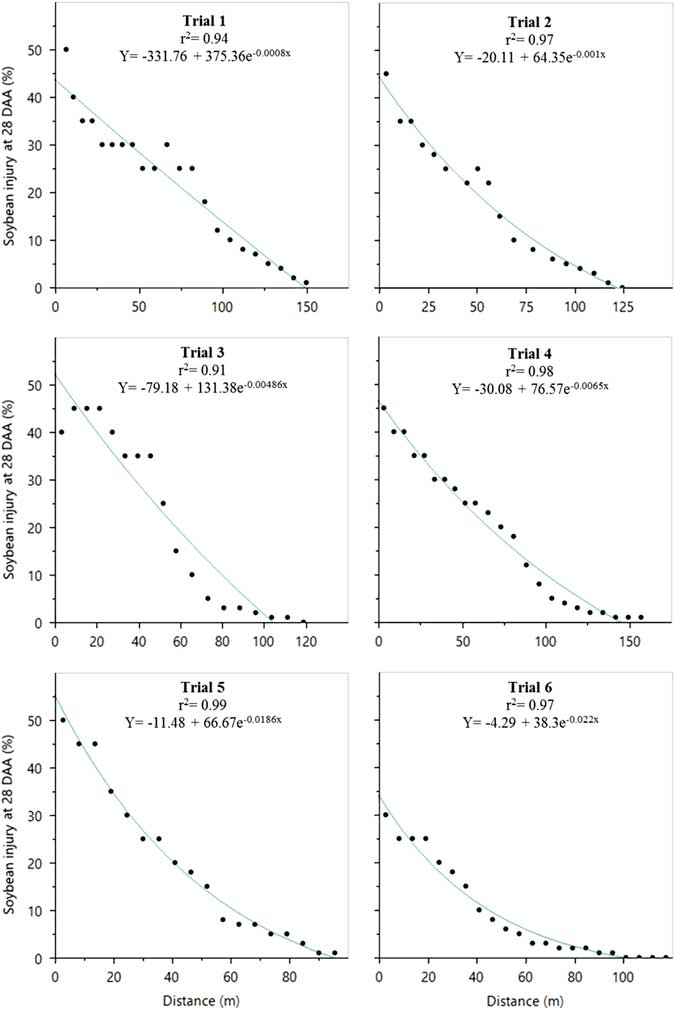
Figures 10 and 11 show the relationship between downwind distance and visible soybean injury at 28 DAA for the R1 and R2 applications. Soybean injury at 28 DAA was adequately described using the model, with R2 being greater than 0.91 for all trials, regardless of growth stage (data not shown for R3–R6). Yet, because of differences in soybean sensitivity to dicamba among growth stages, trials must be compared within each growth stage. As expected, the distance that dicamba injury to soybean could be visibly detected decreased after flowering stages (R1–R2) (Table 2). For R1 applications, a maximum distance of 128.2 m was documented (maximum wind 19 km h−1, average wind 16.9 km h−1) (Figure 10), with distance increasing to 152 m at R2 when wind speeds were less (maximum wind 15.4 km h−1, average wind 11.1 km h−1) (Figure 11).
The relationship between downwind distance and soybean injury at 28 d after application (DAA) for R1 drift events (α = 0.05). Soybean injury was rated on a scale from 0% to 100%, with 0% being no injury and 100% being plant death.
The relationship between downwind distance and soybean injury at 28 d after application (DAA) for R2 drift events (α = 0.05). Soybean injury was rated on a scale from 0% to 100%, with 0% being no injury and 100% being plant death.
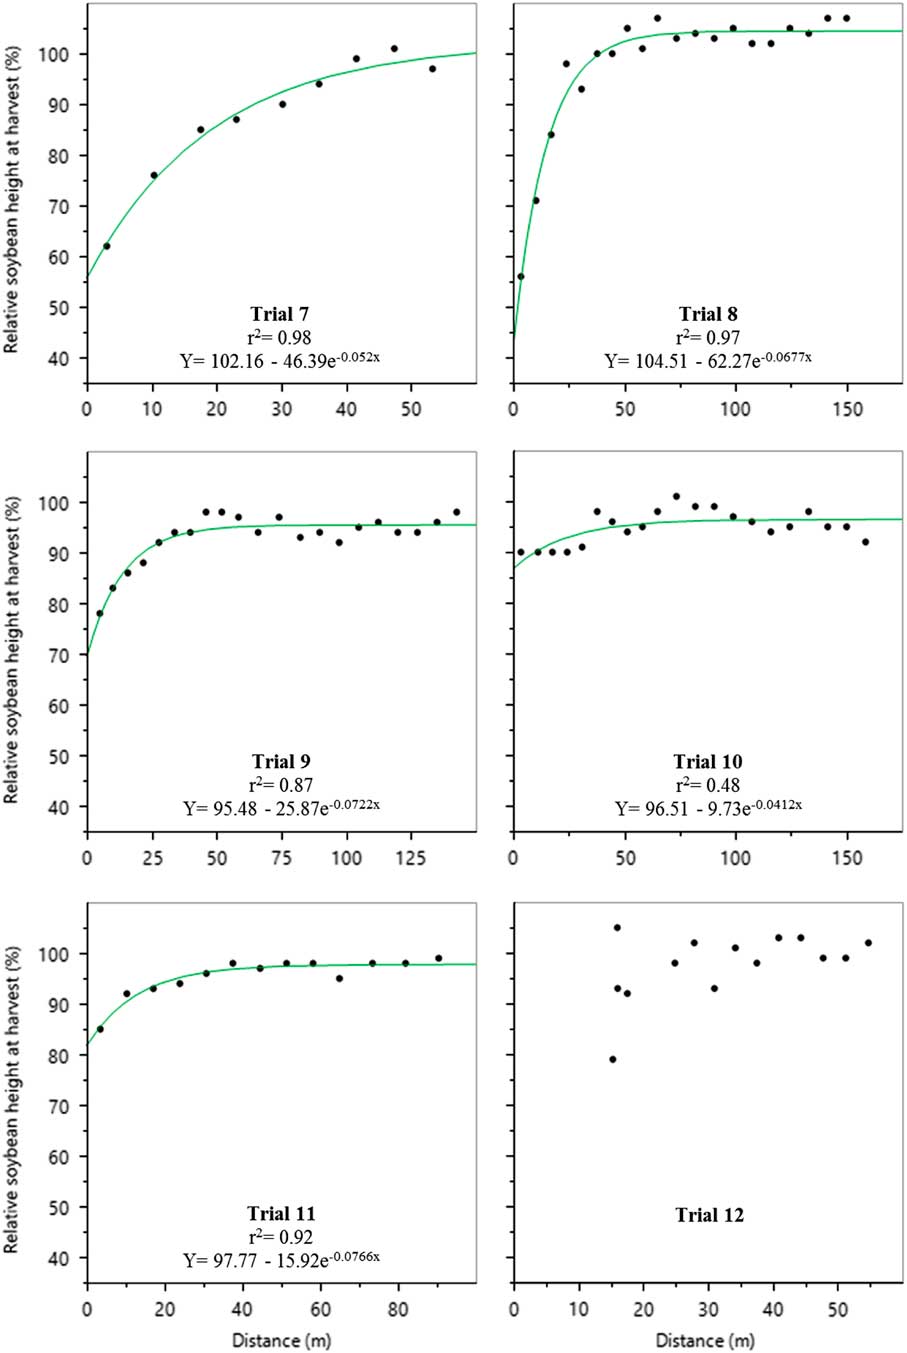
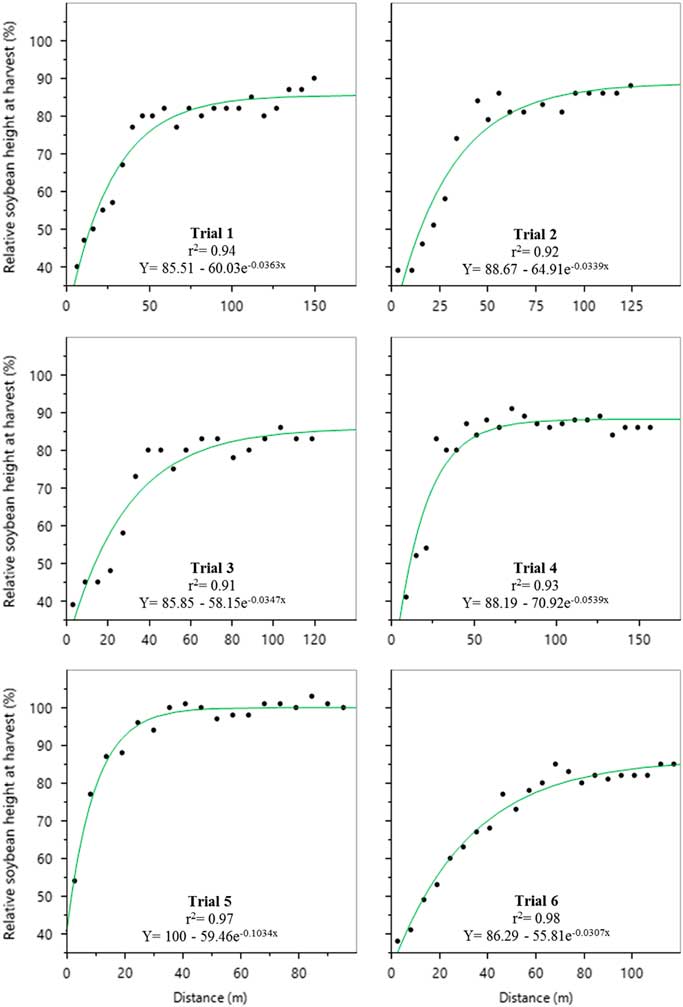
Height reduction at 28 DAA and at harvest followed similar trends as injury, in that less height reduction was seen as application was delayed (Table 2). The relationship between distance moved and height reduction at harvest for the R1 and R2 experiments are shown in Figures 12 and 13, respectively. Previous research documents that mature height reduction is more common at early reproductive stages than at later reproductive stages (Auch and Arnold Reference Auch and Arnold1978). The distance to 5% harvest height reduction was greater than canopy height reduction at 28 DAA after R1 drift events but was less than or equal to R1 drift at later drift applications. The fact that average height reduction decreased from 28 DAA to maturity after R1 drift events indicates that soybean nodes added later than 28 d after the R1 growth stage may be affected by dicamba. However, production of new nodes following the drift event was not determined in this study.
The relationship between downwind distance and soybean height at maturity for R1 drift events (α = 0.05). Soybean height was converted to a percent of the uninjured. The uninjured was the average height at maturity of three random plots with no injury at 28 d after application (DAA).
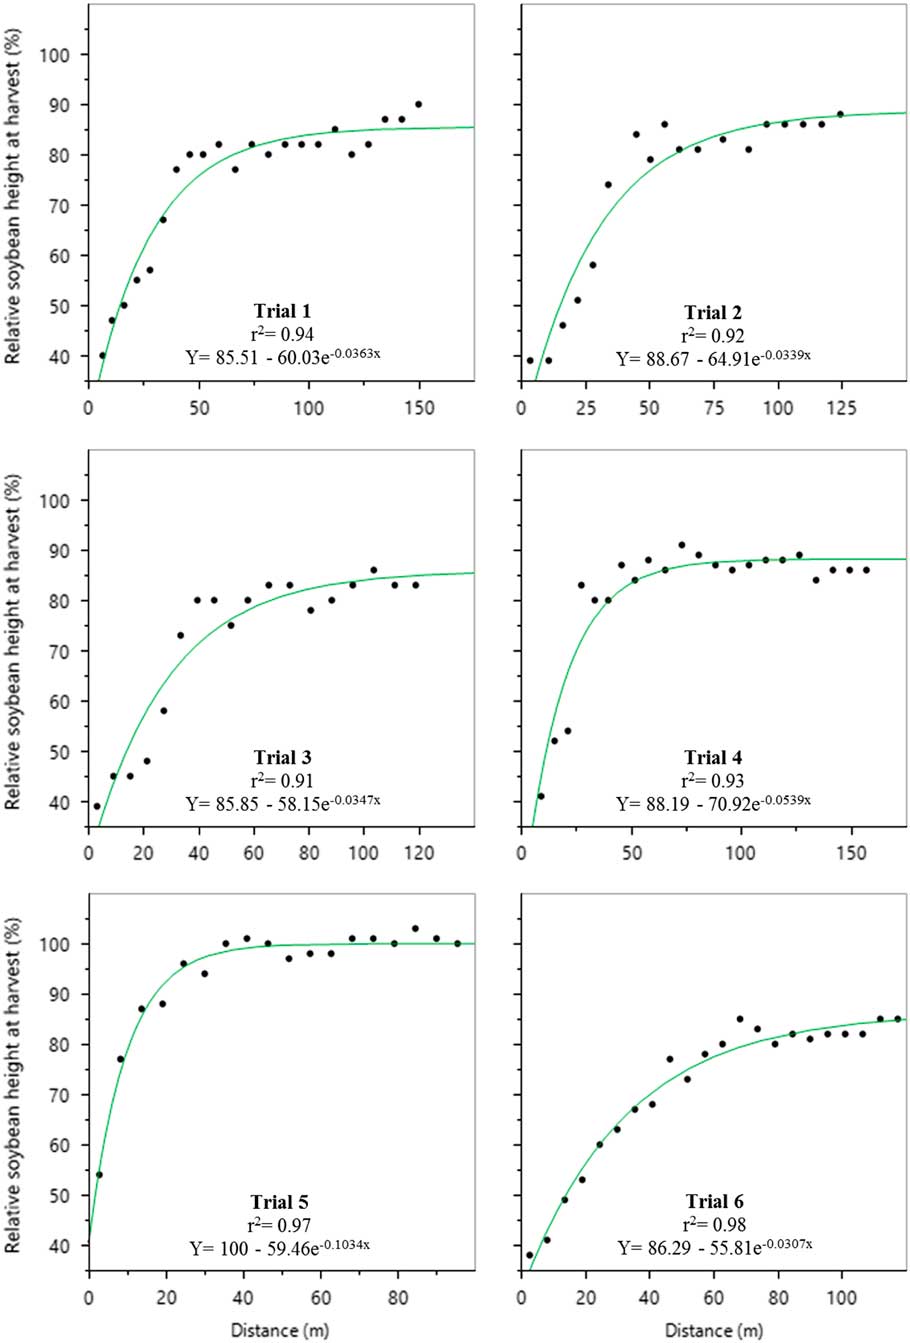
The relationship between downwind distance and soybean height at maturity for R2 drift events (α= 0.05). Soybean height was converted to a percent of the uninjured. The uninjured was the average height at maturity of three random plots with no injury at 28 d after application. Trial 12 was not significant.
This research documents that height reduction of non-DR soybean can occur at greater distances than those listed on the XtendiMax® and Engenia® labels when AIXR 11003 nozzles are used with an output of 93.5 L ha−1. In some cases, 5% height reduction occurred at more than 80 m (Table 2), which is beyond the buffer distance when using an approved nozzle (Anonymous Reference Anonymous2017a, 2017e). Furthermore, it is allowable per the label to apply 1,120 g ai ha−1 (twice the rate used in this study) to DR crops before emergence, albeit the buffer distance would increase to 67.1 m. It is likely that off-target movement would increase with increased application rate.
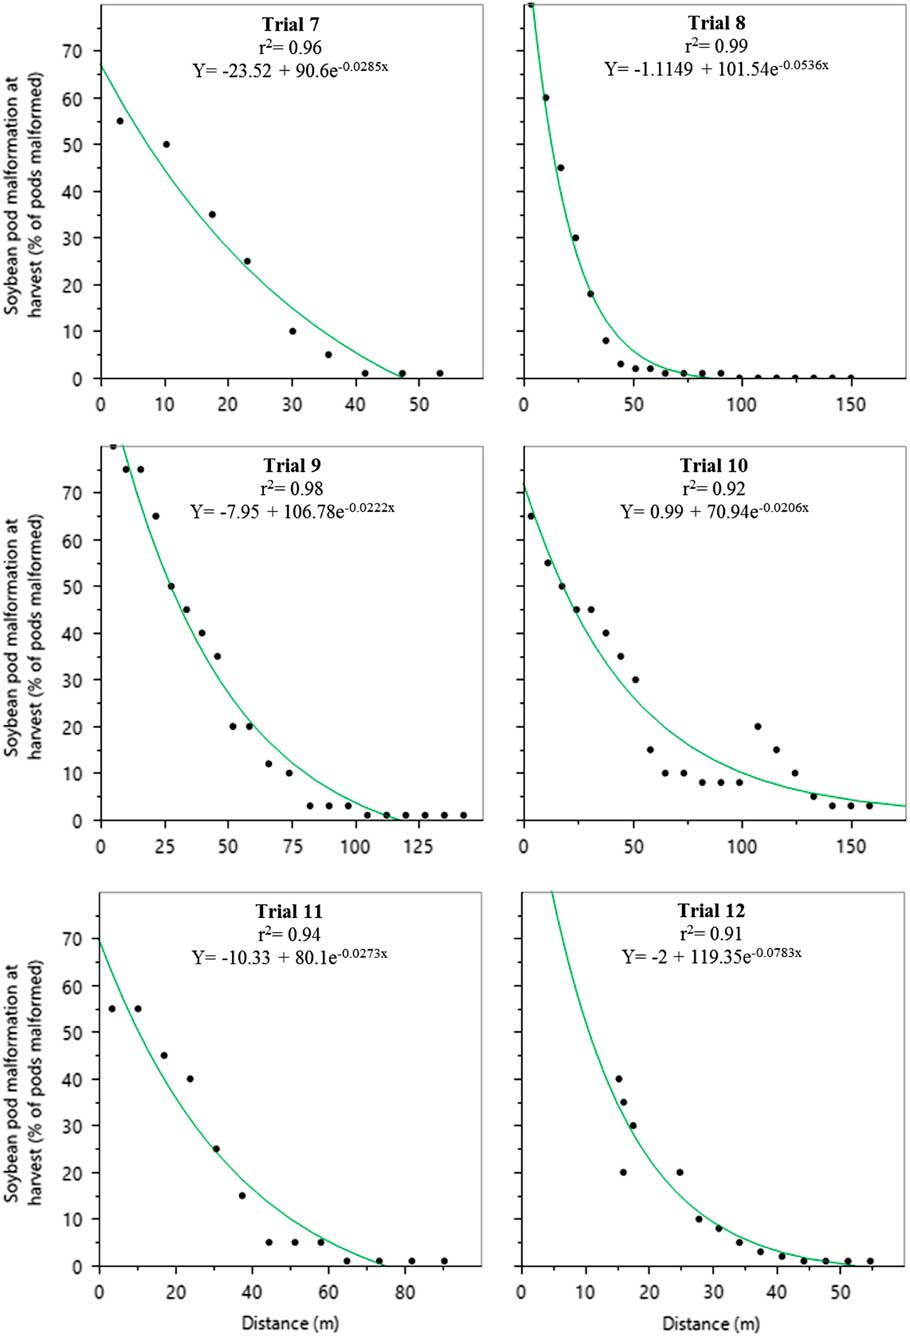
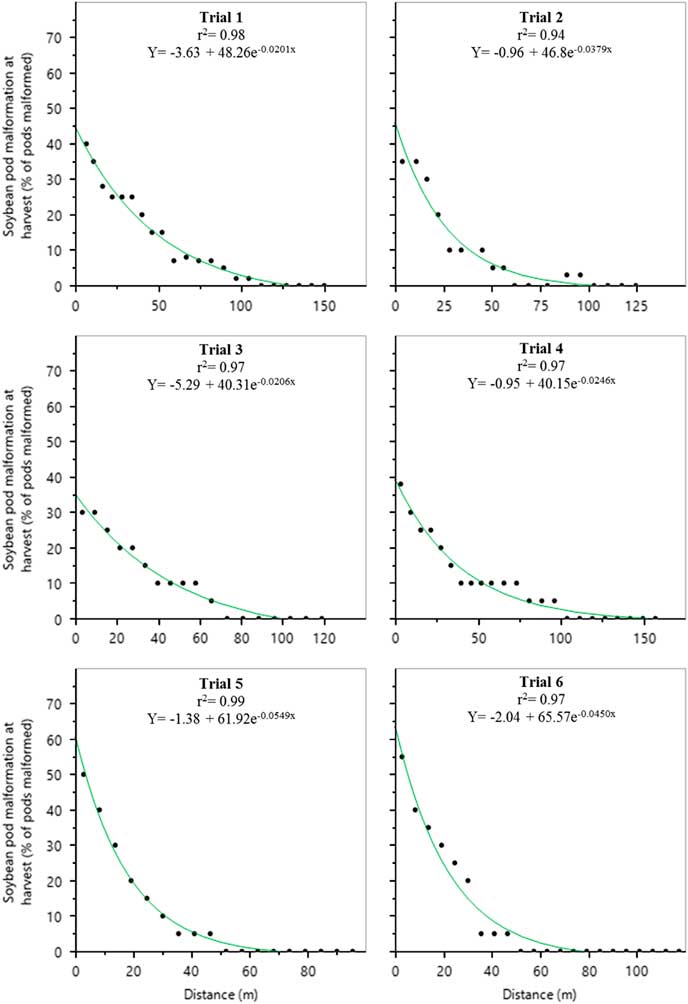
The average distance to 5% pod malformation at harvest was numerically greater after R2 drift events than R1 drift events, indicating soybean could be more sensitive to pod malformation from dicamba drift at this stage (Table 2). For the R1 and R2 drift events, the relationship between downwind distance and soybean pod malformation at harvest are shown in Figures 14 and 15, respectively. Pod malformation may be an indicator that dicamba has been translocated to pods and/or seeds. Previous research documented pod malformation to occur after exposure to dicamba and for subsequent offspring to be malformed in some cases (Barber et al. Reference Barber, Norsworthy, Bond, Steckel and Reynolds2015; McCown et al. Reference McCown, Barber, Norsworthy, Palhano, Hale, Lancaster and Doherty2016a; Miller and Norsworthy Reference Miller and Norsworthy2018; Thompson and Egli Reference Thompson and Egli1973). Furthermore, auxin symptomology occurrence in newly planted soybean could be blamed on drift exposure, which may cause dicamba complaints to be filed where they are unwarranted.
The relationship between downwind distance and soybean pod malformation at maturity for R1 drift events (α = 0.05). Soybean pod malformation was rated as a percent of the total pods malformed.
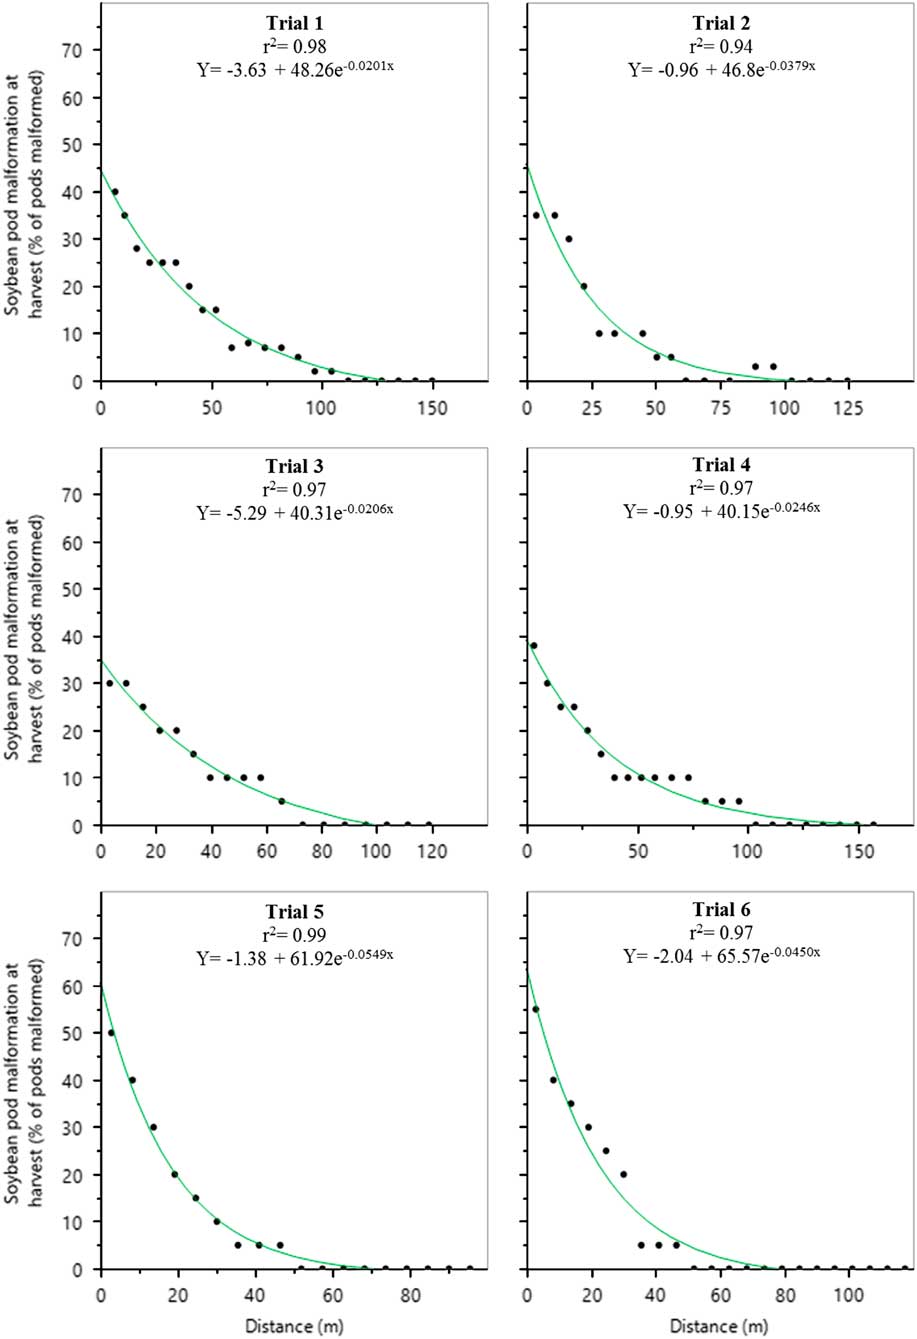
The relationship between downwind distance and soybean pod malformation at maturity for R2 drift events (α = 0.05). Soybean pod malformation was rated as a percent of the total pods malformed.
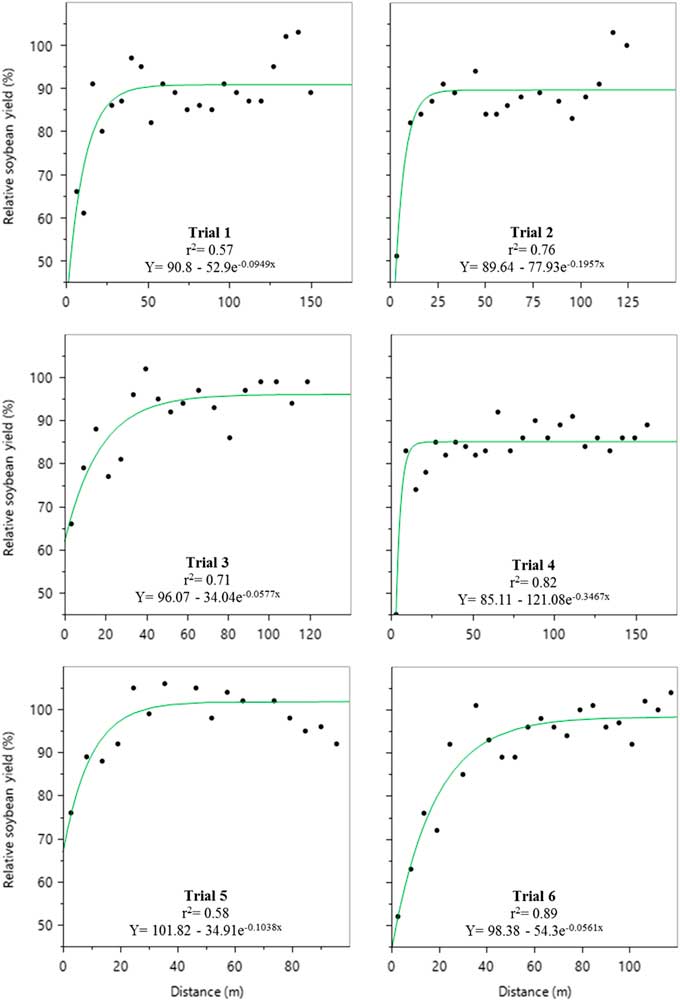
Two trials after R1 drift events (33.9 m, 42.8 m), one trial after R2 drift events (34.1 m), and one trial after a R3 drift event (33.5 m) were documented to cause 5% yield loss to soybean beyond the buffer distance established for endangered species at the field edge (Table 2; Figures 16 and 17). Using the sprayer setup evaluated in this research, dicamba application in DR cotton and soybean may lead to yield loss beyond a 33.3 m buffer in the downwind direction, and the risk may increase relative to the size of the treated area. In this research, no more than 480 m2 were treated, and it should be noted that only a single pass of a sprayer was used. There would be opportunity to increase primary drift exposure to downwind species if multiple passes were used.
The relationship between downwind distance and soybean yield for R1 drift events (α = 0.05). Soybean yield was converted to a percent of the uninjured. The uninjured was the average yield of three random plots within each trial with no injury at 28 d after application.
The relationship between downwind distance and soybean yield for R2 drift events (α= 0.05). Soybean yield was converted to a percent of the uninjured. The uninjured was the average yield of three random plots within each trial with no injury at 28 d after application. Trials 7, 9, and 12 were not significant.
Based on label guidelines, application would be permissible where non-DR soybean is bordering DR cotton or soybean, but the wind direction would have to be directly away from sensitive crops such as non-DR soybean at the time of application (Anonymous Reference Anonymous2017a, 2017e). Even so, volatility of DGA dicamba, including the new formulations, can occur at least 3 DAA (Jacobson et al. Reference Jacobson, Urbanczyk-Wochniak, Mueth, Riter, Sall, Honegger, South and Carver2016a, Reference Jacobson, Urbanczyk-Wochniak, Mueth, Riter, Sall, Honegger, South and Carver2016b; Mueller et al. Reference Mueller, Wright and Remund2013). Because of volatilization and other forms of possible secondary movement, it is not possible to conclude that all of the injury or damage observed in these trials was solely the result of primary drift. As noted earlier, injury was sometimes observed in directions other than downwind at application, although this was not included in assessments. In the future, efforts should quantify soybean response to the separate contributions of primary and secondary drift of dicamba, and there should be an increased effort to improve methods to minimize both forms of off-target movement.
Acknowledgements
This research was funded by the Arkansas Soybean Promotion Board. No conflicts of interest have been declared.


 Open access