


Introduction
Species conservation initiatives have typically been designed around population biology characteristics, such as population size and trends (Keith et al., Reference Keith, Akçakaya, Butchart, Collen, Dulvy and Holmes2015; Wauchope et al., Reference Wauchope, Amano, Sutherland and Johnston2019). However, there is growing recognition that conservation efforts should extend beyond sheer numbers and consider the preservation of ecological processes. This requires the identification of meaningful, finer-scale conservation units and allows species to be managed using measures tailored to their needs (Weckworth et al., Reference Weckworth, Hebblewhite, Mariani and Musiani2018; Brakes et al., Reference Brakes, Carroll, Dall, Keith, McGregor and Mesnick2021). Social structure is emerging as a valuable tool for delineating conservation units, particularly for social species such as cetaceans (Blumstein, Reference Blumstein, Székely, Moore and Komdeur2010; Bouveroux et al., Reference Bouveroux, Kirkman, Conry, Vargas-Fonseca and Pistorius2019; Bonizzoni et al., Reference Bonizzoni, Santostasi, Eddy, Riley, Ferreira da Silveira, Würsig and Bearzi2023).
Cetaceans display a spectrum of social structures, ranging from highly stable and well-structured groups, such as those observed in natal philopatry societies (Martien et al., Reference Martien, Taylor, Chivers, Mahaffy, Gorgone and Baird2019), to fission–fusion societies (Connor et al., Reference Connor, Wells, Mann, Read, Mann, Connor, Tyack and Whitehead2000). Fission–fusion (splitting–merging) is characterized by the flexibility of social groupings in terms of size and composition, as well as the formation of social bonds between individuals over time (Aureli et al., Reference Aureli, Schaffner, Boesch, Bearder, Call and Chapman2008). Cetacean social structure is determined by the patterns of social relationships, which, in turn, are influenced by the association patterns between individuals over time (Hinde, Reference Hinde1976). These relationships can manifest in various forms including competition, cooperation, dominance in acquiring mates or resources, cooperative care and nursing, which is largely observed in mother–calf relationships (Connor et al., Reference Connor, Mann, Tyack and Whitehead1998; Konrad et al., Reference Konrad, Frasier, Whitehead and Gero2019). This intricate interplay of relationships and grouping behaviours highlights the inherent plasticity in cetacean social structures, resulting from trade-offs influenced by ecological factors such as resource availability, resource distribution and predation (Connor et al., Reference Connor, Wells, Mann, Read, Mann, Connor, Tyack and Whitehead2000; Heithaus & Dill, Reference Heithaus and Dill2002; Gowans et al., Reference Gowans, Würsig and Karczmarski2007). A good understanding of social structure improves the effectiveness of conservation planning, specifically in preserving social network integrity and critical habitats (e.g. Wey et al., Reference Wey, Blumstein, Shen and Jordán2008; Blumstein, Reference Blumstein, Székely, Moore and Komdeur2010).
A critical gap exists in our understanding of the social structure and conservation status of Indo-Pacific humpback dolphins Sousa chinensis (henceforth referred to as humpback dolphins), particularly in Southeast Asia, despite their categorization as Vulnerable on the IUCN Red List (Jefferson et al., Reference Jefferson, Smith, Braulik and Perrin2017). Most studies of the social structure of humpback dolphins to date have been conducted in China, Hong Kong and Taiwan (Dungan et al., Reference Dungan, Hung, Wang and White2012, Reference Dungan, Wang, Araújo, Yang and White2016; Wang et al., Reference Wang, Wu, Turvey, Rosso, Tao, Ding and Zhu2015), where they are typically observed in small groups of varied age classes (Hung, Reference Hung2008; Jutapruet et al., Reference Jutapruet, Huang, Li, Lin, Kittiwattanawong and Pradit2015; Zulkifli Poh et al., Reference Zulkifli Poh, Peter, Ngeian, Tuen and Minton2016; Kuit et al., Reference Kuit, Ponnampalam, Ng, Chong and Then2019). The species lives in fission–fusion societies, characterized by generally weak and fluid association patterns between individuals (Gowans et al., Reference Gowans, Würsig and Karczmarski2007), thus warranting tailored protection measures.
The Langkawi Archipelago and adjacent Perlis–Kedah coastal waters in north-west Peninsular Malaysia were recognized as an Important Marine Mammal Area (IMMA) in 2019 (IUCN-MMPATF, 2022). Approximately 669 individual humpback dolphins have been photo-identified in the IMMA, representing one of the most extensive photographic catalogues within the species’ geographical range. The area is also identified as crucial feeding and nursery habitat for the species (Ponnampalam & Fairul Izmal, Reference Ponnampalam and Fairul Izmal2011; Ponnampalam et al., Reference Ponnampalam, Kimura and Fairul Izmal2014; Kimura et al., Reference Kimura, Sagara, Yoda and Ponnampalam2022; Teoh et al., Reference Teoh, Then, Ng, Kuit, Jamal Hisne and Ponnampalam2023), even though it is heavily utilized by humans. Earlier studies have revealed population connectivity between dolphin groups in Langkawi and the Perlis–Kedah coastal waters (Bono et al., Reference Bono, Kimura, Teoh, Ng, Ichikawa and Ponnampalam2022; Teoh et al., Reference Teoh, Then, Ng, Kuit, Jamal Hisne and Ponnampalam2023), prompting suggestions that the population should be considered as a single conservation unit for purposes of protection. Some individuals, termed ‘regulars’ by Teoh et al. (Reference Teoh, Then, Ng, Kuit, Jamal Hisne and Ponnampalam2023), exhibited relatively high levels of site fidelity, further raising questions of their role and function in the social network. This study therefore aimed to (1) examine the grouping patterns of humpback dolphins in relation to environmental and behavioural parameters, and (2) evaluate the association patterns and social structure among the dolphins within the IMMA for the purposes of guiding conservation management.
Study area
The study area covers c. 2708 km2 of the coastal waters of Langkawi, extending 25 km eastwards to the Perlis–Kedah coastline and spanning a 36 km stretch from Kuala Perlis southward to Kuala Kedah. Langkawi and the Perlis–Kedah coastal waters fall under the jurisdiction of two separate state administrators (Perlis and Kedah). Langkawi is a UNESCO Global Geopark (UNESCO, 2021) comprising 104 tropical islands with diverse habitats, and is a prominent tourism destination in Malaysia (Omar et al., Reference Omar, Othman and Mohamed2014). In contrast, extensive intertidal mudflats and estuaries dominate the Perlis–Kedah coastal waters. Both areas contribute significantly to the country’s fisheries production (Department of Fisheries Malaysia, 2020). The study area experiences a seasonal south-west monsoon (May–October) and north-east monsoon (November–April). We delineated two distinct survey blocks linked to different research objectives during separate survey periods from 2010–2014 and 2016–2020, respectively (Fig. 1).
Langkawi archipelago and the Perlis–Kedah coastal waters, Malaysia, showing the areas surveyed for Indo-Pacific humpback dolphins Sousa chinensis during 2010–2014 and 2016–2020. The inset map shows the Satun-Langkawi Archipelago Important Marine Mammal Area (IMMA) and the location of the study area within Peninsular Malaysia.

Methods
Data collection
During October 2010–February 2020, we conducted 258 days of boat-based surveys, with a total survey effort of 15,616 km and 1,086 h. Each survey period typically comprised 7–8 days in Langkawi and the Perlis-Kedah coastal waters, respectively. No surveys took place in 2015 because of funding and staffing constraints. Data collection methods during boat-based surveys followed protocols described by Teoh et al. (Reference Teoh, Then, Ng, Kuit, Jamal Hisne and Ponnampalam2023). We photographed both sides of the dorsal fins of every dolphin within a sighted group and recorded the date, time, group size, composition and predominant group behaviours during the sighting. At least two observers estimated group size from the total number of individuals within a sighting. We determined group composition based on adults, juveniles, mother–calf pairs and mixed age categories. We assigned individuals to age groups based on estimated body size and pigmentation (Jefferson, Reference Jefferson2000). We only determined sex for mothers based on their repeated and close association with calves. We classified group behaviours into six states: feeding, foraging, milling, resting, socializing and travelling (for detailed descriptions, see Teoh et al., Reference Teoh, Then, Ng, Kuit, Jamal Hisne and Ponnampalam2023). We defined the predominant group behaviour as the overall behavioural state exhibited by ≥ 50% of the group members (Elliser et al., Reference Elliser, MacIver and Green2018).
Photo-identification
We identified individuals from dorsal fin features following the protocol outlined by Teoh et al. (Reference Teoh, Then, Ng, Kuit, Jamal Hisne and Ponnampalam2023). We scored photographs for distinctiveness (D) and photograph quality (Q), and applied thresholds of D ≥ 2 and Q ≥ 3 for inclusion in the social structure analysis. We evaluated the distinctiveness based on the prominence of markings and scarring (e.g. nicks and notches, or intense pigmentation), while quality reflected the clarity of the photograph. Both parameters were scored on a scale of 1–4, with higher values indicating greater distinctiveness or better image quality. Thus, D ≥ 2 represented individuals with at least moderate distinctiveness, while Q ≥ 3 represented images of good to excellent quality. We excluded calves lacking identifiable markings and pigmentation.
Group size analysis
We classified group sizes into four categories: small (1–10), medium (11–30), large (31–80), and superpod (> 80) (Bono et al., Reference Bono, Kimura, Teoh, Ng, Ichikawa and Ponnampalam2022). We ran the Kruskal–Wallis test to compare group sizes between survey months and between years. Because of overdispersion (Gardner et al., Reference Gardner, Mulvey and Shaw1995), we utilized a negative binomial regression generalized linear model to model group size as a function of environmental (neap and spring tides; south-west and north-east monsoons), and behavioural (feeding/foraging and travelling) factors, the number of mother–calf pairs, and their interactions. We combined feeding and foraging into a single behaviour category to avoid multicollinearity. We excluded socializing, resting and milling from the behavioural analysis because of small sample sizes. We used a stepwise reduction approach to retain those variables displaying statistical significance (Elliser et al., Reference Elliser, MacIver and Green2018). We used a significance level of P < 0.05 throughout the analysis. We based model selection on the Akaike information criterion (AIC), favouring the model with the lowest AIC value. We performed all group size-based statistical analyses in R 4.2.3 (R Core Team, 2023).
Association patterns analysis
We investigated the association patterns of humpback dolphins in SOCPROG 2.9 (Whitehead, Reference Whitehead2009). Individuals were deemed to be associated if they shared group membership within a given sampling period (Whitehead, Reference Whitehead2008) referred to as a ‘day’ in this study (Hawkins et al., Reference Hawkins, Pogson-Manning, Jaehnichen and Meager2020). Group membership was determined by spatio-temporal proximity within a 100 m radius while engaging in similar behaviour (Titcomb et al., Reference Titcomb, O’Corry-Crowe, Hartel and Mazzoil2015).
We applied association analysis only to groups where ≥ 50% of the members were successfully identified, to reduce potential bias from oversight of critical associations involving unidentified individuals (Parra et al., Reference Parra, Corkeron and Arnold2011). To reduce bias arising from infrequently sighted individuals, we further restricted the dataset to individuals that were identified ≥ 5 times during the study period (Whitehead, Reference Whitehead2008). If an individual was sighted multiple times on the same day, we only included the initial sighting (Titcomb et al., Reference Titcomb, O’Corry-Crowe, Hartel and Mazzoil2015). We omitted superpod sightings from the analysis because of the small sample size and inherent instability in group membership.
We used the half-weight index (HWI) to assess the strength of association between pairs based on the proportion of time the two individuals spent together. Values ranged from 0 (two individuals never seen together) to 1 (a pair of individuals always seen together); associations are considered weak if the index is < 0.20 (Hawkins et al., Reference Hawkins, Pogson-Manning, Jaehnichen and Meager2020), and strong when it exceeds twice the population’s mean HWI (Bonizzoni et al., Reference Bonizzoni, Santostasi, Eddy, Riley, Ferreira da Silveira, Würsig and Bearzi2023).
We used the correlation coefficient (r) between true and estimated association indices to measure the accuracy of social representations. An r value close to 1 shows an excellent data representation, while an r value around 0.4 suggests a moderate representation (Whitehead, Reference Whitehead2008). Social differentiation (S), the coefficient of variation of the true association indices, was also estimated. A lower S value (< 0.3) indicates a homogeneous society, whereas a higher value (> 0.5) suggests a well-differentiated society. Both r and S were computed using the maximum likelihood method, and standard errors (SE) calculated using 1,000 bootstrap replications.
The HWI association matrix was permuted 20,000 times, with 1,000 trials per permutation, within a sampling period of 98 days, to test against the null hypothesis that all individuals randomly associate with one another (Whitehead, Reference Whitehead2009). We defined the sampling period of 98 days by the mean residency time using the lagged identification rate for dolphins in the study area (Teoh et al., Reference Teoh, Then, Ng, Kuit, Jamal Hisne and Ponnampalam2023), as recommended by Bertulli et al. (Reference Bertulli, Rasmussen and Rosso2021) and Whitehead (Reference Whitehead2024). We selected the ‘Permute groups within samples’ option to test the short-term (within sampling period) and long-term (between sampling periods) preferred associations. The test yielded mean, standard deviation (SD) and coefficient of variation (CV), for both observed and randomly permuted association indices. Lower mean values of observed compared to randomly permuted indices indicated short-term preferred associations. Conversely, higher values of SD and CV suggested long-term preferred associations (Whitehead, Reference Whitehead2009).
We assessed social clustering based on the HWI association matrix using Newman’s eigenvector method (Newman, Reference Newman2006). The method relies on modularity assessment to identify social divisions within the population. Modularity (Q) quantifies the difference between the observed proportion of total association within clusters and the expected proportion under random distribution of pairwise association indices (Newman, Reference Newman2004). Social clusters were delineated by maximizing modularity type 1, which controls for gregariousness in weighted networks using the dominant eigenvector of the modularity matrix (Newman, Reference Newman2006). A modularity value > 0.3 signifies the presence of meaningful clusters within the population (Newman, Reference Newman2004).
Social network and network metrics analysis
We visualized social network data using NetDraw in UCINET 6.773 (Borgatti et al., Reference Borgatti, Everett and Freeman2002). We calculated network metrics in SOCPROG, including strength, eigenvector centrality, reach, clustering coefficient and affinity (Table 1), for each individual and for the entire population to identify the roles or influence certain individuals may have within the network. Betweenness level was estimated in NetDraw. We tested the significance of the observed social network metrics for the whole population by comparing the observed mean values and mean values derived from 20,000 permutations for each network metric. We systematically removed the top 10% (n = 9) of individuals for each network metric to investigate the stability of the social network and the influence of highly influential individuals. Additionally, we compared these network metrics between two groups based on the degree of site fidelity: regulars that showed high resighting frequency (≥ 15 resightings in at least 5 out of the 10 survey years or at least 4 consecutive years), and non-regulars that did not meet these criteria (Teoh et al., Reference Teoh, Then, Ng, Kuit, Jamal Hisne and Ponnampalam2023).
Description of social network metrics based on Whitehead (Reference Whitehead2008, Reference Whitehead2009) and Sueur et al. (Reference Sueur, Jacobs, Amblard, Petit and King2011).

Temporal pattern of association rates
We investigated the temporal pattern of associations by calculating the standardized lagged association rates, which is the probability that if two individuals, A and B, are associated at any point in time, B will be randomly selected as an associate of A after a specified time lag (Whitehead, Reference Whitehead2008). We used the complete (unrestricted) photo-ID dataset from 2010–2020 to reflect the temporal association of the entire population instead of focusing on individuals that were sighted more frequently (Bertulli et al., Reference Bertulli, Rasmussen and Rosso2021).
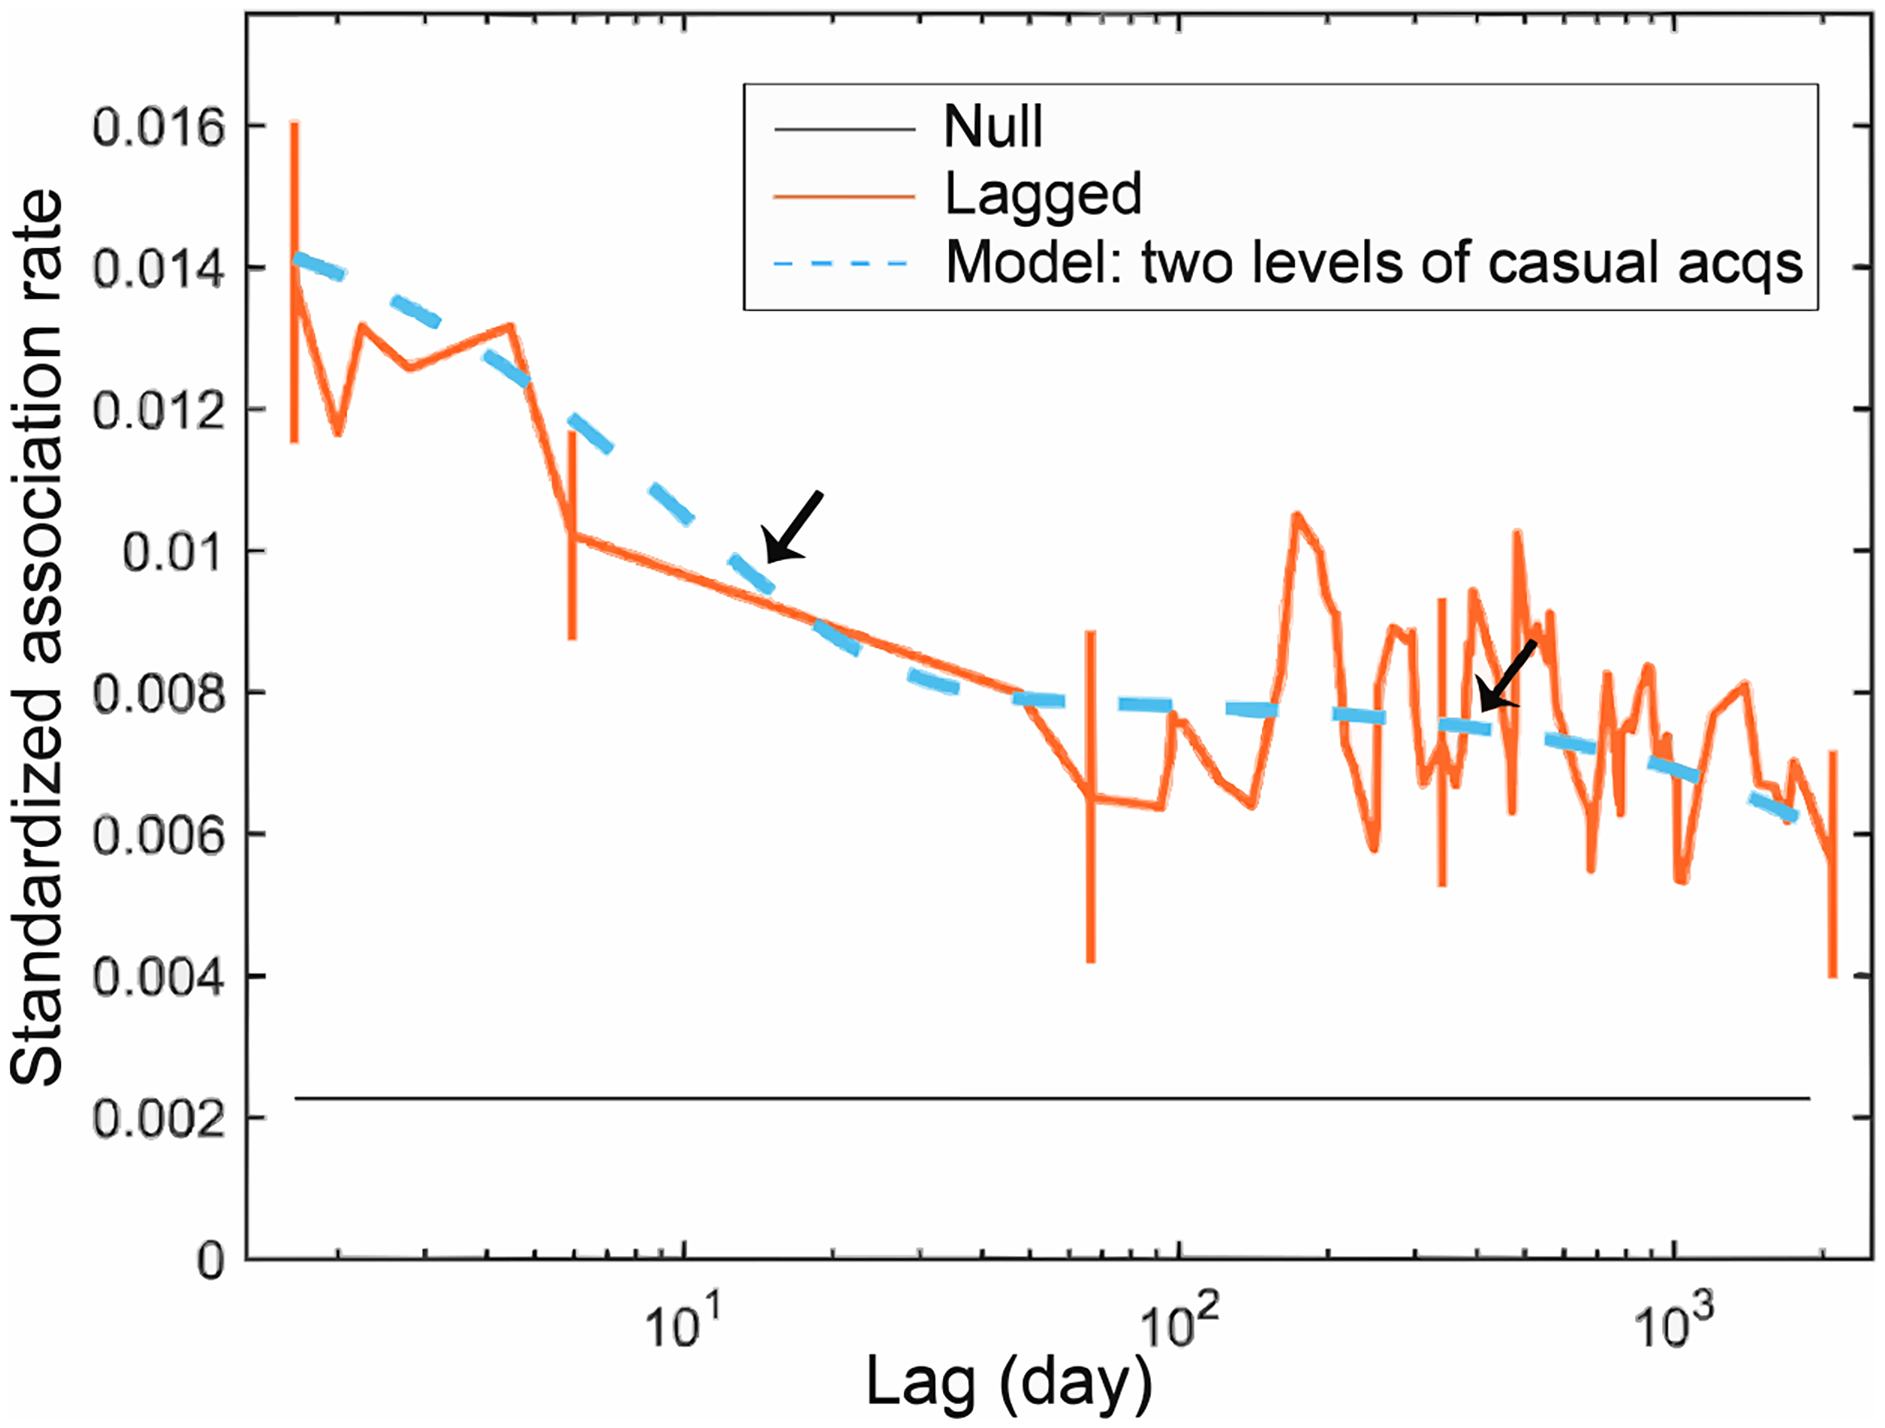
We plotted the standardized lagged association rate against a specified time lag with a 100,000 moving average and compared this to the null association rate (i.e. the expected lagged association rate under random associations) to determine whether non-random association patterns occurred throughout the study period. Four mathematical models (preferred companions, casual acquaintances, preferred companions + casual acquaintances, and two levels of casual acquaintances) were fitted to the standardized lagged association rate (Whitehead, Reference Whitehead2008). The model that best described the temporal pattern of the associations was based on the lowest quasi-Akaike information criterion (QAIC).
Results
Group size and composition
We recorded 189 humpback dolphin sightings during 2010–2020 in Langkawi and the Perlis–Kedah coastal waters, with mean group size estimates of 20.3 ± SD 32.0. The majority of the sightings (56%, n = 106) consisted of small groups, followed by medium-sized (25%, n = 47) and large groups (12%, n = 23, maximum = 80 individuals), with only few (7%, n = 13) sightings of superpods (Fig. 2). We recorded 127 groups (67%) of mixed age, encompassing adults, juveniles and/or calves; 40 groups (21%) of adults alone and 16 groups (8%) comprising mothers and calves. We were unable to determine the composition of the remaining six groups because the sightings were too brief.
Number of sightings of humpback dolphins in the study area during 2010–2020, by group size and behaviour patterns observed.

Feeding/foraging (49%, n = 92) and travelling (23%, n = 43) were the most frequently observed behavioural states (Fig. 2). Group size when travelling (mean = 52.4 ± SD 49.6) was significantly larger compared to when feeding/foraging (mean = 10.8 ± SD 11.8). Calves were present in 129 sightings (68%); groups with calves were c. 11 times larger (mean = 28.6 ± SD 35.8) than groups without calves (mean = 2.4 ± SD 2.5).
Group sizes did not differ significantly between survey months (χ 2 = 7.125, df = 11, P = 0.7889) or between years (χ 2 = 13.338, df = 9, P = 0.1479). The preferred parsimonious model (AIC = 965.8; Table 2) indicated that group sizes were best explained by tide types, behaviours, number of mother–calf pairs and the pairwise interactions of the number of mother–calf pairs with behaviours. The number of mother–calf pairs per group ranged from 1 to 35 (mean 5.3 ± SD 6.9 pairs/group). We observed a significant positive correlation between group size and the number of mother–calf pairs (Fig. 3). We also found a significant effect on group size as a result of the interaction between travelling behaviour and the number of mother–calf pairs present (Table 3), whereby large groups (> 30 individuals) with more than 10 mother-calf pairs were usually observed travelling (6%, n = 12).
Summary results of the generalized linear modelling to evaluate a range of explanatory variables for group size of Indo-Pacific humpback dolphins Sousa chinensis in Langkawi and the Perlis–Kedah coastal waters, Malaysia (Fig. 1). Group size was modelled as a function of environmental factors (neap and spring tides, south-west and north-east monsoons), behavioural factors (feeding/foraging and travelling), number of mother–calf pairs and their pairwise interactions. We used a negative binomial regression because of overdispersion and a stepwise reduction approach to retain variables displaying significant statistical significance (P < 0.05). The Akaike information criterion (AIC) indicates the goodness-of-fit, and ΔAIC is the difference of AIC to the best-performing model.

Boxplots of group sizes of humpback dolphins in the study area, categorized by (a) tide and (b) behaviour pattern. The thick black horizontal line within the boxes signifies the median value, and the box represents the interquartile range. The whiskers extend to the minimum and maximum values within 1.5 times the interquartile range, and circles represent outliers beyond this range. A scatterplot (c) illustrates the relationship between group size and number of mother–calf pairs, considering the influence of behaviour. Note that behaviours such as milling, resting and socializing were excluded from the group size analysis because of small sample sizes.

The results of the preferred parsimonious negative binomial model (M2) using generalized linear models to evaluate explanatory variables of group size of humpback dolphins in relation to environmental factors (neap and spring tides, south-west and north-east monsoons), behavioural factors (feeding/foraging and travelling), number of mother–calf pairs and their pairwise interactions in Langkawi and the Perlis–Kedah coastal waters.

*P < 0.05.
Association patterns
We included only 95 individuals that were sighted at least five times in social structure analysis, representing 14.2% of all identified dolphins, of which 16 were regulars and 45 were classified as females, with the sex of the remaining individuals undetermined. Values of r = 0.64 (SE = 0.05), and S = 0.53 (SE = 0.07) suggested a reasonable representation of the social system and a well-differentiated society with diverse social connections between pairs.
The overall mean HWI (i.e. the average association strength of an individual dolphin across all sightings) for the population was 0.22 ± SD 0.08 (range = 0.00–0.36). The maximum index (i.e. the highest observed strength of association of an individual throughout the study) had a mean value of 0.64 ± SD 0.16 (range = 0.10–0.90; Fig. 4). Out of 4,465 possible pairs, 3001 (67%) had an HWI < 0.30; i.e. more than half of the population maintained weak and infrequent associations with their associates. Conversely, 11% (n = 506) of paired associations displayed HWI values equal to or greater than twice the population mean, indicating the existence of select pairs with particularly strong and significant associations.
The frequency distribution of mean and maximum half-weight index (HWI) by individual of 95 humpback dolphins sighted five or more times. We used the HWI to determine the strength of association between dolphin pairs; the mean index represents the average association strength for each individual dolphin across all sightings; the maximum index reflects the highest observed strength of association for each individual throughout the study.

The permutation test supported non-random associations within the population. The mean association index for the observed data was significantly lower than that of the permuted random data (observed mean = 0.285, random mean = 0.302, P = 0.001), suggesting short-term preferred associations. Additionally, the presence of long-term preferred associations was supported by a significantly higher SD (observed SD = 0.226, random SD = 0.199, P < 0.001) and CV (observed CV = 0.792, random CV = 0.659, P < 0.001) of the observed data compared to permuted random data.
The Newman’s eigenvector method resulted in a maximum modularity quotient of 0.12, significantly below 0.30, indicating no conclusive evidence in support of the population being divided into discrete clusters. Instead, the humpback dolphins in our study area appeared to form an interconnected social structure, as visualized by the social network diagram (Fig. 5).
A social network diagram depicting strong associations (HWI > 0.44, twice the overall mean) between humpback dolphins in the study area during 2010–2020. Individual dolphins are represented by nodes classified as female or sex unknown, and regular or non-regular, and identified by their photo-identification codes. Associations are represented by lines between nodes, with the thickness of the lines proportional to the strength of the association. The node size indicates the level of betweenness, with larger nodes representing higher betweenness in the network. The three individuals labelled are those that either fragmented from the network core or lost connections when the top 10% of individuals (based on network metrics) and the regulars were removed.

Social network and network metrics
The sociogram revealed a centralized and highly interconnected social network of varying degrees of association strength among all 95 individuals identified five or more times, with no conspicuous discrete social clusters (Fig. 5). Seventy-five individuals accounted for c. 83% of the connections, forming the core of the network, with a high number of paths running through them; they maintained weaker connections with individuals located on the network’s periphery (Fig. 5). No pattern of social structuring between regulars and non-regulars, based on site fidelity, was discernible from the sociogram (Fig. 5).
On average, each individual had c. 70 ± SD 19 associates (range = 1–89), with the majority (90%) each having more than 50 associates. Permutation tests revealed that eigenvector centrality was significantly different from what would be expected by a random network, suggesting a meaningful social structure (Table 4). When the top 10% of dolphin individuals based on each network metric were removed, the network’s overall cohesion or structure remained intact, with only two individuals, LGK10-LDF-001 and KPE16-LDF-011, fragmenting from the network core. The mean betweenness for the overall population was 12.18 ± SD 14.13.
The mean ± SD of the social network metrics of humpback dolphins in Langkawi and the Perlis–Kedah coastal waters, including strength, eigenvector centrality, reach, clustering coefficient, affinity and betweenness for the overall population (n = 95), regulars (n = 16) and non-regulars (n = 79). Regulars showed high resighting frequency (≥ 15 resightings in at least 5 out of the 10 survey years or at least 4 consecutive years), whereas non-regulars did not meet these criteria.

*P < 0.05 after 20,000 permutations.
Our comparison between the regulars and the non-regulars revealed that the regulars exhibited higher social network metrics, which were significantly different from random associations (Table 4). Regular individuals displayed higher reach compared to non-regulars, indicating their extended social influence. Moreover, the level of betweenness of regulars (mean = 26.43 ± SD 25.02) was greater than that of non-regulars (mean = 9.29 ± SD 8.36). The network remained largely unaffected when regular individuals were selectively removed, except for LGK11-LDF-006, for which this resulted in losing a connection, specifically the link with LGK10-LDF-001.
Temporal pattern of association rates
The standardized lagged association rate remained consistently above the null association rate for all 441 individuals from the complete (unrestricted) photo-ID dataset collected throughout the study period (Fig. 6), supporting non-random associations within the population. The overall association rate exhibited a declining trend over time, which was best described by the two levels of casual acquaintances model, as evidenced by the lowest QAIC of 24,365.49 (Table 5). The two declining slopes of the model (Fig. 6) indicated two types of social dissociation occurring at different time scales: short- and long-term. The first type of social dissociation involved relatively brief associations among individuals that lasted c. 10 days, characterized by frequent changes in group composition as individuals form groups temporarily and then disperse. The second type of social dissociation occurred after an extended period of association, spanning months to years. The gradual decline in associations is notable after c. 300 days.
Standardized lagged association rate with null association rate against time lag (day) for all humpback dolphins during 2010–2020. The vertical bars denote standard errors. The dashed line represents the best-fitting model, which explains the temporal association rates using the two levels of casual acquaintances. This model reflects two distinct types of social dissociation, short- and long-term, within the population, indicated by two noticeable drops in the association rate, marked by the arrows.

Exponential mathematical models fitted to standardized lagged association rates (g′) describing the temporal association patterns relative to time lag (td) of all humpback dolphins identified during 2010−2020 in Langkawi and the Perlis–Kedah coastal waters. The best-performing model is that with the lowest quasi-Akaike information criterion (QAIC) value, and ΔQAIC is the difference of QAIC to that model.

Discussion
To the best of our knowledge, this work represents the first study of the social structure of humpback dolphins in Malaysia and Southeast Asia, contributing pioneering insights into the species’ social ecology in the region. Our analysis revealed dynamic social interactions, characterized by a centralized and interconnected social network with no evident social clustering. The dolphins are part of a non-random, well-differentiated society featuring social bonds and temporal patterns driven by different situations. They displayed plasticity in group sizes, with some superpods exceeding 80 individuals, even though large group sizes are uncommon among humpback dolphins in other geographical ranges. The superpods were predominantly associations of travelling mother–calf pairs, suggesting that they function as nursery groups. These observations of the social structure of humpback dolphins underscore the adaptability and flexibility typical of a fission–fusion society (Aureli et al., Reference Aureli, Schaffner, Boesch, Bearder, Call and Chapman2008) and lay the foundations for informed local conservation efforts.
Fission–fusion society and dynamic grouping patterns
The fission–fusion social system of humpback dolphins conforms with the social patterns of the genus Sousa documented across their geographical ranges (Dungan et al., Reference Dungan, Hung, Wang and White2012, Reference Dungan, Wang, Araújo, Yang and White2016; Wang et al., Reference Wang, Wu, Turvey, Rosso, Tao, Ding and Zhu2015; Bouveroux et al., Reference Bouveroux, Kirkman, Conry, Vargas-Fonseca and Pistorius2019; Hunt et al., Reference Hunt, Allen, Bejder and Parra2019). The dolphins in this study showed highly variable group sizes, ranging from single individuals to groups of up to 204 animals. The mean group size (20.3 ± SD 32.0) was greater than that observed in populations elsewhere in Malaysia, China, Hong Kong, Taiwan and Thailand (mean group size range = 3.1–18; Hung, Reference Hung2008; Jutapruet et al., Reference Jutapruet, Huang, Li, Lin, Kittiwattanawong and Pradit2015; Smith et al., Reference Smith, Mansur, Strindberg, Redfern and Moore2015; Dungan et al., Reference Dungan, Wang, Araújo, Yang and White2016; Wang et al., Reference Wang, Wu, Turvey, Rosso and Zhu2016; Zulkifli Poh et al., Reference Zulkifli Poh, Peter, Ngeian, Tuen and Minton2016; Kuit et al., Reference Kuit, Ponnampalam, Ng, Chong and Then2019).
Individual decisions to join or leave groups are influenced by trade-offs between the potential advantages and disadvantages of group living, which relate to ecological pressures such as the interplay between resource availability and predation risk (Connor et al., Reference Connor, Mann, Tyack and Whitehead1998, Reference Connor, Wells, Mann, Read, Mann, Connor, Tyack and Whitehead2000; Bouveroux et al., Reference Bouveroux, Kirkman, Conry, Vargas-Fonseca and Pistorius2019; Gowans, Reference Gowans and Würsig2019). In habitats with patchy prey distribution, dolphins tend to form smaller groups to minimize competition; conversely, dolphins may aggregate into larger groups when food is abundant or predation threats are high (Connor et al., Reference Connor, Wells, Mann, Read, Mann, Connor, Tyack and Whitehead2000; Heithaus & Dill, Reference Heithaus and Dill2002). We observed smaller feeding and foraging groups compared to larger travelling groups. This is probably a result of the patchy distribution of core feeding grounds, with prey likely to be concentrated in estuaries and mangrove forests in Langkawi and the Perlis–Kedah coastal waters (Teoh et al., Reference Teoh, Then, Ng, Kuit, Jamal Hisne and Ponnampalam2023). Seasonal variability in group size has been linked to prey movements that are influenced by environmental parameters but we found no evidence of a monsoonal effect on the group size of humpback dolphins in this study (Wang et al., Reference Wang, Wu, Turvey, Rosso and Zhu2016; Verutes et al., Reference Verutes, Tubbs, Selmes, Clark, Walker and Clements2021).
Larger groups provide better defences against predators and improve early predator detection (Gygax, Reference Gygax2002; Heithaus & Dill, Reference Heithaus and Dill2002). Humpback dolphins face predation pressure from tiger sharks Galeocerdo cuvier, great white sharks Carcharodon carcharias and bull sharks Carcharhinus leucas (Parra & Ross, Reference Parra, Ross, Perrin, Würsig and Thewissen2009; Hunt et al., Reference Hunt, Allen, Bejder and Parra2019). Large sharks are known to inhabit the waters in the region (Abd. Haris Hilmi et al., Reference Abd. Haris Hilmi, Ahmad and Lawrence2017), although there is a paucity of information on their distribution in the study area. The discovery of the remains of a partially consumed calf with clear shark teeth impressions on its body (MareCet Research Organization, unpubl. data, 2022) suggests that predation by sharks does occur. However, with < 1% of humpback dolphins in our photo-ID catalogue bearing distinctive shark-bite wounds, aggregating in larger groups appears to be an effective defence mechanism against predation in the study area.
Previous research on Sousa spp. has described loose, casual and short-lasting fission–fusion affiliations, with low group stability, apart from mother–calf bonds (Karczmarski, Reference Karczmarski1999; Jefferson, Reference Jefferson2000). In this study, we observed high social fluidity with a prevalence of weak and casual associations. However, embedded within this social framework were robust and relatively enduring associations between certain pairs. Our findings add to evidence suggesting that dolphins with extensive range movements and low site fidelity/residency tend to have fluid social associations (Karczmarski, Reference Karczmarski1999). The dolphins ranged over c. 340 km2 around Langkawi and the Perlis–Kedah coastline and into adjacent Thai waters. This increased the chances of encounters with potential associates while limiting opportunities for prolonged social interactions (Karczmarski, Reference Karczmarski1999).
Despite predominantly weak and casual associations, Teoh et al. (Reference Teoh, Then, Ng, Kuit, Jamal Hisne and Ponnampalam2023) found that some dolphins in the study area exhibited relatively high site fidelity, repeatedly returning to some areas (such as Kilim in Langkawi; Fig. 1) over a 10-year period. Over time, repeated associations build social bonds and promote stable social connections among individuals using the same area (Lusseau et al., Reference Lusseau, Schneider, Boisseau, Haase, Slooten and Dawson2003). Social stability may also be related to preferential associations within this population, driven by assortative behaviour whereby animals with shared characteristics and situations, such as reproductive status, derive fitness benefits from associating and interacting with one another (Möller & Harcourt, Reference Möller and Harcourt2008; Connor et al., Reference Connor, Cioffi, Randia, Allen, Watson-Capps and Krützen2017). This is supported by our observations of recurrent large aggregations of mother–calf pairs with group members in similar reproductive states and sharing similar requirements for sustenance and protection (Möller & Harcourt, Reference Möller and Harcourt2008).
The dolphins in the study area all belong to a single, cohesive network, conforming to the population connectivity suggested earlier (Bono et al., Reference Bono, Kimura, Teoh, Ng, Ichikawa and Ponnampalam2022; Teoh et al., Reference Teoh, Then, Ng, Kuit, Jamal Hisne and Ponnampalam2023). Our findings suggest that the network demonstrates remarkable resilience, as the collective interactions of all individuals, whether regulars or not, contribute to the overall integrity of the network. Removing the top 10% most influential individuals, including regulars who have extensive connections within the network, did not greatly impact the overall network structure.
Large nursery groups and possible functions
Humpback dolphins in Langkawi and the Perlis–Kedah coastal waters area associate in large groups or superpods. Previous studies have recorded 6–84 individuals in a single sighting (Wu et al., Reference Wu, Wang, Ding, Miao and Zhu2014; Jutapruet et al., Reference Jutapruet, Huang, Li, Lin, Kittiwattanawong and Pradit2015; Kuit et al., Reference Kuit, Ponnampalam, Ng, Chong and Then2019; Liu et al., Reference Liu, Lin, Dong, Xue, Zhang, Tang and Li2020); however, this study documented superpods of 81–204 individuals across 13 sightings, in line with a report of 205 individuals in the Bay of Bengal, Bangladesh (Smith et al., Reference Smith, Mansur, Strindberg, Redfern and Moore2015).
The superpods usually consisted of mother–calf pairs, indicative of a nursery group. Groups of mother–calf pairs were larger than other groups, which is consistent with previous research (Dungan et al., Reference Dungan, Hung, Wang and White2012). Mother–calf pairings are thought to exert strong influences on fission–fusion dynamics (Gibson & Mann, Reference Gibson and Mann2008) but the precise function of nursery superpods remains unclear. In Algoa Bay, South Africa, an increase in group sizes of Indian Ocean humpback dolphins Sousa plumbea was attributed to their reproductive season (Karczmarski, Reference Karczmarski1999). However, the year-round presence of newborn and young calves in our study suggests that superpods are formed for a different reason.
These nursery superpods were temporary aggregations commonly observed travelling, with some feeding, foraging and socializing (see also Smith et al., Reference Smith, Mansur, Strindberg, Redfern and Moore2015). Typically, the superpod would break up into smaller sub-groups, which moved away independently within a few hours. They represented a form of ‘situationship’, a consequence of situation-specific interactions rather than enduring social connections. We hypothesize that the formation of large nursery groups may be attributed to alloparental or allomaternal care, which has been documented in small cetacean species including bottlenose dolphins Tursiops sp. (Gibson & Mann, Reference Gibson and Mann2008). It is defined as caregiving behaviour provided by individuals other than the biological mother that enhances the survival rates and well-being of infants (Mann, Reference Mann and Würsig2019). This cooperative caregiving approach takes various forms, including communal defence of calves (Konrad et al., Reference Konrad, Frasier, Whitehead and Gero2019) or calf babysitting (Whitehead, Reference Whitehead1996). We observed an example of this behaviour when a small group of eight non-mother adults and subadults from a superpod of 128 dolphins approached and encircled our research vessel, allowing the majority of the group (primarily mother–calf pairs) to maintain a substantial distance and continue travelling ahead. This behaviour could be a protective response towards perceived threats. We also occasionally observed calves swimming with different adults or subadults that were not their mothers, indicating the possibility of alloparental care.
Implications for conservation
Our findings challenge the conventional perception that humpback dolphins have restricted ranges and small social groupings. Our insights are significant, particularly in light of the proposed taxonomic revision within the Sousa genus in Asia, with a focus on regions including our study area (Jefferson & Rosenbaum, Reference Jefferson and Rosenbaum2014). Our research therefore serves as a baseline for further exploration of distinctive population characteristics that could help discern potential Sousa species/subspecies within this geographical region.
Our results help to define an appropriate conservation unit to manage this population and to shape strategies to address specific challenges posed by human activities. Although Langkawi and the Perlis–Kedah coastal waters are governed by different administrators, our findings highlight that the humpback dolphins inhabiting the study area constitute a single, socially linked unit. Their reliance on both sites emphasizes the need to coordinate conservation efforts to ensure the dolphins receive uniform protection across their habitat. Conservation efforts for the species should prioritize mitigating threats that could jeopardize social bonds and connectivity. It is important to maintain the integrity of the network as it facilitates essential interactions for diversifying the gene pool, a critical factor for the species’ long-term viability (DiLeo et al., Reference DiLeo, Rico, Boehmer and Wagner2017).
Humpback dolphins in our study area face multiple anthropogenic threats such as high levels of sea vessel traffic, fishing activities and coastal development, all of which may disrupt their behaviour and social structure (e.g. Bono, Reference Bono2022). Proposed conservation measures include implementation of boating good practice, establishing speed limit zones, habitat preservation in critical areas and movement corridors that could facilitate social interactions and bonding (see Teoh et al., Reference Teoh, Then, Ng, Kuit, Jamal Hisne and Ponnampalam2023 for detailed recommendations). Continued monitoring efforts are essential, particularly of key individuals such as breeding females and regulars with high site fidelity. It is crucial that we identify any changes in social structure in a timely manner to ensure that conservation management strategies within this IMMA are adaptive and targeted.
Author contributions
Study design: ZYT, AY-HT, LSP; data collection: ZYT, LSP, JEN, SHK, SB, FIJH; data analysis: ZYT, AY-HT, SB; writing: ZYT, AY-HT, LSP; revision: all authors.
Acknowledgements
We thank the Ocean Park Conservation Foundation, Hong Kong (MM-05.1011), the University of Malaya Research Grant (Grant No. UMRG18-12SUS), the Mohamed bin Zayed Species Conservation Fund (Project No. 0925689), Indo-Pacific Cetacean Research and Conservation Fund (Grant no. IPCF 12/2), Conservation Leadership Programme Future Conservationist Award (Project No. 03286416), Nagao Natural Environment Foundation and National Geographic Society Early Career Grant (EC-KOR-57162R-19) for funding; Telaga Harbour Terminal and Perlis Nature Xplorer for the support provided; Dipani Sutaria for her helpful advice; and our colleagues, volunteers and skippers for support in the field. The Steven K Beckendorf Scholarship is acknowledged for supporting ZYT’s doctoral study, of which this study is a part.
Conflicts of interest
None.
Ethical standards
This research abided by the Oryx guidelines on ethical standards.
Data availability
The data that support the findings of this study are available from the corresponding author upon reasonable request.




 Open access

