


1. Introduction
In particle-laden turbulent flows, the dispersed and continuous phases can have a significant effect on each other's dynamics. This situation, usually termed two-way coupling, is common and has been the focus of much of the recent research in the field (Poelma & Ooms Reference Poelma and Ooms2006; Balachandar & Eaton Reference Balachandar and Eaton2010; Kuerten Reference Kuerten2016). Indeed, the portion of the parameter space where the dynamics can be considered one-way coupled is limited: the particle size  $d_p$ will be smaller than the Kolmogorov scale
  $\eta$, and the solid volume fraction
  $\phi _V$ and mass fraction
  $\phi _m$ will be below threshold levels for highly dilute suspensions (Brandt & Coletti Reference Brandt and Coletti2022). The drift due to gravitational acceleration or other body forces will also be relatively small, such that the particle Reynolds number
  $Re_p$ (based on the particle size and its slip velocity relative to the fluid) does not result in sizeable wakes. The above conditions are rarely met when the particle-to-fluid density ratio
  $\rho _p/\rho _f$ is of solid–gas mixtures, especially in terrestrial gravity. Usually, two-way coupling has been defined by and investigated for the back-reaction of the particles onto the fluid flow (Hwang & Eaton Reference Hwang and Eaton2006; Tanaka & Eaton Reference Tanaka and Eaton2010; Zhao, Andersson & Gillissen Reference Zhao, Andersson and Gillissen2013; Richter & Sullivan Reference Richter and Sullivan2014; Saito, Watanabe & Gotoh Reference Saito, Watanabe and Gotoh2019; Hassaini & Coletti Reference Hassaini and Coletti2022). However, the mutual transfer of momentum and energy between the phases implies that the particle behaviour may also be modified, as compared to a hypothetical one-way coupled system of analogous properties. Such modified behaviour of the particles is the focus of the present study.
Perhaps the two most remarkable behaviours of particles in turbulence, and certainly the ones that have attracted the most attention from researchers, are inertial clustering and modified settling. When the response time of small inertial particles  $\tau _{p}$ is comparable to the Kolmogorov time scale
  $\tau _{\eta }$ (i.e. when the Stokes number
  $St_{\eta } = \tau _{p}/\tau _{\eta }$ is of order unity), their instantaneous spatial distribution becomes highly non-homogeneous (Wang & Maxey Reference Wang and Maxey1993; Eaton & Fessler Reference Eaton and Fessler1994; Monchaux, Bourgoin & Cartellier Reference Monchaux, Bourgoin and Cartellier2012). The resulting clusters exhibit a range of spatial and temporal scales (Yoshimoto & Goto Reference Yoshimoto and Goto2007; Gustavsson & Mehlig Reference Gustavsson and Mehlig2016; Baker et al. Reference Baker, Frankel, Mani and Coletti2017; Liu et al. Reference Liu, Shen, Zamansky and Coletti2020). The mechanistic origin of clusters, ascribed originally to the centrifuging action of turbulent vortices (Squires & Eaton Reference Squires and Eaton1991b), remains debated and is likely dependent on the specific combination of parameters (Goto & Vassilicos Reference Goto and Vassilicos2008; Bragg & Collins Reference Bragg and Collins2014; Brandt & Coletti Reference Brandt and Coletti2022). When two-way coupling is at play, the phenomenon can be transformed at various levels. Gualtieri et al. (Reference Gualtieri, Picano, Sardina and Casciola2013) considered homogeneous shear turbulence laden with inertial point-particles at concentrations sufficient to produce two-way coupling. They found that the clusters were more isotropic and smeared compared to their one-way coupled counterparts. Uhlmann & Chouippe (Reference Uhlmann and Chouippe2017) considered homogeneous isotropic turbulence laden with particles larger than the Kolmogorov scales. These modified the local flow field, and their mild tendency to cluster was not associated with intense vortices. Capecelatro, Desjardins & Fox (Reference Capecelatro, Desjardins and Fox2018) analysed particle-laden vertical channel flows over a wide range of concentrations. They observed how, at large enough mass loadings, clusters were not caused by shear-driven turbulence, but rather emerged from a regime in which energy dissipation is due to inter-phase drag, similar to cluster-induced turbulence (Capecelatro, Desjardins & Fox Reference Capecelatro, Desjardins and Fox2014).
Particle-laden turbulent flows are also known to display significant alterations of the gravitational settling rate, with respect to the academic case of a particle falling in quiescent fluid (whose terminal velocity equals  $\tau _{p}g$, with
  $g$ the gravitational acceleration). Already in one-way coupled regimes, multiple mechanisms may either increase or decrease the average vertical velocity (Nielsen Reference Nielsen1993; Wang & Maxey Reference Wang and Maxey1993; Aliseda et al. Reference Aliseda, Cartellier, Hainaux and Lasherash2002; Good et al. Reference Good, Ireland, Bewley, Bodenschatz, Collins and Warhaft2014; Petersen, Baker & Coletti Reference Petersen, Baker and Coletti2019). The most commonly observed mechanism is the preferential sweeping of the particles by downward gusts. The mechanism is revealed by the correlation between particle position and downward fluid velocity fluctuations, as theorized by Maxey (Reference Maxey1987), observed numerically by Wang & Maxey (Reference Wang and Maxey1993), and measured experimentally by Petersen et al. (Reference Petersen, Baker and Coletti2019). Under two-way coupled regimes, the particle fall speed is usually found to be augmented further. Bosse, Kleiser & Meiburg (Reference Bosse, Kleiser and Meiburg2006) attributed the enhanced settling to a collective action of the particles dragging the surrounding fluid downwards. Monchaux & Dejoan (Reference Monchaux and Dejoan2017) confirmed this view, and additionally reported that two-way coupling disrupted preferential concentration in high-strain regions and so preferential sweeping; thus its role in determining the settling rate was considered marginal. Tom, Carbone & Bragg (Reference Tom, Carbone and Bragg2022), on the other hand, while recognizing the collective drag effect of the particles on the fluid, argued that preferential sweeping remained the main mechanism of settling enhancement, but on coarse-grained scales. They interpreted the weaker correlation between particle position and high-strain regions in light of the crossing trajectories effect, by which a fast-falling dispersed phase decorrelates from the local fluid flow (Csanady Reference Csanady1963; Wang & Stock Reference Wang and Stock1993; Berk & Coletti Reference Berk and Coletti2021).
The majority of the above-mentioned studies used numerical simulations. The classic point-particle approach has been the most commonly adopted, in which the particles are treated as material points exchanging momentum with the fluid according to simplified expressions for the inter-phase forces. Various issues are associated with this method, including the back-projection of the forces on the computational grid and the definition of the undisturbed fluid velocity in classic drag formulations (Eaton Reference Eaton2009; Balachandar & Eaton Reference Balachandar and Eaton2010; Brandt & Coletti Reference Brandt and Coletti2022). Advanced strategies, introduced in the last decade to alleviate these issues, lead to better agreement with observations and higher fidelity simulations (Capecelatro & Desjardins Reference Capecelatro and Desjardins2013; Gualtieri et al. Reference Gualtieri, Picano, Sardina and Casciola2015; Horwitz & Mani Reference Horwitz and Mani2016; Ireland & Desjardins Reference Ireland and Desjardins2017; Balachandar, Liu & Lakhote Reference Balachandar, Liu and Lakhote2019). Moreover, the role of effects usually neglected for small particles, such as torque and lift, has proven to be significant (Andersson, Zhao & Barri Reference Andersson, Zhao and Barri2012; Costa, Brandt & Picano Reference Costa, Brandt and Picano2020). One-to-one quantitative comparisons with experiments demonstrate the need for continuous improvements (Eaton Reference Eaton2009; Wang et al. Reference Wang, Fong, Coletti, Capecelatro and Richter2019). Particle-resolved simulations, on the other hand, capture the details of the inter-phase exchanges without modelling the fluid dynamic forces (Tenneti & Subramaniam Reference Tenneti and Subramaniam2014). The tremendous increase in high-performance computing in recent years enables the application of this method to increasingly large numbers of particles and Reynolds numbers, leading to valuable insights (see, among many others, Lucci, Ferrante & Elghobashi Reference Lucci, Ferrante and Elghobashi2010; Garcia-Villalba, Kidanemariam & Uhlmann Reference Garcia-Villalba, Kidanemariam and Uhlmann2012; Cisse, Homann & Bec Reference Cisse, Homann and Bec2013; Uhlmann & Doychev Reference Uhlmann and Doychev2014; Fornari, Picano & Brandt Reference Fornari, Picano and Brandt2016; Lin et al. Reference Lin, Shao, Yu and Wang2017; Schneiders, Meinke & Schröder Reference Schneiders, Meinke and Schröder2017; Uhlmann & Chouippe Reference Uhlmann and Chouippe2017; Mehrabadi et al. Reference Mehrabadi, Horwitz, Subramaniam and Mani2018). The calculations, however, become exceedingly expensive for decreasing particle sizes and increasing  $Re_p$. Thus systems featuring sub-Kolmogorov solid particles in air, such as the one considered in the present study, remain out of reach for high-Reynolds-number flows.
Recently, we presented an experimental study of microscopic particles settling in homogeneous air turbulence, in which the loading was varied systematically in the range  $\phi _V = 10^{-6}$–
 $5\times 10^{-5}$ (Hassaini & Coletti Reference Hassaini and Coletti2022). Unlike previous studies focused on massively inertial particles, we observed the turbulent kinetic energy to increase greatly with particle loading, being more than doubled at the highest concentrations. We attributed this behaviour to the potential energy released by the particles into the fluid, also increasing the turbulent dissipation rate. The energy was distributed more homogeneously across the scales compared to unladen turbulence, which was associated with the enhancement of the inter-scale energy transfer. As the attention was directed entirely on the carrier phase, we did not analyse the behaviour of the dispersed phase. Here, we focus on the spatial distribution and motion of the particles in these experiments, revealing the dramatic impact of two-way coupling on the intensity of clustering and on the settling rate. The paper is organized as follows. Section 2 describes the experimental methodology. Section 3 presents the results in terms of particle spatial distribution (§ 3.1) and motion (§ 3.2). And § 4 summarizes the findings and draws conclusions.
2. Experimental methodology
The experiments are carried out in a zero-mean-flow facility described extensively and characterized in Carter et al. (Reference Carter, Petersen, Amili and Coletti2016) and Carter & Coletti (Reference Carter and Coletti2017, Reference Carter and Coletti2018). Briefly, this consists of a 5 m $^3$ chamber where randomly actuated jets generate a region of homogeneous air turbulence, whose intensity is adjusted by varying the firing time of the jets. It was utilized to investigate particle-laden turbulence in Petersen et al. (Reference Petersen, Baker and Coletti2019), Berk & Coletti (Reference Berk and Coletti2021) and Hassaini & Coletti (Reference Hassaini and Coletti2022). Here, glass micro-spheres (density
  $\rho _p = 2500$ kg m
 $^{-3}$) are released at controlled rates via an adjustable hourglass, and enter the chamber after falling through a 3 m chute connected to its ceiling. As quantified in the above-mentioned studies, the apparatus possesses features that make it especially suitable to investigate the interaction of heavy particles with homogeneous turbulence. The region of quasi-homogeneous turbulence at the centre of the chamber is several times larger than the integral scale, which is
  $O(0.1\,{\rm m})$, with small mean velocity (especially in the vertical direction) and weak mean velocity gradients. The turbulence can be forced to Reynolds numbers sufficient to develop a self-similar cascade in the sense of Kolmogorov (Reference Kolmogorov1941). The considered particles reach terminal velocity well before entering the chamber and spreading in the homogeneous turbulence region, where they display homogeneous statistics over scales larger than the integral scale (Petersen et al. Reference Petersen, Baker and Coletti2019).
The experimental conditions were reported in Hassaini & Coletti (Reference Hassaini and Coletti2022) and are summarized briefly here. Two particle diameters are considered,  $d_p = 32$ and
  $52\,\mathrm {\mu }$m, falling in air turbulence at Taylor micro-scale Reynolds numbers
  $Re_{\lambda } = 152$ and
  $289$, respectively. These result in Stokes numbers
  $St_{\eta } = 0.3$ and
  $2.6$, and comparable settling velocity parameter
  $Sv_{\eta } = \tau _pg/u_{\eta } \approx 3$ in both cases. The simultaneous variation of
  $Re_{\lambda }$ and
  $St_{\eta }$ is a consequence of working under fixed gravity. As both these parameters are expected to influence the clustering and settling dynamics (Sumbekova et al. Reference Sumbekova, Cartellier, Aliseda and Bourgoin2017; Tom & Bragg Reference Tom and Bragg2019), isolating their respective effects is not trivial. As both cases show similar behaviours, the comparison indicates that the conclusions that we will draw hold over the present range of parameters. The volume fraction and mass fraction are varied to span the transition from one-way coupling to two-way coupling (Balachandar & Eaton Reference Balachandar and Eaton2010; Brandt & Coletti Reference Brandt and Coletti2022). For
  $St_{\eta }=0.3$, five cases between
  $\varPhi _v=10^{-6}$ and
  $\varPhi _v=4\times 10^{-5}$ are considered, while for
  $St_{\eta }=0.3$, six cases between
  $\varPhi _v=10^{-6}$ and
  $\varPhi _v=5\times 10^{-5}$ are considered. At these volume fractions, the interparticle distance is larger than
  $10d_p$ even considering the increase in concentration within clusters (Petersen et al. Reference Petersen, Baker and Coletti2019). Therefore, hydrodynamic interactions between particles are deemed negligible. Table 1 summarizes the flow conditions, where the unladen turbulence properties are used as baseline. In table 2, we report the normalized turbulent kinetic energy (TKE) and the large-scale anisotropy ratio over the considered range of particle loading. The turbulence modification by the particles, in particular the substantial increase of TKE, is addressed in detail in Hassaini & Coletti (Reference Hassaini and Coletti2022). The analysis conducted in that study, based on an energy budget inspired by Hwang & Eaton (Reference Hwang and Eaton2006), indicated that the increase in TKE is rooted in the gravitational settling: the particles release their potential energy into the flow, increasing its dissipation rate while not significantly altering its integral time scale. The presence of the particles causes the large-scale eddies to become elongated vertically, and redistribute the energy more homogeneously across the scales compared to the single-phase turbulence. The analysis of the inter-scale energy transfer rate suggested that such redistribution is associated with an enhanced direct cascade. We do not derive specific values of the Kolmogorov scales based on the dissipation rate estimated in the particle-laden turbulence. Those values would imply the validity of a universal sub-range in which the Kolmogorov (Reference Kolmogorov1941) theory applies, whereas the small-scale turbulence dynamics is known to be heavily modified by the particles (Tanaka & Eaton Reference Tanaka and Eaton2010; Schneiders et al. Reference Schneiders, Meinke and Schröder2017; Hassaini & Coletti Reference Hassaini and Coletti2022).
Particle properties and turbulence statistics (for the unladen flow case) for both investigated configurations. Here,  $d_p$ and
  $\tau _p$ are the particle diameter and response time (calculated using the Schiller–Naumann correlation; see Clift, Grace & Weber Reference Clift, Grace and Weber2005);
  $Re_{p}$ is the particle Reynolds number based on the still-air terminal velocity;
  $St_{\eta }$ and
  $Sv_{\eta }$ are the Stokes number and settling velocity parameter based on Kolmogorov scales;
  $u_1^{\prime }$ and
  $u_3^{\prime }$ are the r.m.s. fluid velocity fluctuations in the horizontal and vertical directions, respectively;
  $L_{1,1}$ is the integral scale of the turbulence in the horizontal direction;
  $\eta$ is the Kolmogorov length scale;
  $Re_{\lambda }$ is the Taylor micro-scale Reynolds number of the turbulence; and
  $\phi _{V,{max}}$ and
  $\phi _{m,{max}}$ are the maximum volume and mass fraction of the particles. The minimum volume and mass loadings in the experiments were
  $10^{-6}$ and
  $2\times 10^{-3}$, respectively.

The normalized turbulent kinetic energy (TKE) and the large-scale anisotropy ratio over the considered range of particle loadings.

The key non-dimensional parameters in the previous numerical and experimental studies, and in the present one, are listed in table 3. The list, which is not meant to be exhaustive, includes studies whose range of parameters is especially relevant to the present work: in those experiments, the particles were negatively buoyant and smaller than or comparable to the Kolmogorov scales, and modified the turbulence measurably, while the simulations used the point-particle approach and included the two-way coupling and gravity. Among the experiments, only Yang & Shy (Reference Yang and Shy2005) focused on parameters similar to those in our study, and also found turbulence to be augmented by the particles. They did not, however, characterize the effect of two-way coupling on clustering or settling velocity.
Non-dimensional parameters from previous numerical and experimental studies as well as those from the present study.

A vertical plane at the centre of the chamber is illuminated by an Nd:YLF laser pulsed at 4 kHz and synchronized with two CMOS cameras. These cover a larger field of view (FOV) that captures the integral scales and the large-scale organization of the particles, and a smaller FOV nested in the larger one, to resolve the Kolmogorov scales and distinguish the closely clustered particles. We will discuss results from both FOVs, whose main imaging parameters are summarized in table 4, as they yield complementary information on the highly multi-scale processes in object. The particle volume fraction is evaluated via direct counting of the particles in the illuminated volume (see Fong, Amili & Coletti (Reference Fong, Amili and Coletti2019), where the approach was validated with a known particle mass loading). A phase-separation algorithm allows us simultaneous characterization of both dispersed phase and carrier phase by particle image velocimetry (PIV) and particle tracking velocimetry (PTV), respectively. The PIV measurements were reported in detail in Hassaini & Coletti (Reference Hassaini and Coletti2022); here, we will discuss them inasmuch as they pertain to the particle transport. The PTV measurements follow the same procedure as in Petersen et al. (Reference Petersen, Baker and Coletti2019) and Berk & Coletti (Reference Berk and Coletti2021) to locate the particles and reconstruct their trajectories projected on the planar FOV, with a temporal resolution sufficient to obtain velocities and accelerations. To calculate the local slip velocity between fluid and particles, the fluid velocity from the small FOV is evaluated at the particle locations using weighted linear interpolation of the four neighbouring velocity vectors; a comparison with cubic and spline interpolation shows no significant difference (Berk & Coletti Reference Berk and Coletti2021). In fact, a linear interpolation is more suitable to evaluate the fluid velocity at the particle location: compared to nonlinear interpolation schemes, this provides a better estimate of the undisturbed fluid velocity at the particle location, which in turn defines the slip velocity relevant to the drag force formulation (Horwitz & Mani Reference Horwitz and Mani2020).
Imaging properties for both fields of view.

For each considered set of conditions, we analyse 10 independent runs of 43 000 images, i.e. about 500 integral time scales. The dominant source of uncertainty is the finite sample size. Convergence tests show that each run is well converged for all considered observables (as expected, since each image in the large FOV contains  $O(10^3)$ particles), while run-to-run variation is larger. In the following, where appropriate, the standard deviation of the various runs will be used to indicate error bars in the plots. For an in-depth discussion of the measurement uncertainties, we refer to the above-mentioned studies that used the same set-up and techniques.
3. Results
In the following,  $x_1$ indicates the horizontal direction parallel to the jet axes and to the imaging plane,
  $x_2$ is horizontal and perpendicular to
  $x_1$, and
  $x_3$ is vertical and pointing downwards; the respective velocity components are
  $U_1$,
  $U_2$ and
  $U_3$. The fluctuating velocities in the
  $i$th direction are denoted by
  $u_i = U_i - \bar {U}_i$, where the overbar indicates spatio-temporal average. Root-mean-square (r.m.s.) fluctuations are indicated with a prime. The subscript
  $p$ refers to quantities related to the particles,
  $f$ to the fluid, and
  $f\,|\,p$ to fluid properties interpolated at the particle location. Throughout the section, for clarity and brevity, we will display selected cases, more often focusing on the
  $St_{\eta } = 2.6$ case (which was studied over a somewhat wider range of loadings) and its vertical component of motion; when not specified otherwise, these will be representative of all considered conditions. Comparisons will be drawn with various previous studies, the majority of which are numerical simulations. Often, such comparisons can be only qualitative, due to differences in the input parameters, in particular
  $Re_{\lambda }$. Nevertheless, clear trends will be highlighted that are deemed to depend weakly on the precise set of parameters.
3.1. Particle spatial distribution
We first consider the radial distribution function (RDF), which describes the scale-by-scale concentration in the area surrounding a generic particle compared to a uniform distribution (Sundaram & Collins Reference Sundaram and Collins1997). For two-dimensional fields such as those obtained by planar imaging, this is defined as
 \begin{equation} g(r) = (N_r/A_r) / (N_{tot}/A_{tot}), \end{equation}
where  $r$ is the generic inter-particle separation,
  $N_r$ is the number of particles within an annulus of area
  $A_r$, and
  $N_{tot}$ is the total number of particles within the planar domain of area
  $A_{tot}$. Details of the implementation are described in Petersen et al. (Reference Petersen, Baker and Coletti2019), including potential sources of bias. In particular, values of
  $g(r)$ at separations below the illuminated volume thickness (
 ${\sim }6\eta$) are affected by projection biases (Holtzer & Collins Reference Holtzer and Collins2002). In figure 1(a), we plot RDFs from both small and large FOV for the case
  $St_{\eta } = 0.3$,
  $\phi _V = 4\times 10^{-5}$. For
  $r/\eta < 5$, the data from the small FOV depart sharply from the exponential decay displayed at larger separation, while for
  $r/\eta > 8$, the RDFs from both FOVs are in good agreement. We therefore use RDFs from the large FOV to illustrate the effect of increasing
  $\phi _V$ for the case
  $St_{\eta } = 2.6$ (figure 1b), with the case
  $St_{\eta } = 0.3$ displaying analogous trends.
Radial distribution functions (RDFs) for (a) both FOVs of the case  $St_{\eta } = 0.3$,
 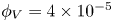 $\phi _V = 4\times 10^{-5}$, and (b) the large FOV of the case
  $St_{\eta } = 2.6$. (c) The characteristic clustering length normalized by the Kolmogorov length scale as a function of volume fraction for the cases
  $St_{\eta } = 0.3$ (black squares) and
  $St_{\eta } = 2.6$ (red circles).

As is apparent in figure 1(b), with increasing particle loading, clustering is more intense and extends over larger scales. For a quantitative assessment, we consider the classic fit proposed by Reade & Collins (Reference Reade and Collins2000):
 \begin{equation} g(r/\eta)=1+c_0(r/\eta)-c_1\exp(-c_2r/\eta). \end{equation}
The length scale  $L_c = \eta /c_2$ defines the extent of the exponential decay, which dominates the behaviour at large separations (Reade & Collins Reference Reade and Collins2000). Therefore, this is taken as a measure of the scale over which clustering occurs. It is obtained by a least squares fit and shown in figure 1(c) as a function of
  $\phi _V$, displaying an increasing trend for both considered
  $St_{\eta }$ values. As expected, the more inertial particles, which respond to larger eddies, cluster over larger scales. This is in keeping with the theoretical work of Goto & Vassilicos (Reference Goto and Vassilicos2006) and Yoshimoto & Goto (Reference Yoshimoto and Goto2007), and with simulations from Bec et al. (Reference Bec, Biferale, Cencini and Lanotte2010) and Ireland, Bragg & Collins (Reference Ireland, Bragg and Collins2016a). The difference between the particle types is likely magnified by the effect of gravity, which is expected to enhance clustering for
  $St_{\eta }>1$ and attenuate it for
  $St_{\eta }<1$ (Bec, Homann & Ray Reference Bec, Homann and Ray2014; Gustavsson, Vajedi & Mehlig Reference Gustavsson, Vajedi and Mehlig2014; Ireland, Bragg & Collins Reference Ireland, Bragg and Collins2016b; Baker et al. Reference Baker, Frankel, Mani and Coletti2017).
The particle spatial distribution is characterized further by Voronoï tessellation, in which every particle is inscribed in a polygonal cell whose size represents the inverse of the local concentration (Monchaux, Bourgoin & Cartellier Reference Monchaux, Bourgoin and Cartellier2010). Figure 2(a) shows the probability density functions (PDFs) of the Voronoï cell areas  $A$ for the case
  $St_{\eta } = 2.6$ at the various
  $\phi _V$. The broadening of the distributions, signalling more inhomogeneous concentration fields, confirms that clustering is intensified with increasing volume fraction. This is quantified in figure 2(b), where the standard deviation of such distributions,
  $\sigma _A$, is normalized by the expected value for particles distributed according to a random Poisson process,
  $\sigma _{RPP} \sim 0.53$ (Monchaux et al. Reference Monchaux, Bourgoin and Cartellier2010). Again, the augmentation of clustering at larger particle loadings is dramatic, and the effect is not significantly dependent on the size of the FOV. The latter, however, influences the quantitative values, because spatial resolution and imaging window size impact the detection of individual particles and clusters. Additionally, this trend is captured by considering the number
  $N_c$ of particles belonging to individual clusters, compared to the total number of particles
  $N_{tot}$ imaged in each case (figure 2c). Individual clusters are defined by the contiguous set of Voronoï cells smaller than a threshold corresponding to the intersection between observed and random distributions (see Baker et al. (Reference Baker, Frankel, Mani and Coletti2017) and Petersen et al. (Reference Petersen, Baker and Coletti2019) for details). The ratio
  $N_c/N_{tot}$ approximately doubles over the considered range of
  $\phi _V$.
(a) PDF of the Voronoï cell areas normalized by the mean value for the case  $St_{\eta } = 2.6$, compared to the distribution found in a random spatial distribution (dashed black line). (b) Standard deviation of such distributions for the case
  $St_{\eta } = 0.3$, with filled and empty symbols indicating small and large FOVs, respectively. (c) Fraction of clustered particles for the cases
  $St_{\eta } = 0.3$ and
  $2.6$.
Figures 3(a) and 3(b) display the PDFs of the cluster area  $A_c$ for the case
  $St_{\eta } = 0.3$, as captured in the small and large FOVs, respectively. Both views exhibit a power-law behaviour over multiple decades, with a slope close to
  $-$2 as reported previously (Monchaux Reference Monchaux2012; Baker et al. Reference Baker, Frankel, Mani and Coletti2017; Petersen et al. Reference Petersen, Baker and Coletti2019). The small FOV indicates a prevalent cluster area
  $A_c = 10\eta \unicode{x2013}60\eta$, with a tendency for the size ranges to reach smaller values at higher concentrations. Besides being a consequence of two-way coupling, this is possibly also due to the fact that sparser particle fields can probe only coarser scales – a source of bias in the Voronoï method (Monchaux Reference Monchaux2012). Indeed, this tendency is also apparent in the large FOV, where the spatial resolution is lower and the peak of the PDF would suggest clusters twice as large compared to the small FOV. On the other hand, the small FOV imposes a cut-off to the maximum detectable cluster size, while the large FOV allows us to capture the stretching of the power-law distributions to much greater
  $A_c$. These extend to
  $O(10^4\eta ^2)$ as
  $\phi _V$ increases, i.e. reaching the integral scales. Combined, the measurements from both FOVs overcome each other's limitations, and indicate that self-similar clusters occur over a range of scales that grows with particle loading.
PDFs of the normalized cluster area for the case  $St_{\eta } = 0.3$ in (a) the small FOV and (b) the large FOV. The dashed lines indicate a
  $-2$ power-law decay.

The observed intensification of clustering at larger volume fractions contrasts with results from previous numerical studies. Monchaux & Dejoan (Reference Monchaux and Dejoan2017) found that for  $St_{\eta }$ and
  $Sv_{\eta }$ comparable to our experiments, clustering as quantified by Voronoï tessellation was less intense with increasing
  $\phi _V$. In similar regimes, Rosa et al. (Reference Rosa, Kopeć, Ababaei and Pozorski2022) found that the RDFs evaluated at the particle radius (specifically relevant for collisions) had a non-monotonic behaviour, first increasing and then decreasing with growing particle concentration. Both simulations used a point-particle approach. The extensive laboratory study from Sumbekova et al. (Reference Sumbekova, Cartellier, Aliseda and Bourgoin2017) did report a moderate tendency of clustering to be enhanced at higher volume fractions. This, however, was overshadowed by the dominant effect of
  $Re_{\lambda }$. Their study featured polydisperse droplets, thus a direct comparison with the present experiments is not straightforward. The physical explanation for the amplified clustering that we observe, and its larger spatial extent at higher loadings, lies in the turbulence modification described in Hassaini & Coletti (Reference Hassaini and Coletti2022). We will discuss this point in the following.
3.2. Particle motion
We first consider the mean vertical velocity of the particles  $\bar {U}_{p,3}$ normalized in figure 4(a) by the still-air terminal velocity
  $\tau _p g$. The settling rate increases substantially with volume fraction; for
  $St_{\eta } = 2.6$, the vertical velocity doubles over the considered range of loadings. Globally, the settling enhancement is comparable to the numerical simulations of Bosse et al. (Reference Bosse, Kleiser and Meiburg2006), Monchaux & Dejoan (Reference Monchaux and Dejoan2017) and Tom et al. (Reference Tom, Carbone and Bragg2022) over similar ranges of particle inertia and concentration (though at much lower
  $Re_{\lambda }$), while Rosa et al. (Reference Rosa, Kopeć, Ababaei and Pozorski2022) found smaller settling enhancement. To quantify the role of the different mechanisms at play, we consider the slip velocity
  $U_{slip}=U_p-U_{fp}$, i.e. the particle velocity relative to the surrounding flow. This follows the definition of slip velocity used, e.g. in Berk & Coletti (Reference Berk and Coletti2021), though the opposite sign convention is also used in the literature. In figure 4(b), the mean settling velocity for the case
  $St_{\eta } = 2.6$ is thus decomposed as
  $\bar {U}_{p,3}=\bar {U}_{slip,3}+\bar {U}_{fp,3}$; the case
  $St_{\eta } = 0.3$ yields analogous trends. Both terms are seen to grow significantly over the considered range of
  $\phi _V$. In one-way coupled systems,
  $\bar {U}_{fp,3}$ encapsulates the contribution of preferential sweeping, while in the presence of two-way coupling, it also includes the effect of the particles dragging the local fluid downwards. Discriminating between the effects is not strictly possible in an experimental setting, where the abstraction of pure one-way coupling cannot be made. We note, however, that in the considered case, preferential sweeping is negligible at the lower loadings (consistent with previous measurements in the same set-up; Petersen et al. Reference Petersen, Baker and Coletti2019). Therefore, we speculate that collective drag is the main contributor to
  $\bar {U}_{fp,3}$ at the higher considered volume fractions, as in Bosse et al. (Reference Bosse, Kleiser and Meiburg2006) and Monchaux & Dejoan (Reference Monchaux and Dejoan2017).
(a) Mean fall speed of the particles, normalized by the still-air terminal velocity  $\tau _p g$, for the case
  $St_{\eta } = 2.6$. (b) Mean fall speed partitioned between contributions of the vertical slip velocity and the vertical fluid velocity at the particle location. (c) Comparison between the mean vertical fluid velocity and the mean vertical fluid velocity at the particle location.

Remarkably, the contribution of  $\bar {U}_{slip,3}$ to the vertical velocity also grows significantly with
  $\phi _V$. This is in contrast with the observation by Monchaux & Dejoan (Reference Monchaux and Dejoan2017) that the local slip velocity tends to vanish at the larger particle loadings. In other studies where settling in quiescent fluids was enhanced by collective drag, the slip velocity was found to remain close to the terminal velocity of an isolated particle. This was the case in the particle-resolved simulations of Uhlmann & Doychev (Reference Uhlmann and Doychev2014) and in the recent experiments of Zürner et al. (Reference Zürner, Toupoint, De Souza, Mezouane and Monchaux2023). In the particle-resolved turbulence simulations of Chouippe & Uhlmann (Reference Chouippe and Uhlmann2019), the vertical slip was slightly smaller than the single-particle terminal velocity, but this was attributed to the tendency of the particles to be in each other's wake, as is typical of their regime (
 $Re_{p} = O(10^2)$, two orders of magnitude larger than here). In the present situation, the increase of
  $\bar {U}_{slip,3}$ is interpreted as a consequence of the amplified turbulent activity at the higher
  $\phi _V$: the more concentrated dispersed phase excites small-scale turbulent fluctuations (Hassaini & Coletti Reference Hassaini and Coletti2022), whose time scales become shorter; these cannot readily be followed by the inertial particles, causing them to lag further the fluid motion and increasing the instantaneous slip velocity.
In the present regimes, the falling particles do not cause a significant global downward motion of the fluid. This is verified in figure 4(c), where  $\bar {U}_{slip,3}$ is shown to increase weakly with
  $\phi _V$, remaining small with respect to all relevant velocity scales of the system. This is important in order to be able to compare our results to numerical simulations, in which
  $\bar {U}_{slip,3}=0$ is imposed by a vertical pressure gradient to prevent the kinetic energy from diverging (Bosse et al. Reference Bosse, Kleiser and Meiburg2006; Monchaux & Dejoan Reference Monchaux and Dejoan2017; Tom et al. Reference Tom, Carbone and Bragg2022).
The substantial increase in settling rate with increasing particle loading applies also to the clusters. In figure 5, we plot the cluster settling velocity  $\bar {U}_{c,3}$ for the case
  $St_{\eta } = 2.6$, obtained by averaging the vertical velocity of all particles belonging to clusters in a given size range. This is normalized by
  $\tau _p g$, and plotted against the cluster area
  $A_c$ (in Kolmogorov units). We observe a substantial increase in settling velocity with cluster size, especially for
  $A_c > 100\eta ^2$. This was noted also in Petersen et al. (Reference Petersen, Baker and Coletti2019), but the respective roles of collective drag and preferential sweeping could not be clearly discerned. Here, we observe a systematic increase of settling velocity with volume fraction, which suggests that collective effects play an important role over the present range of loading. It is remarkable that the larger clusters at
  $\phi _V = 5\times 10^{-5}$ fall almost four times faster than the still-air, single-particle terminal velocity.
Cluster fall speed (normalized by the still-air terminal velocity) as a function of their size, for the case  $St_{\eta } = 2.6$.

Beside the vertical velocity, the slip velocity generally increases with increasing volume fraction. This is shown in figure 6, plotting the PDF of the particle Reynolds number  $Re_p = U_{slip} d_p/\nu$ estimated based on the in-plane slip velocity
  $U_{slip}=\sqrt {U_{slip,1}^2+U_{slip,3}^2}$. As expected, the values remain well below the vortex-shedding regime. Therefore, the turbulence modification is due to the local enhancement of dissipation around the particles and by their collective action, rather than by the injection of energetic wakes (Hassaini & Coletti Reference Hassaini and Coletti2022). However, with increasing
  $\phi _V$, one observes a significant probability of
  $Re_p$ exceeding unity by a wide margin – a situation that complicates the applicability of the point-particle approach. We also remark that
  $Re_p$ is here underestimated systematically as the out-of-plane velocity component is not measured. Finally, we note that the particle Reynolds numbers based on the terminal velocity (
 $Re_p=0.15$ and
  $0.56$ for the cases
  $St_{\eta }=0.3$ and
  $2.6$, respectively) are similar to the mean of the
  $Re_p$ distributions based on the slip velocity. Therefore, basing the particle response time on the latter would lead to similar values, as the far tails of the PDF would have limited statistical significance.
PDFs of the particle Reynolds number for the cases (a)  $St_{\eta } = 0.3$ and (b)
  $St_{\eta } = 2.6$.

So far, we have shown how, at increasing loading, the particles tend to cluster over larger ranges of scales and to slip away more from the local fluid. Both such observations imply that with larger  $\phi _V$, the particles become more inertial with respect to the fluid motion, or in other words, that their effective
  $St_{\eta }$ becomes larger. The particle response is not expected to change significantly with
  $\phi _V$, except for slight adjustments due to the increase of
  $Re_p$ and the consequent correction of
  $\tau _p$ (see Clift et al. Reference Clift, Grace and Weber2005). On the other hand, the total turbulent dissipation (which includes the dissipation in the boundary layer around each particle) is approximately doubled over the considered range of volume fractions compared to the single-phase turbulence, as shown in Hassaini & Coletti (Reference Hassaini and Coletti2022). By Kolmogorov scaling, this produces small-scale motions of shorter time scale, which in turn amplifies the lag between fluid and particles. This view is supported by the following analysis of the particle fluctuating velocity.
In figure 7(a), the vertical component of the particle r.m.s. fluctuation,  $u_{p,3}^{\prime }$, is normalized by the fluid counterpart for the unladen case,
  $u_{f,30}^{\prime }$. At
  $\phi _V = O(10^{-6})$, for which the particle dynamics can be considered approximately one-way coupled, the particle fluctuations are slightly weaker than the fluid fluctuations, as expected in this range of
  $St_{\eta }$ and
  $Sv_{\eta }$ (Good et al. Reference Good, Ireland, Bewley, Bodenschatz, Collins and Warhaft2014). With higher loadings, the particle fluctuating energy grows larger in response to the strong turbulence enhancement caused by the two-way coupling (Hassaini & Coletti Reference Hassaini and Coletti2022). On the other hand, normalizing
  $u_{p,3}^{\prime }$ by the fluid fluctuation at the corresponding volume fraction,
  $u_{f,3}^{\prime }$, returns the opposite trend. Clearly, the more concentrated particles are less and less capable of responding to the turbulence augmented by their very presence; this is again consistent with the notion that their effective inertia grows at higher loadings. Additionally, the larger settling rate magnifies the decorrelation from the local flow structures, which also contributes to a weaker response of the particles to the fluid fluctuating energy (Wang & Stock Reference Wang and Stock1993; Berk & Coletti Reference Berk and Coletti2021).
The r.m.s. velocity fluctuations of the particles (a) normalized by that of the fluid in the unladen case and (b) at the corresponding volume fraction. Data for the case  $St_{\eta } = 2.6$.

The particle response to the underlying turbulence can be described further by two-point statistics. The Eulerian velocity correlation is plotted in figure 8(a), which gives information on the spatial coherence of the particle motion (Fevrier, Simonin & Squires Reference Fevrier, Simonin and Squires2005). As in Fong et al. (Reference Fong, Amili and Coletti2019), we write it as a correlation coefficient between the longitudinal velocity fluctuations of particles  $m$ and
  $n$, separated by a vector
  $\boldsymbol {r}$, and normalized by the velocity variance:
 \begin{equation} R_{uu}(r)=\frac{\overline{u^mu^n\mid \boldsymbol{x}=\boldsymbol{x}_p^m; \boldsymbol{x}+\boldsymbol{r}=\boldsymbol{x}_p^n}}{\overline{u^2}} \end{equation}
Here,  $\boldsymbol {x}$ is a spatial location within the FOV,
  $\boldsymbol {x}_p^i$ is the position of the particle
  $i$, and the fluctuating velocities are projected along
  $\boldsymbol {r}$. The coefficient does not approach unity for vanishingly small separations, indicating that a sizeable fraction of the particle velocity is spatially uncorrelated. This ‘random uncorrelated motion’, rooted in the memory of interactions with distant eddies, represents a larger fraction of the total for more inertial particles (Fevrier et al. Reference Fevrier, Simonin and Squires2005; Wilkinson & Mehlig Reference Wilkinson and Mehlig2005; Bragg & Collins Reference Bragg and Collins2014; Fong et al. Reference Fong, Amili and Coletti2019). For particles of non-negligible inertia, such a component of the motion is considered among the main causes of small-scale clustering (Gustavsson & Mehlig Reference Gustavsson and Mehlig2016). Here, the correlation coefficient is lower for higher loading and also decays more rapidly with increasing
  $\phi _V$. Therefore, despite the clusters stretching over larger scales, the particle motion becomes less spatially coherent. This is further evidence that the particles acquire a larger effective
  $St_{\eta }$ at higher loadings.
(a) Autocorrelation function and (b) second-order velocity structure function for the particles in the case  $St_{\eta } = 2.6$.

Similar considerations apply to the relative particle velocity, quantified in figure 8(b) by the second-order longitudinal structure function  $S_2(r)=\overline {[u(x+r)-u(x)]^2}$, where again we take the components of the fluctuating velocities along the separation vector
  $\boldsymbol {r}$. We note that the finite thickness of the laser sheet leads to an overestimation of the relative velocity over the separations
  $r \lesssim 6\eta$ (Dou et al. Reference Dou, Bragg, Hammond, Liang, Collins and Meng2018), but this may not overshadow the trend. For tracers,
  $S_2$ scales as
  $r^2$ and
  $r^{2/3}$ in the dissipative and inertial range, respectively (Kolmogorov Reference Kolmogorov1941). For heavy particles, due to the above-mentioned memory effect and lack of spatial correlation, the relative velocities between close particles increase, and
  $S_2(r)$ progressively deviates from the
  $r^2$ scaling at small separations; see numerical simulations by Bec et al. (Reference Bec, Biferale, Cencini and Lanotte2010) and Ireland et al. (Reference Ireland, Bragg and Collins2016a,b), among others, and experimental measurements by Dou et al. (Reference Dou, Bragg, Hammond, Liang, Collins and Meng2018) and Berk & Coletti (Reference Berk and Coletti2021). Here, we observe a systematic increase in relative velocity with volume fraction. This is again in line with the notion that the particles have higher
  $St_{\eta }$. This in turn may cause higher collision frequency (Sundaram & Collins Reference Sundaram and Collins1997), though the present measurements do not have sufficient spatio-temporal resolution to quantify such an effect.
Finally, we consider the particle acceleration, whose PDF is plotted in figure 9(a). We display the vertical component, the horizontal one behaving similarly. For all considered cases, the mean acceleration is small, as the particles have reached terminal velocity before entering the FOV. The distributions display the familiar exponential tails signalling intermittency, which is, however, modulated by inertial filtering (Ayyalasomayajula et al. Reference Ayyalasomayajula, Gylfason, Collins, Bodenschatz and Warhaft2006; Bec et al. Reference Bec, Biferale, Boffetta, Celani, Lanotte, Musaccio and Toschi2006). Normalizing the acceleration PDF by its r.m.s. fluctuations reduces the spread of the distributions but does not lead to a collapse, unlike in Qureshi et al. (Reference Qureshi, Bourgoin, Baudet, Cartellier and Gagne2007), where dilute neutrally buoyant particles of varying size were considered. The acceleration variance is presented in figure 9(b) for both values of  $St_{\eta }$, as a function of
  $\phi _V$. The values are normalized by those predicted by the model of Berk & Coletti (Reference Berk and Coletti2021) (see their (4.12)), who expanded on the theory of Csanady (Reference Csanady1963) to derive expressions for the time scale of the flow experienced by heavy particles. At the lowest volume fraction, the measured values agree closely with the theory, which applies to one-way coupled systems. With increasing loading, the particles exhibit a substantial increase of acceleration variance. This is seemingly in contrast with the idea that the particles are effectively more inertial in the more concentrated regime, as argued above. The contradiction is resolved by recognizing that the acceleration is dominated by the other major consequence of two-way coupling, namely the settling enhancement. This intensifies the crossing trajectories effect, which causes particles to experience quickly changing flow conditions (Squires & Eaton Reference Squires and Eaton1991a; Elghobashi & Truesdell Reference Elghobashi and Truesdell1992; Wang & Stock Reference Wang and Stock1993). Thus, as the particles fall faster, their effective
  $Sv_{\eta }$ increases, in turn augmenting their acceleration variance (Ireland et al. Reference Ireland, Bragg and Collins2016b; Berk & Coletti Reference Berk and Coletti2021). In addition to this effect, the enhanced turbulence intensity caused by the particles themselves also contributes to augmenting their acceleration.
(a) PDF of the vertical particle accelerations for the case  $St_{\eta } = 2.6$, normalized by the Kolmogorov acceleration. (b) The r.m.s. particle acceleration normalized by the theoretical prediction of Berk & Coletti (Reference Berk and Coletti2021) for the cases
  $St_{\eta } = 0.3$ and
  $2.6$.

4. Conclusions
We have analysed the behaviour of heavy particles in homogeneous turbulence, with  $St_{\eta }$ and
  $Sv_{\eta }$ of order unity, increasing the volume fraction systematically from
  $\phi _V = 10^{-6}$ to
  $\phi _V = 5\times 10^{-5}$ to isolate the effect of two-way coupling on the spatial organization and motion of the dispersed phase. We find that both clustering and settling are strongly enhanced when the loading is increased. In particular, both RDFs and the Voronoï tessellation method show that with increasing
  $\phi _V$, particle clustering is intensified at all scales. Combining two nested FOVs, we find that the more concentrated particles form self-similar clusters whose size range reaches deeper into the dissipative range and stretches further over the integral scales. The particle settling velocity is approximately doubled over the considered range of volume fractions. This is due, in approximately equal measure, to two factors: an increased association of the particle location with downward fluid velocity, and a larger slip velocity between the particles and the fluid. The former may be caused by both preferential sweeping and collective drag. While we cannot discriminate conclusively between these two effects, the fact that preferential sweeping is not significant in the most dilute regime suggests that collective drag plays a dominant role. The extended scales of the cluster and the increased slip velocity suggest that the particles attain an effectively larger
  $St_{\eta }$ as a consequence of the turbulence modification. This is confirmed by the behaviour of the particle fluctuating energy, which becomes a smaller fraction of the turbulent kinetic energy (TKE) as the loading is increased.
These findings can be understood in light of the effect that the particles themselves have on the underlying turbulence, which we investigated recently in Hassaini & Coletti (Reference Hassaini and Coletti2022). There, we demonstrated and quantified how the dispersed phase enhances the TKE and its dissipation rate by releasing potential energy into the fluid, exciting in particular the smallest scales of the fluid motion. This yields faster dissipative time scales, which the particles are less able to follow. Indeed, the two-point particle velocity statistics indicate how at higher concentrations, the uncorrelated component of the particle motion becomes larger and comparable to the correlated one. Likewise, the relative particle velocity at small separations increases. This is consequential for the collision probability, although the latter will depend on short-range interactions (Bragg et al. Reference Bragg, Hammond, Dhariwal and Meng2022) that are not resolved here.
In Hassaini & Coletti (Reference Hassaini and Coletti2022), we estimated that the overall dissipation rate was approximately doubled over the present range of particle loading, which would imply an increase of about 40 % of the effective  $St_{\eta }$ and a decrease of about 20 % of
  $Sv_{\eta }$. The same study, however, demonstrated how the turbulence is altered in qualitatively different manners at the different scales. Therefore, it is not straightforward to condense the multifaceted changes in particle–turbulence interaction in the value of the effective
  $St_{\eta }$ and
  $Sv_{\eta }$.
We confirm that  $\phi _V = O(10^{-6})$ is a robust threshold for the emergence of two-way coupling (Elghobashi Reference Elghobashi1994), not only from the standpoint of turbulence modification but also in terms of particle behaviour. This is verified only at the present high density ratios, typical of solid–gas systems; for solid–liquid suspension, a criterion remains to be determined univocally (Brandt & Coletti Reference Brandt and Coletti2022). Indeed, the threshold is more likely to be determined by the mass fraction
  $\phi _m$, which governs the momentum transfer. A clear distinction between the effects of
  $\phi _V$ and
  $\phi _m$ can be discerned only by changing the solid-to-fluid density ratio, which is outside the scope of our study. In the future, this could be achieved by contrasting, e.g. plastic particles against metallic ones, or resorting to adjustable soap bubbles as in Qureshi et al. (Reference Qureshi, Arrieta, Baudet, Cartellier, Gagne and Bourgoin2008).
The increase of the effective  $St_{\eta }$ alone does not explain the increase in
  $\bar {U}_{slip,3}$. Clearly, gravity breaks the symmetry in the distribution of the vertical slip velocity
  $U_{slip,3}$ as it does for
  $U_{fp,3}$: both have non-zero mean whose magnitude increases with volume fraction. Tom et al. (Reference Tom, Carbone and Bragg2022) found in their numerical simulations that heavy particles are often found in high-strain regions of the velocity field coarse-grained at scales corresponding to the particle response time. This was proposed as a spatially filtered version of preferential sweeping: the particles are swept downwards by eddies more energetic than the Kolmogorov-size vortices. According to this view, preferential sweeping (here promoted by two-way coupling) may play a role in the increase of downward slip velocity with volume fraction: the more energetic eddies sweeping down the particles may lead to larger slip velocities, as we observe. As the particles take a finite time to adjust to the local flow conditions, this can result in globally enhanced settling velocities.
The present findings provide indications for the mechanistic interpretation of the complex particle-turbulence interplay, also in regard to aspects that have remained elusive, such as the origin of clustering (Brandt & Coletti Reference Brandt and Coletti2022). In this regard, we note how, while the trends for both considered particle sizes are similar, clustering is more intense for  $St_{\eta } > 1$. This does not support the notion that particle accumulation is driven mainly by the centrifuging mechanism; this applies strictly for
  $St \ll 1$, and under relatively weak gravitational drift (Maxey Reference Maxey1987). Mechanisms that can account for significant inertia and crossing trajectories are more likely to cause the observed trends. In particular, the path-history effect (Bragg & Collins Reference Bragg and Collins2014) is consistent with our observations, especially considering the association of clustering with the uncorrelated motion of the dispersed phase.
These results can also inform numerical models with various degrees of fidelity, as it is possible presently to realize two-way coupled point-particle simulations in the considered range of  $Re_{\lambda }$ and
  $\phi _V$. Of particular interest is the fact that the increase of
  $\phi _V$ is associated to a significant probability of
  $Re_p$ exceeding unity by a wide margin – a situation for which the applicability of the point-particle approach needs to be tested systematically. Finally, we note that the planar imaging technique adopted here has allowed for relatively high concentrations, which would have been challenging to achieve with classic reconstruction algorithms for volumetric imaging. Recent advances in three-dimensional Lagrangian particle tracking, however, allow for accurate measurements at comparably dense concentrations (Discetti & Coletti Reference Discetti and Coletti2018; Schröder & Schanz Reference Schröder and Schanz2023). Their application in the considered regimes is warranted, as this would reveal the effect of two-way coupling on other relevant observables, such as the Lagrangian dispersion (Bourgoin Reference Bourgoin2015) and the lifetime of clusters (Liu et al. Reference Liu, Shen, Zamansky and Coletti2020).
Declaration of interests
The authors report no conflict of interest.


 Open access