

Recent Retreat of the Kilimanjaro Ice Fields
Another paper in this issue (Reference Thompson, Mosley-Thompson, Davis and BrecherThompson and others, 2011) discusses the widespread retreat of modern glaciers throughout the tropics. Assessing the significance of this recent glacier loss requires placing it in a temporal perspective derived from the best data available. Ice-core derived climate reconstructions from a number of low-latitude glaciers contribute substantially to such a database.
The current shrinking and thinning of the ice fields on the summit of Kibo, the central peak of Kilimanjaro, Tanzania, are placed in a longer-term context using both direct observations and the reconstruction of Holocene climatic variations from the suite of six cores drilled there in 2000 (Reference ThompsonThompson and others, 2002, Reference Thompson, Brecher, Mosley-Thompson, Hardy and Mark2009). Constructing the paleoclimate histories from these ice cores was a challenge due to the lack of annual resolution and the removal of the most recent five decades of record by surface ablation. Here we review the climate history provided by the Kilimanjaro ice cores, discuss recent observations and address the significance of the current retreat of its summit glaciers.
Reference OsmastonOsmaston (2004) presented an overview of past glaciations on Kilimanjaro, with the first known glaciations dated back ~500 ka BP. Based on evidence from cosmogenic 36Cl dating of moraine boulders, he concluded that the main glaciation occurred from 17 to 20 ka BP, or around the Last Glacial Maximum. From his map of the moraines on the summit of Kibo, the maximum ice coverage is calculated as 116.6 km2, >60 times larger than at present (1.82km2) (Reference Thompson, Brecher, Mosley-Thompson, Hardy and MarkThompson and others, 2009). There is no evidence that this ice survived the Bølling interstadial (~14.6–14.0 ka BP, calibrated), and 14C dates on material from near the bottom of the Northern Ice Field (NIF) core 3 (NIF3) suggest that the basal ice dates to the early Holocene (~9–10 ka BP) (Reference ThompsonThompson and others, 2002). Comparison with the oxygen isotope (δ18O) records from six geographically dispersed low-latitude, high-elevation ice cores (Reference Thompson, Davis, Mosley-Thompson, Lin, Henderson and MashiottaThompson and others, 2005) suggests that glacier growth on Kilimanjaro began early in the African Humid Period (~14.5–5.5 ka BP). However, as the 14C dates were measured on samples of small mass, additional lines of evidence must be considered to determine whether it is physically possible for the interior ice of the NIF to be of early Holocene age.
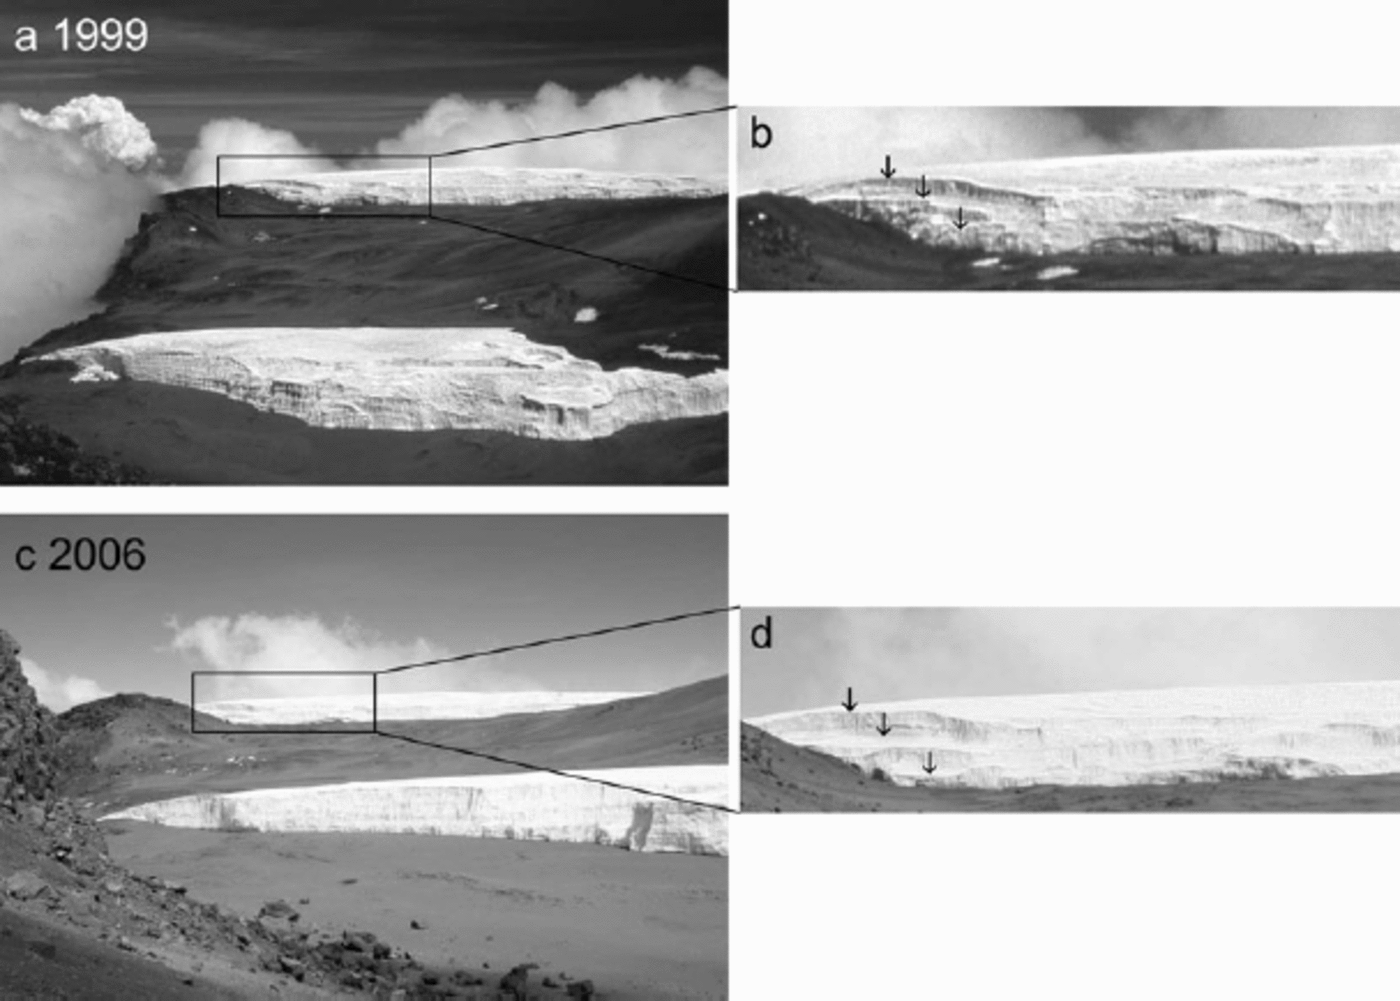
It is instructive to examine the processes currently contributing to the shrinking of these ice fields. For example, Figure 1 documents the ice loss between 1999 and 2008 on Furtwängler Glacier (FWG), a small ice field in the middle of the Kibo crater that covered 57 149m2 in 2000 and only 35 024 m2 in 2007. In 1999 the FWG margin was an intact wall ~10m high (Fig. 1a); however, by 2006 the margin had retreated and collapsed, leaving a narrow remnant of the wall (Fig. 1b and c). Over the next 2 years, all the ice along this section of the margin disappeared (Fig. 1d and e), demonstrating how rapidly these processes are occurring. The ablation occurs primarily by melting and by wind-driven sublimation. Similar processes are underway along the vertical margins of all these ice fields, including the NIF, the highest and largest ice field on Kibo. A photograph taken in 1999 from Uhuru summit peak looking north toward the NIF, with FWG in the foreground (Fig. 2a), shows a section of the vertical margin of the NIF containing three ‘steps’ on the western side that are detailed in the enlarged section (Fig. 2b). A 2006 photo (Fig. 2c and d) shows that these three steps (see arrows) are active collapse features that have evolved from the top downward along the retreating margins during this 7 year period. Much of the present margin consists of more recent ice which has collapsed from above; thus, older ice would be expected only in the center of the ice field. These photos demonstrate that these features along the margin are recent, very active and driven primarily by current climate change.
The rapid retreat of Furtwängler Glacier between 1999 and 2008 is illustrated with particular reference to the southern margin. In 1999 (a) the margin was intact, but by 2006 (b) the glacier was bifurcating and this wall had thinned dramatically (c). By 2008 FWG had separated into two parts (d), and the breach in the wall was complete (e).

The southern margin of the Northern Ice Field in 1999 (a) contained three ‘ledges’ indicated by the arrows in (b). By 2006 the margin had collapsed and rapid surface lowering had occurred (c, d).
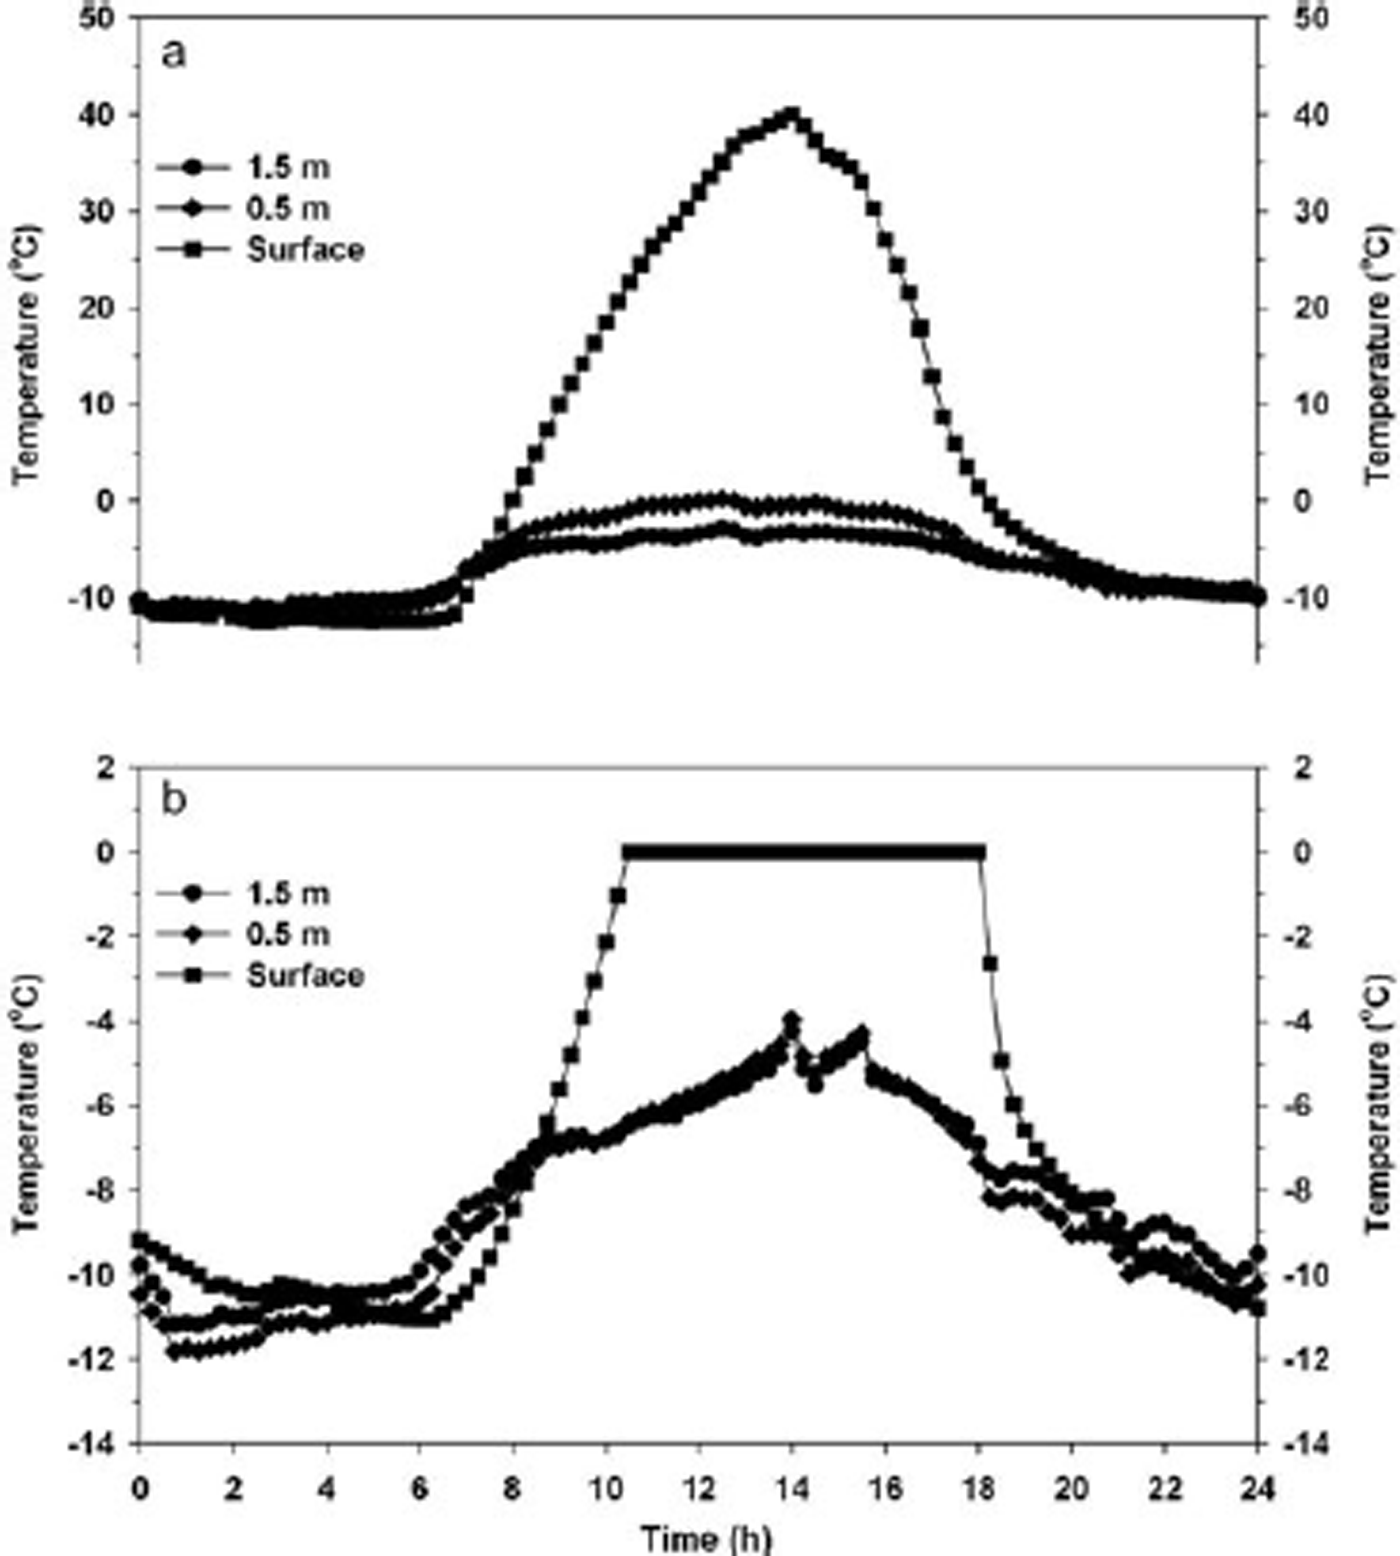
The retreating ice exposes more of the darker crater surface which absorbs more radiation and further accelerates glacier loss. This was documented by a surface energy-balance study conducted during the 32 day ice-core drilling program in 2000. Energy-balance stations were installed on the NIF (Fig. 3a) and the crater surface (Fig. 3b). The stations included Eppley pyranometers, Swisteco net radiometers, Campbell Scientific Met One anemometers and HMP45C temperature and relative humidity probes. In addition to surface temperature, incoming shortwave, reflected shortwave, net radiation, air temperature, relative humidity, and wind speed were measured at two levels (0.5 and 1.5m above the surface). Using these data, the extraterrestrial irradiance, emitted and incoming longwave radiation, albedo and vapor pressure were derived. The extraterrestrial irradiance, which drives the surface temperature, exceeded 1300Wm–2 at noon. Thus, even with 0.5 and 1.5 m air temperatures of –5˚C or lower, melting can occur on the glacier surface. The exposed crater surface reached temperatures exceeding 40˚C (Fig. 4a), while glacier surface temperatures reached the melting point and were sustained there for up to 8 hours on a clear day (Fig. 4b), thereby facilitating melting.
An energy-balance station was established on the NIF (a), while a second station was established on the surface of the Kibo crater (b).

Air and surface temperatures measured on Julian day 47 on (a) the exposed crater surface and (b) the NIF.
Ice-Core Dating and Validation
Ice-flow models have been used to date the older sections of ice cores since the first drilling program in Greenland in 1966 (Reference JohnsenJohnsen and others, 1992). The physics of ice flow is well established (Reference PatersonPaterson, 1994) and has been successfully applied to glaciers around the world, including mountaintop glaciers, often with independent time checks on the model results. The first high-altitude tropical ice cap dated to the base via a modeling approach is Quelccaya, Peru, the world’s largest tropical ice cap (Reference Thompson, Bolzan, Brecher, Kruss, Mosley-Thompson and JezekThompson and others, 1982). Prior to drilling, the depth–age calculations suggested that a core to bedrock would cover at least 600 but no more than 1300 years. The cores drilled in 1983 contain ~1500 years, as determined from stable-isotope and dust analyses and counting visible annual layers (Reference Thompson, Mosley-Thompson, Bolzan and KociThompson and others, 1985). Thus, in the absence of an annually dated ice core, models may provide an acceptable approximation of bottom ages. Versions of this flow model have been used in subsequent age calculations for mountain glaciers in China, the Himalaya and the Peruvian Andes. Model ages are routinely checked with independent dating techniques including accelerator mass spectrometry (AMS) 14C and cosmogenic dates, gas measurements, annual-layer counting (where possible) and stable-isotope matching with absolutely dated records (Reference ThompsonThompson and others, 1997, Reference Thompson1998).
Reconstructing the time series for the Kilimanjaro ice cores was challenging. The procedure involved constructing a timescale for NIF3, drilled in the middle of the ice field and containing the longest record. The other five cores were then referenced to this ‘master chronology’ by matching common δ18O features. We used the simplest age modeling for a steady-state glacier of constant accumulation, the method first introduced by Reference NyeNye (1963) and later used by Reference Dansgaard, Johnsen, Møller and LangwayDansgaard and others (1969).
For any given ice field, the ice-core chronology can be more or less robust depending on the availability of different types of calibration points. For Kilimanjaro, three timelines guided the application of the flow model (Reference ThompsonThompson and others, 2002 (online supplement: http://www.sciencemag.org/content/suppl/2002/10/16/298.5593.589.DC1.html)). The year AD 1950, which is also the origin of the calibrated-radiocarbon timescale, was assigned to a depth of 1.6 m, consistent with the 36Cl bomb horizon. Other timelines came from comparison with regional paleoclimate records that cover the past millennium (e.g. Reference Verschuren, Laird and CummingVerschuren and others, 2000). A basal age was assigned using the U/Th dated Soreq Cave (Israel) speleothem isotope record containing δ18O events that are likely contemporaneous (and inversely correlated) with δ18O events in NIF3. Finally NIF3 was dated back to 11.7 ka BP by applying the finite Nye flow model. The model results are supported by 15 AMS 14C dates (Reference ThompsonThompson and others, 2002, table S1). While the masses of the sample material used for carbon dating were very low, this analysis of organics frozen in the ice at the top of a mountain like Kilimanjaro does not suffer from many of the issues that plague AMS 14C dating in other archives (e.g. reservoir effects; ‘old carbon’ contamination). The AMS dates of ~9010 years BP at 47.40 m, and ~9360 years BP at 48.43 m, support the model ages and the presence of old ice near the bottom in the center of the NIF. While it is very easy to contaminate old carbon with modern carbon during sample preparation, it is very hard to contaminate a sample with old carbon, so the dates on material found near the bottom of NIF3 are very likely robust.
The key factors determining the length of the time series contained in a glacier are accumulation rate, ice thickness and temperature at the ice/bedrock interface. The latter is the most critical control on the basal age. If a glacier is frozen to the bedrock then time cannot be removed. Hence, relatively thin mountain-top glaciers (as opposed to valley glaciers) that remain frozen to their bed may contain very long histories. For example, >500 ka of climate history is preserved in the 308m Guliya ice cap in the western Kunlun Shan, China (Reference ThompsonThompson and others, 1997). The ice temperature measured in 2000 at the base of the NIF on Kibo was –0.4˚C. The climate record from the center of the NIF may seem long in light of the thickness (48.97 m) of the glacier; however, the basal temperature in 2000, under the current warm conditions, precludes removal of ice from the bottom.
The six Kilimanjaro ice-core records show that the individual ice fields differ significantly in age. The youngest ice field (Furtwängler) is a little over 200 years old at the bottom, while the two cores from the Southern Ice Field (SIF) date to ~1.5 ka BP at the base. Two ~50m cores from near the southern margin of the NIF are both ~4ka BP at the bottom. Together these records confirm that the ice fields on Kibo have expanded and contracted throughout the Holocene, with the center of the NIF (reflected in NIF3) apparently surviving the variable climate conditions throughout the Holocene.
FWG was the only ice field found to be water-saturated during the 2000 ice-core drilling. Figure 5 shows water pouring out of the core barrel during core extraction. The temperature throughout FWG was at the pressure-melting point (0˚C) during that field season. The effect of this saturation on the soluble chemistry of the ice is illustrated by comparing the major anion and cation concentrations in the NIF3 (Fig. 6a) and FWG ice cores (Fig. 6b). For example, the sulfate concentrations in FWG are uniformly low except for a basal spike from material entrained from the substrate. While melting has removed most of the soluble anions and cations from the FWG ice column, NIF3 does not show similar evidence of melting and percolation throughout its 11.7 ka history (Fig. 6a).
During the 2000 drilling of FWG, water poured from the drill barrel after each run, illustrating that the glacier was water-saturated throughout.

The records of major anion and cation concentrations from NIF3 (a) and FWG (b) illustrate the effect of melting on the soluble aerosol concentrations throughout the glacier.

The δ18O and δD records (Fig. 7a and b) were measured simultaneously along the entire length of NIF3. Their linear relationship (Fig. 7d) is statistically significant (r 2 = 0.98) and virtually identical to both the well-defined global meteoric waterline (GMWL), δD=8δ18O+10, first proposed by Reference CraigCraig (1961), and that calculated on a global basis, δD = 8.17δ18O+ 10.35, by Reference Rozanski, Aragu, Gonfiantini, Swart, Lohmann, McKenzie and SavinRozanski and others (1993). Field observations and modeling experiments indicate that sublimation (evaporation) produces an enrichment of deuterium which decreases the deuterium excess (d = δD–8δ18O; Fig. 7c). The result is a reduction in the slope of the linear relationship between δ18O and δD to values of ~4 or ~5, well below 8, characteristic of the GMWL (Reference Stichler, Schotterer, Fröhlich, Ginot, Kull and GäggelerStichler and others, 2001). Reference Gat, Aggarwal, Gat and FroehlichGat (2005) reports that in drier areas where sublimation (evaporation) plays a significant role, the slope of the local meteoric waterline is consistently and significantly different from that of the GMWL (~5 versus ~8). Reference Stichler, Schotterer, Fröhlich, Ginot, Kull and GäggelerStichler and others (2001) argue that simultaneous measurements of δ18O and δD help identify ice-core layers potentially affected by sublimation (evaporation).
The linear relationship between (a) δ18O and (b) δD for 10 cm averages (using all samples) from NIF3 shows that the slope and y-intercept (d) are in close agreement with the GMWL. The d-excess for all samples is also shown (c).

The δ18O and δD records from five ice cores drilled in 2000 from the three remaining ice fields on the summit of Kilimanjaro (Fig. 8) approximate the well-defined GMWL. The linear relationship between δ18O and δD in NIF3 is shown for the top 33 m (Fig. 8a) containing the drier, more isotopically depleted late-Holocene ice. Figure 8b shows the same relationship in the lower section (33m to bedrock) of NIF3 that contains ice deposited during the wetter, more isotopically enriched, early-Holocene African Humid Period (Reference ThompsonThompson and others, 2002). There are no significant deviations from the GMWL throughout the NIF3 record, or in four other cores from the three surviving ice fields (Fig. 8c–f). Thus, the δ18O and δD isotopic records do not support sublimation (evaporation) as the primary mechanism for ice loss on the flat upper surfaces of the Kilimanjaro ice fields either today or in the past. Moreover, given that the isotopic composition of surface snow can be modified post-depositionally by evaporation, sublimation, wind erosion and diffusive mixing of water vapor, the consistency of the δ18O–δD relationship among the Kilimanjaro ice-core records is noteworthy (Reference Thompson, Davis, Aggarwal, Gat and FroehlichThompson and Davis, 2005).
The linear relationship between δ18O and δD for (a) the upper 33 m and (b) 33 m to the bottom of NIF3 has very similar slopes and intercepts. The similarity between the δ18O–dD relationship for NIF2 (c), the two SIF cores (d, e) and FWG (f) suggests that all the ice fields are affected by the same processes.

The visible stratigraphy of the ice provides another line of evidence demonstrating how the changes now observed on the Kilimanjaro ice fields are unusual in the context of the past ~11 700 years. The observed surface lowering on the NIF (Reference Thompson, Brecher, Mosley-Thompson, Hardy and MarkThompson and others, 2009) is partially the result of surface melting, a recent phenomenon confirmed by the stratigraphy of NIF3. The upper 65 cm of the core is the only portion containing elongated bubbles and open voids which are characteristic of extensive melting and refreezing. These features are not observed in any other sections of the core (Thompson and others, 2002 (online supplement: http://www.sciencemag.org/content/suppl/2002/10/16/298.5593.589.DC1.html), 2009). This observation, along with the soluble chemistry data (Fig. 6a), confirms the absence of surface melting and percolation during the previous ~11 700 years.
Tropical East Africa Paleoclimate Records
Tropical East Africa paleoclimate records since 1.5 ka BP
Since publication of the Kilimanjaro ice-core results (Reference ThompsonThompson and others, 2002) several new paleoclimate records that support the general interpretation of the original ice-core record on decadal to millennial timescales have appeared. A comparison of the TEX 86-inferred lake surface water temperature (LST) record from Lake Tanganyika on the Tanzanian border (Reference TierneyTierney and others, 2010) with the Kilimanjaro ice-core δ18O records is shown in Figure 9. This new record demonstrates that the late-20th-century warming in Lake Tanganyika is unprecedented over the last 1.5 ka BP. Unfortunately, the upper layers of the Kilimanjaro ice cores are missing due to mass loss from the surface, so it is impossible to compare the changes over the last ~50 years. The similarities between the LST and δ18O time series are apparent over the previous ~1500 years, albeit with a slight offset. The lacustrine temperature record points to an increase in LST of 2˚C since 1900 (Reference TierneyTierney and others, 2010), which is higher than the 1.3˚C temperature rise measured instrumentally since 1913 (Reference Verburg, Hecky and KlingVerburg and others, 2003). Moreover, the charcoal data from these lake cores show a systematic decrease (wetter conditions) from the late 1800s to the present, similar to the instrumental trend for the greater East African region (Reference Hulme, Doherty, Ngara, New and ListerHulme and others, 2001). The marked 20th-century warming recorded here, coupled with wetter conditions in East Africa, points to temperature as an important driver for recent loss of glaciers throughout equatorial Africa. As temperatures rise throughout the region, the insolation-driven melting (Fig. 4) on Kilimanjaro’s ice fields should increase. Reference Taylor, Mileham, Tindimugaya, Majugu, Muwanga and NakilezaTaylor and others (2006) draw similar conclusions regarding the primary driver of glacier shrinkage in the Rwenzori. Since 2006 a multidisciplinary program has been underway to monitor current temperature and limnological conditions to reconstruct past climate as well as glacial and limnological changes in the Rwenzori Mountains on the border between Uganda and the D.R. Congo (Reference Eggermont, Russell, Schetter, Vandamme and VerschurenEggermont and others, 2007, Reference Eggermont2010a, Reference Eggermont, Heiri, Russell, Vuille, Audenaert and Verschurenb; Reference Russell, Eggermont and VerschurenRussell and others, 2008). Sedimentological and biogeochemical data from gravity cores collected from lakes in presently glaciated and nonglaciated basins show that the initiation of the current glacier recession matches the initiation of historical climate warming, suggesting temperature, and not hydrological change, as the primary driver of Rwenzori glacier recession.
The lake surface temperature record from Lake Tanganyika (Reference TierneyTierney and others, 2010) and the δ18O records from five ice cores recovered on Kilimanjaro share numerous common features.

Tropical East Africa millennial-scale paleoclimate records
Incoming solar radiation (insolation) increased over the Northern Hemisphere (NH) tropics during the early Holocene as Earth recovered from the last glacial stage. NH insolation peaked at ~9ka BP and decreased toward the present (Fig. 10a). A more recent record of total solar irradiance (Reference Steinhilber, Beer and FröhlichSteinhilber and others, 2009), based on 10Be measured in ice cores, is presented in Figure 10b. Considering possible ice-core dating uncertainties, reductions in solar output centered on ~5.5 and ~7.5 ka BP are broadly consistent with isotopic enrichment in the continuous Soreq Cave speleothem record (Fig. 10c; Reference Bar-Matthews, Ayalon, Kaufman and WasserburgBar-Matthews and others, 1999) and with the isotopic depletion in the Kilimanjaro ice cores (Fig. 10d). The shape of the NH insolation curve is consistent with the Soreq Cave record and the records from Kilimanjaro and from Huascarán (9˚ S; not shown) in the Cordillera Blanca of northern Peru. Although Huascarán is located in the Southern Hemisphere, its stable-isotope record follows the NH insolation curve because the predominant source of its precipitation is the tropical North Atlantic (Reference ThompsonThompson and others, 1995).
Comparison of (a) tropical NH summer insolation and (b) total solar irradiance (Reference Steinhilber, Beer and FröhlichSteinhilber and others, 2009) through the Holocene, with (c) the δ18O record from the Soreq Cave (Israel) speleothem (Reference Bar-Matthews, Ayalon, Kaufman and WasserburgBar-Matthews and others, 1999) and (d) the Kilimanjaro δ18O ice-core record (as 50 year averages) illustrates the relationship between variations in tropical insolation and the tropical stable-isotope records which both record the abrupt climatic cooling at ~5.2 ka BP.

Both the ice cores from Kilimanjaro and the speleothems from Soreq Cave contain evidence that the same abrupt events that occurred in East Africa also occurred in the Middle East during the Holocene (Reference Bar-Matthews, Ayalon, Kaufman and WasserburgBar-Matthews and others, 1999; Reference Bar-Matthews, Ayalon and BattarbeeBar-Matthews and Ayalon, 2004). One of the most dramatic mid-Holocene abrupt climate events occurred around 5.2 ka BP. Evidence of this event is expressed in the Kilimanjaro record as a sharp but short-lived depletion in 18O suggestive of an abrupt and extreme cooling episode (Reference ThompsonThompson and others, 2002). It was also the most prominent climatic event of the last 13 000 years in the Soreq Cave record and is present in numerous climatic, biological and archeological records from around the world. Many tropical paleoclimate records, especially those located in the African/ Asian monsoon region, indicate that climate conditions turned either sharply arid or more humid at ~5ka BP (Reference Magny and HaasMagny and Haas, 2004), and records from East Africa suggest increased aridity around this time (Reference Chalie and GasseChalie and Gasse, 2002).
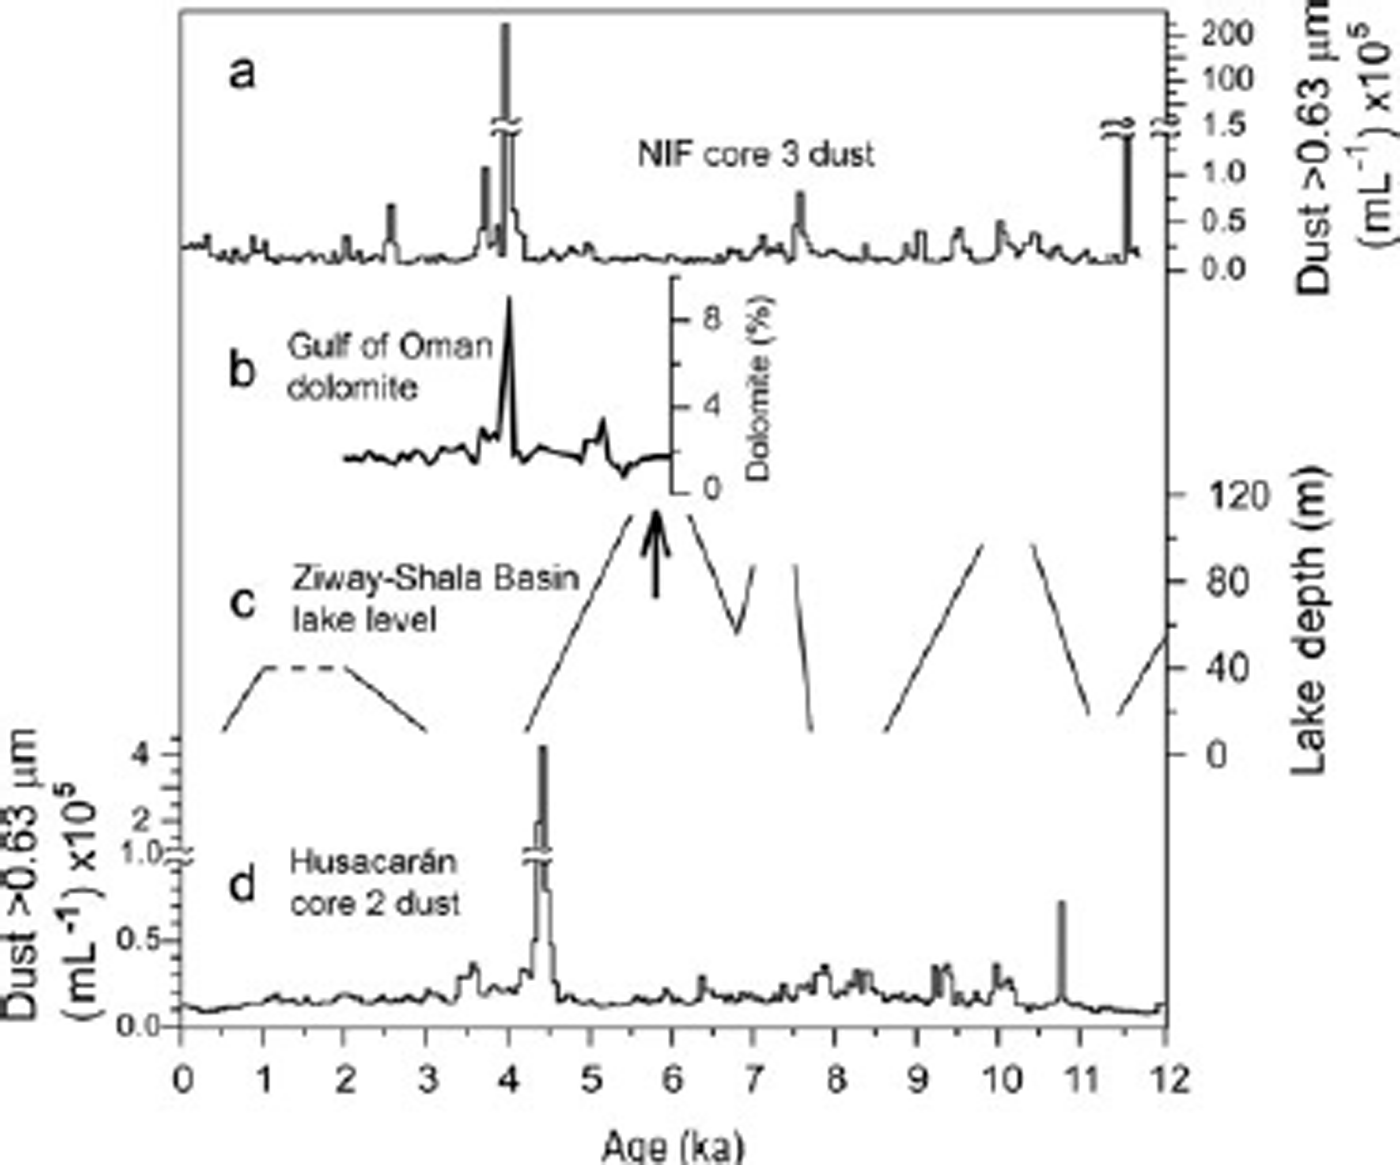
A number of proxy climate records from the tropics chronicle an abrupt climate event roughly one millennium after the mid-Holocene cold event. The event appears from ~4.0 to 4.5 ka BP in various records that extend from South America to northern Africa and eastern China. It appears to be associated more with extreme decreases in effective moisture than with temperature changes. The large dust spike in the Kilimanjaro record, dated ~4.0 ka BP (Fig. 11a), occurred within this time frame and was possibly the product of this ‘mega-drought’. The event may have lasted a few centuries, and during this time the NIF, which is presently the largest ice field on the mountain, may have dramatically decreased in size (Reference ThompsonThompson and others, 2002). In addition to the Kilimanjaro NIF3 record (Fig. 11a), this abrupt climate event is recorded in marine cores from the Indus delta region (Reference Staubwasser, Sirocko, Grootes and SeglStaubwasser and others, 2003; not shown) and the Gulf of Oman (Reference Cullen, deMenocal, Hemming and HemmingCullen and others, 2000; Fig. 11b) where an abrupt spike in carbonates has been chemically traced to an archeological site (Tell Leilan) in Syria, the home of the ancient Akkadian culture (Reference WeissWeiss and others, 1993). Lake records from equatorial Africa (Reference Gillespie, Street-Perrott and SwitsurGillespie and others, 1983) indicate that water levels decreased greatly (Fig. 11c), as did levels in western Tibet (Reference GasseGasse and others, 1991, Reference Gasse, Fontes, Van Campo and Wei1996). Other records contain evidence of a contemporaneous, sudden and marked episode of aridity. The Soreq Cave speleothem record (Reference Bar-Matthews, Ayalon, Kaufman and WasserburgBar-Matthews and others, 1999; Reference Bar-Matthews, Ayalon and BattarbeeBar-Matthews and Ayalon, 2004) shows an abrupt decrease in δ13C within the 4.2– 4.5 ka BP window, implying lower precipitation. Palyno-logical data from north-central China also suggest a cold, dry period from 3.95 to 4.45 ka BP, which is inferred by a sudden decrease in tree pollen concentration (Reference Xiao, Xu, Nakamura, Yang, Liang and InouchiXiao and others, 2004). A speleothem d18O record from southern China shows multiple dry periods coinciding with Bond (1.5 ka) events in the North Atlantic (Reference WangWang and others, 2005). Some of these, including the one at 4.2 ka BP, occurred during periods of strong variability in solar activity.
Evidence for the abrupt mid-Holocene dry period in the tropics is visible in (a) the dust concentrations from NIF3, (b) the carbonate abundances in the Gulf of Oman marine core (Reference Cullen, deMenocal, Hemming and HemmingCullen and others, 2000), (c) the lake levels in tropical Africa (Reference Gillespie, Street-Perrott and SwitsurGillespie and others, 1983), and (d) the dust concentrations from Huascarán.
The geographic extent of this drought extends to South America, as seen in several paleoclimate proxy records. For example, stable-isotope analyses of planktonic foraminifera from the Amazon fan show that the highest δ18O values in the Holocene (suggestive of reduced Amazon River flow) occurred ~4.5 ka BP (Reference MaslinMaslin and others, 2000), almost contemporaneously with a depletion of 18O in a core from Lago Junín, Peru (Reference Seltzer, Rodbell and BurnsSeltzer and others, 2000). Evidence for mid-Holocene aridity on the Altiplano comes from Lake Titicaca, on the border between Peru and Bolivia. Here the percent of freshwater plankton reached its lowest levels between 5 and 2 ka BP, and the percent of saline diatoms increased at ~6ka BP (14C age) and reached a maximum at ~3.6–4.0 ka BP (14C age) (Reference BakerBaker and others, 2001). Reference Tapia, Fritz, Baker, Seltzer and DunbarTapia and others (2003) provide a more refined timeline for climate variation in this interval using the Lake Titicaca record of percent saline planktonic taxa, which confirms that although water levels were low between 3 and 6 ka BP, the lowest levels were reached at ~4.5 ka BP.
The Huascarán ice core contains a large dust spike that is dated between 4.0 and 4.5 ka BP (Fig. 11d; Reference Davis and ThompsonDavis and Thompson, 2006). The dust originates from the African west coast where it is entrained by the northeast trade winds during the austral summer (the wet season in the Cordillera Blanca) and is carried, along with moisture, across the tropical North Atlantic and the Amazon Basin. Saharan dust which has been transported during the austral summer has been found in the Amazon Basin (Reference Swap, Garstang, Greco, Talbot and KållbergSwap and others, 1992). The dust deposited on Huascarán during the mid-Holocene was most likely transported in this manner during centuries of extreme aridity both in Africa and South America (Reference Davis and ThompsonDavis and Thompson, 2006). The large dust spike in the Kilimanjaro record, dated ~4.0 ka BP (Fig. 11a), was also the product of this ‘mega-drought’ that may have lasted a few centuries, during which time the NIF, presently the largest ice field on the mountain, dramatically decreased in size (Reference ThompsonThompson and others, 2002).
Conclusions
There is a compelling body of evidence that the longest ice core from the central part of the NIF extends to the early Holocene. Multiple lines of support include (1) 14C dates consistent with the ice-age model results, (2) the appearance of mid-Holocene features confirmed by numerous paleoclimate proxy records throughout the tropics, and (3) a new lake core record covering the last 1.5 ka that supports the Kilimanjaro time series. The ongoing shrinking and thinning of the ice fields on Kibo are placed in a much longer-term perspective by the ice-core derived climate histories. Visual inspection of NIF3 confirms that the current surface melting is unprecedented in the last 11.7 ka. Significant recent melting of the much smaller FWG is documented by the ‘washing out’ of aerosols throughout the ice, and by water saturation of the glacier noted during drilling. By 2009, 86% of the surface area of the ice that covered the mountain in 1912 had been lost, and 27% of the areal coverage present in 2000 disappeared in the following decade (Reference Thompson, Mosley-Thompson, Davis and BrecherThompson and others, 2011). Not only is the rapid ice loss on Kilimanjaro consistent with widespread glacier retreat in the mid- to low latitudes, but the (anticipated) loss of the entire NIF will be unprecedented within the past 10 000 years (the Holocene).
Acknowledgements
We thank all the field and laboratory team members from the Byrd Polar Research Center and our colleagues from other institutions who have worked so diligently over the years on the Kilimanjaro Program. Funding has been provided by the US National Science Foundation’s Paleoclimate Program Award ATM-0502476 and ATM-08235863 and The Ohio State University’s Climate, Water and Carbon Program. This is Byrd Polar Research Center contribution No. 1404.


