

The American Heart Association (AHA) and individual scientists advise consumption of at least 5–10 % of energy as n-6 PUFA to reduce CHD risk(Reference Harris, Mozaffarian and Rimm1–Reference Kris-Etherton, Fleming and Harris5). They note that randomised controlled trials (RCT) of CHD outcomes are considered to be the ‘gold-standard’(Reference Kris-Etherton, Fleming and Harris5) for guiding clinical practice decisions. Individual RCT, and two meta-analyses combining seven RCT(Reference Gordon and Rifkin6, Reference Mozaffarian, Micha and Wallace7), are cited as providing ‘the most convincing’(Reference Kris-Etherton and Harris4, Reference Kris-Etherton, Fleming and Harris5) and ‘decisive’(Reference Katan8) evidence-base, with ‘immediate implications’(Reference Mozaffarian, Micha and Wallace7) for ‘population and individual level recommendations’(Reference Mozaffarian, Micha and Wallace7) to substitute n-6 PUFA-rich vegetable oils for SFA. However, the conclusions of these meta-analyses have been questioned due to their (1) omission of relevant trials with unfavourable outcomes(Reference Ramsden9, Reference Ramsden, Hibbeln and Lands10); (2) inclusion of trials with weak design and dominant confounders(Reference Ramsden9, Reference Ramsden, Faurot and Carrera-Bastos11); (3) failure to distinguish between trials that selectively increased n-6 PUFA, from trials that substantially increased n-3 PUFA (Fig. 1)(Reference Ramsden9, Reference Ramsden, Hibbeln and Lands10); (4) failure to acknowledge that n-6 and n-3 PUFA replaced large quantities of trans-fatty acids (TFA), in addition to SFA, in several trials(Reference Ramsden9, Reference Ramsden, Faurot and Carrera-Bastos11).
Shift in PUFA terminology from data to advice. A meta-analysis of randomised controlled trials (RCT) that increased PUFA(Reference Gordon and Rifkin6), but did not specify n-6 and n-3 PUFA composition, was cited by the 2009 American Heart Association (AHA) Advisory(Reference Harris, Mozaffarian and Rimm1). A more recent meta-analysis of RCT that similarly increased unspecified PUFA(Reference Mozaffarian, Micha and Wallace7) was considered evidence of the benefits of n-6 PUFA(Reference Katan, Brouwer and Clarke12). Despite substantial increases in n-3 PUFA, these interventions were considered to be ‘almost entirely n-6 PUFA’. The AHA advisory specifically recommended the consumption of ‘at least 5–10 % of energy as n-6 PUFA’.

Since these meta-analyses(Reference Gordon and Rifkin6, Reference Mozaffarian, Micha and Wallace7), reviews(Reference Harris, Mozaffarian and Rimm1–Reference Czernichow, Thomas and Bruckert3) and editorials(Reference Kris-Etherton and Harris4, Reference Kris-Etherton, Fleming and Harris5, Reference Katan8, Reference Katan, Brouwer and Clarke12) do not provide the specific n-6 PUFA, n-3 PUFA or TFA compositions of the study diets, or the detailed methodologies of the individual trials, an in-depth examination of each trial is warranted. Here we sought to (1) critically examine the methodology and nutrient content of all dietary trials that increased PUFA at the expense of other fatty acids and reported non-fatal myocardial infarction (MI), CHD deaths and/or total deaths; (2) determine if experimental conditions increased n-6 PUFA specifically, or increased both n-3 and n-6 PUFA (i.e. mixed n-3/n-6 PUFA diets); (3) compare the effects of mixed n-3/n-6 PUFA diets to the effects of n-6 specific PUFA diets on clinical outcomes; (4) examine the potential confounding role of TFA in these trials.
Experimental methods
Literature search and review of public records
We first identified all manuscripts cited in the two previous meta-analyses of dietary PUFA and CHD risk(Reference Gordon and Rifkin6, Reference Mozaffarian, Micha and Wallace7), and the methodology publications from these trials (Fig. 2). We then entered relevant search terms into Medline and ISI Web of Science (e.g. polyunsaturates, PUFA, linoleic acid, omega-6, cholesterol-lowering, randomized controlled trial, dietary intervention, myocardial infarction, coronary heart disease, CHD, cardiac death, sudden death, mortality, death). We expanded the search to include all publications of every author on the individual RCT reports cited in the previous meta-analyses. When detailed dietary and outcome data were not available in the published literature archive, we examined public records, including research grant applications and grant reviews, research protocols, study progress reports, study brochures, scientific proceedings from national conferences, library special collections, written correspondence between study investigators, colleagues and grant reviewers, newspaper archives and Minnesota state mental hospital records to find missing data and identify the specific study oils used in each RCT. Study authors/investigators (or colleagues of deceased investigators) were also contacted via telephone and e-mail to request missing data and to verify our findings.
Experimental methods. RCT, randomised controlled trials.

Criteria for inclusion and exclusion
The datasets were included if PUFA were increased in place of SFA and/or TFA and non-fatal MI, CHD deaths and/or total deaths were reported. Datasets were excluded if (1) individual participants were not randomly assigned to the experimental diet or a control diet; (2) disproportionate CHD risk factors (e.g. smoking, pre-existing CHD, cardiotoxic medication use) were reported in different study arms; or (3) the dietary information necessary to classify experimental diets as either ‘n-6 specific PUFA’ or ‘mixed n-3/n-6 PUFA’ was not available.
Nine trials were identified (Table 1), including one that was not included in either of two previous meta-analyses. Two trials separated men and women, for a total of eleven datasets. Two trials were excluded: The Finnish Mental Hospital Study (two datasets)(Reference Turpeinen13–Reference Miettinen, Turpeinen and Karvonen17) and the Diet and Reinfarction Trial (DART)(Reference Burr, Fehily and Gilbert18–Reference Burr21). The remaining seven RCT (eight datasets) were included in the main analyses.
General characteristics of dietary intervention trials that substituted PUFA for saturated and trans-fatty acids
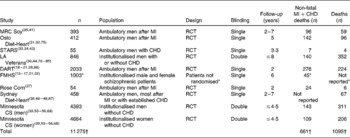
MI, myocardial infarction; MRC, Medical Research Council; RCT, randomised controlled trial; STARS, St Thomas Atherosclerosis Regression Study; LA, linoleic acid; DART, Diet and Reinfarction Trial; CS, Coronary Survey; FMHS, Finnish Mental Hospital Study; EKG, electrocardiogram.
In the FMHS, the individual patients were not randomised and patient populations were ‘rejuvenated’ at reversal of the diets(Reference Miettinen, Turpeinen and Karvonen17) in this crossover study.
* (1) The mean number of study participants; (2) that ‘intermediate EKG changes’ were not included in calculating non-fatal MI+CHD death; and (3) total deaths for patients within the specified age ranges were not reported(Reference Miettinen, Turpeinen and Karvonen16, Reference Miettinen, Turpeinen and Karvonen17, Reference Turpeinen, Karvonen and Pekkarinen22).
† Does not include participants from excluded studies (DART or FMHS).
Exclusion of the Finnish Mental Hospital Study
The Finnish Mental Hospital Study was excluded because patients were assigned by hospital and not randomised as individual patients. Consequently, the cardiotoxic medication thioridazine was used disproportionately in one study arm, and TFA consumption differed markedly in the two control groups. The Finnish Mental Hospital Study was a 12-year crossover study that randomised two hospitals (Hosp N and Hosp K) of mostly schizophrenic patients (77 % in Hosp K and 69 % in Hosp N) to either a high-PUFA, ‘serum cholesterol-lowering’ diet (Hosp N) or their hospital's typical control diet (Hosp K) for 6 years. After this initial 6-year phase, the diets were switched so that Hosp N patients received the Hosp N control diet and Hosp K patients received the high-PUFA diet. This unusual design was also confounded because patient populations were ‘rejuvenated by discarding the six oldest annual cohorts and admitting six new annual cohorts on the younger end of the age range’ at this reversal of diets in 1965(Reference Turpeinen, Karvonen and Pekkarinen22).
This combination of inappropriate randomisation and the crossover design allowed dominant confounders to enter into the study. Critically the cardiotoxic antipsychotic medication thioridazine was used disproportionately in one study arm. Hosp N control patients received an average of 1·79 (100 mg) doses of thioridazine per d, more than twice as much as patients in the other three study arms. Thioridazine is significantly associated with risk of sudden death (adjusted OR = 5·3; 95 % CI 1·7, 16·2; P = 0·004), ‘the likely mechanism being drug-induced arrythmia’(Reference Reilly, Ayis and Ferrier23). Thioridazine also causes T-wave distortions(Reference Thornton and Wendkos24), QRS changes, ST elevations and other electrocardiogram changes both with therapeutic administration and overdoses(Reference Rouleau, Asfar and Boulet25). These electrocardiogram changes and clinical presentations overlap with those seen in MI and sudden cardiac death and may have been counted as CHD events. Furthermore, patients in all four study arms were taking tricyclic antidepressants (0·42 doses per d in Hosp N controls). Concurrent use of phenothiazines (especially thioridazine) and tricyclic antidepressants can lead to cardiac arrythmias, electrocardiogram changes and sudden death, even in young adults without heart disease on therapeutic doses(Reference Lipscomb26). Thioridazine also has the most severe metabolic effects among typical antipsychotics, inducing an average weight gain of 7 lbs (3·2 kg) in a 10-week study(Reference Allison, Mentore and Heo27). Therefore, over the 6-year phase, the control subjects were at substantially greater risk of thioridazine-induced weight gain, insulin resistance, electrocardiogram changes and sudden cardiac death.
Marked differences in TFA consumption between the two control groups, and between the control and experimental groups, were also identified as a significant confounding factor. Hospital K controls consumed more than three times as much TFA as Hosp N controls, and about nine times as much as either experimental group (Table 2).
Common margarine use in the four arms of the Finnish Mental Hospital Study (men)
en %, percentage of daily energy; Hosp N, hospital N; Hosp K, hospital K.
* Estimated trans-fatty acids from hard margarines as percentage of daily energy.
† Hosp K controls consumed an average of 18 g/d of common ‘hard’ margarine, including 24 and 26 g/d in 1959 and 1960, respectively. Hard margarines were replaced with soybean oil and a ‘specially prepared polyunsaturated’ soft margarine(Reference Turpeinen14).
‡ In a recent pooled analysis of prospective cohort studies, each 2 en % replacement of trans-fatty acids with SFA, MUFA or PUFA was associated with a 21–32 % reduction in CHD risk(Reference Mozaffarian, Aro and Willett66, Reference Mozaffarian and Clarke88), see Discussion section.
Exclusion of the Diet and Reinfarction Trial
DART was excluded from the main analyses because data on the specific n-6 and n-3 PUFA composition of DART study diets were unavailable from publications(Reference Burr, Fehily and Gilbert18–Reference Fehily, Vaughan-Williams and Shiels20) and personal communications (M. L. Burr, 2010). The experimental ‘fat advice’ group received only generic advice to use polyunsaturated oils for cooking, without recommending or providing any specific oil, and increased total PUFA intake by only 2·8 en % (from 6·9 to 9·7 en %(Reference Fehily, Vaughan-Williams and Shiels28)). Because oils with substantial amounts of α-linolenic acid (ALA) were available in Britain during the trial(29), it is likely, but not definite, that the ‘fat advice’ group increased both n-3 ALA and n-6 linoleic acid (LA), albeit modestly. DART was considered provisionally as a mixed n-3/n-6 PUFA RCT in an exploratory sensitivity analysis to determine if inclusion would substantially alter the present results.
Extraction and classification
We extracted the number of participants in the experimental and control groups with and without the following outcomes: non-fatal MI, CHD death, combined non-fatal MI+CHD death and death from all causes. We extracted food and nutrient composition data for experimental and control diets. Diet extraction data included the specific study oils and fatty acid composition of experimental diets. Quantitative fatty acid data were expressed as g/d and percentage of daily energy (en %), as follows (see Appendix 1 for calculations of specific fatty acids in RCT):

Interventions were classified as either ‘mixed n-3/n-6 PUFA’ (i.e. n-3 and n-6 PUFA) or ‘n-6 specific PUFA’ diets on the basis of quantitative dietary fatty acid data and/or the specific study oils that were provided to experimental dieters (Tables 3 and 4).
Characteristics of control and experimental diets used in different studies*

LA, linoleic acid (18 : 2n-6); ALA, α-linolenic acid (18 : 3n-3); EPA (20 : 5n-3); DHA (22 : 6n-3); TFA, trans-fatty acids; MRC, Medical Research Council; U, unspecified; CS, Coronary Survey; STARS, St Thomas Atherosclerosis Regression Study; DART, Diet and Reinfarction Trial; FMHS, Finnish Mental Hospital Study; SDHS, Sydney Diet-Heart Study; OECD, Organisation for Economic Cooperation and Development.
* From references(Reference Turpeinen13–Reference Turpeinen, Karvonen and Pekkarinen22, Reference Fehily, Vaughan-Williams and Shiels28, 29, Reference Leren31–Reference Watts, Jackson and Burke34, Reference Hiscock, Dayton and Pearce36–Reference Woodhill and Bernstein47, Reference Fisher49, Reference Brewer, Ashman and Kuba52–Reference Frantz56, Reference Frantz, Dawson and Kuba68, Reference Dayton, Hashimoto and Dixon77–Reference Pearce and Dayton85, Reference Woodhill, Leelarthaepin and Blacket87, 89–Reference Greaves and Hollingsworth91). See Appendix 1 for the methods used to calculate n-6 PUFA, n-3 PUFA and TFA, and applicable references.
† Data are expressed as a precentage of energy, as detailed in Appendix 1.
‡ Major sources of TFA (e.g. common ‘hard’ margarines and shortenings) were replaced with non-hydrogenated oils and ‘soft’ polyunsaturated margarines.
§ TFA estimated from UK National Food Survey data(89) for household margarine use (does not include shortenings, fried foods, baked goods).
∥ Controls consumed 65 g/d of partially hydrogenated fish and vegetable oil margarines, which were ‘entirely restricted’ for experimental dieters.
¶ Mostly corn and soybean (some safflower and cottonseed).
** TFA estimated from US economic disappearance data for margarines and shortenings.
†† Excluded because n-6 and n-3 PUFA data are unavailable. Total PUFA increased by 2·8 en % from 6·9 to 9·7 en %.
‡‡ Excluded because individual patients were not randomised, the cardiotoxic medication thioridazine was used disproportionately in one study arm, and TFA intakes differed markedly in the two control groups.
§§ Corn oil supplied an additional 14·9 en % as n-6 LA. Total LA intake was unspecified.
¶¶ SDHS TFA estimated from OECD Food Consumption Statistics 1954–1985 for the apparent consumption of margarine (does not include shortenings, fried foods, baked goods).
Fatty acid composition of ‘n-6 specific PUFA’, ‘mixed’ and ‘n-3 specific PUFA’ oils used in randomised controlled trials*
LA, linoleic acid; ALA, α-linolenic acid; tbsp, table spoon.
* Fatty acid composition values from United States Department of Agriculture National Nutrient Database for Standard Reference, Release 22. Nutrient Databank Identifier numbers (NDB) are as follows: Safflower, 04 510; Corn, 04 510; Soybean, 04 669; Cod liver, 04 589.
† Data are expressed in g/100 g
‡ Based on a predictive model for lowering serum cholesterol developed by Ancel Keys and University of Minnesota collaborators, using data from Hastings and Faribault Mental Hospitals and the National Diet Heart Study.
§ Safflower oil has the most potent cholesterol-lowering effect of any vegetable or seed oil.
∥ Corn oil, which is rich in phytosterols that enhance its cholesterol-lowering effect(Reference Ostlund, Racette and Okeke92), is the second most potent cholesterol-lowering oil.
Statistical methods
Meta-analyses were performed for the mixed and n-6 specific PUFA RCT datasets with the calculated relative risks and 95 % CI and P-values for each of the following outcomes: (1) non-fatal MI; (2) CHD death; (3) non-fatal MI+CHD death and (4) death from all causes. The primary outcome was non-fatal MI+CHD death. Fixed and random effects models were applied to each classification set. Random effects models are reported in the text unless otherwise specified. A test of heterogeneity was performed to determine whether the effects of the mixed n-3/n-6 PUFA and n-6 specific PUFA datasets should be evaluated separately. Potential for publication bias was assessed by visual inspection of a funnel plot of the treatment effect v. standard error and was also quantified using the Begg and Mazumdar adjusted rank correlation test. All statistical analyses were performed with the Comprehensive Meta-analysis version 2(Reference Borenstein, Hedges and Higgins30).
Nutrient composition of the experimental and control diets
n-3 PUFA were substantially increased in four of eight datasets (Table 3) summarised as follows. EPA (20 : 5n-3) and DHA (22 : 6n-3) were substantially increased in two of eight datasets(Reference Leren31–Reference Watts, Jackson and Burke34). ALA (18 : 3n-3) was substantially increased in three of eight datasets(Reference Leren32, 35, Reference Hiscock, Dayton and Pearce36). LA (18 : 2n-6) was raised in isolation, without concurrent increase in ALA or EPA+DHA, in four of the eight datasets(Reference Rose, Thomson and Williams37–Reference Frantz, Dawson and Ashman39). Non-hydrogenated study oils were substituted for TFA-containing fats, oils and foods (e.g. common hard margarines, shortenings, pastries, fried foods) in each of the eight included datasets(Reference Leren32, Reference Watts, Jackson and Burke34–40) and both excluded trials(Reference Turpeinen, Karvonen and Pekkarinen22, Reference Fehily, Vaughan-Williams and Shiels28) (Table 3 and Appendix 1).
Mixed n-3/n-6 PUFA randomised controlled trials
Experimental dietary conditions increased both n-3 and n-6 PUFA in four RCT, providing four ‘mixed n-3/n-6 PUFA’ datasets with a total of 1,706 participants (Table 3). In the Oslo Diet-Heart Study (ODHS), experimental diets provided 2·7 en % as ALA from soybean oil and about 5 g of EPA+DHA per d (2 en %)(Reference Leren32) (Appendix 1). In the Medical Research Council Soy (MRC Soy) trial(35, Reference Clarke, Hedley and Marr41), the soybean oil supplied to experimental dieters provided 2·3 en % as ALA, approximately four times the present average US ALA intake of 0·6 en %(42). The experimental group in St Thomas Atherosclerosis Regression Study (STARS) doubled their daily intake of EPA+DHA from 200 mg (0·10 en %) to 400 mg (0·21 en %)(Reference Watts, Jackson and Mandalia43). In the LA Veterans Study, experimental study oils were ‘mostly corn and soybean’(Reference Hiscock, Dayton and Pearce36). This soybean oil increased absolute consumption of ALA from only trace amounts ( < 0·1 en %) to about 0·7 en %(Reference Hiscock, Dayton and Pearce36, Reference Dayton, Pearce and Hashimoto44), slightly higher than current average US intake.
n-6 specific PUFA randomised controlled trials
Experimental dietary conditions specifically increased n-6 PUFA, without a concurrent increase in n-3 PUFA in three RCT and four datasets with 9,569 participants (Table 3), as described below.
The Sydney Diet-Heart Study
The ‘Group F’ experimental dieters in the Sydney Diet-Heart Study (SDHS) received safflower oil and ‘Miracle’ brand safflower oil polyunsaturated margarine (Marrickville Margarine Private Limited, Marrickville, NSW, Australia)(Reference Woodhill, Palmer and Leelarthaepin38, 45–Reference Fisher49). Safflower oil margarine was used in place of butter and hard margarines, and liquid safflower oil was taken by spoon and used for frying, potato chips and salad dressing(Reference Woodhill, Palmer and Blacket46–Reference Blacket, Woodhill and Mishkel48). Safflower oil and Miracle margarine use was acknowledged in publications(Reference Woodhill, Palmer and Leelarthaepin38, Reference Woodhill, Palmer and Blacket46–Reference Blacket, Woodhill and Mishkel48, Reference Palmer, Woodhill and Blacket50). Miracle margarine was identified as safflower oil polyunsaturated margarine via advertisements in the Sydney Morning Herald(45) and a summary of Australian margarine quotas(Reference Fisher49). The provision of safflower oil and safflower margarine was confirmed via personal communication with an SDHS investigator (B. Leelarthaepin, 2010). Safflower oil was selected as ‘the most suitable food to add to the diet’(Reference Woodhill and Bernstein47) because it contains the highest total PUFA content of any oil, approximately 75 g per 100 g serving, exclusively as LA (Table 4). Safflower oil had previously been shown to have the most potent cholesterol-lowering effect of any vegetable or seed oil(Reference Fetcher, Foster and Anderson51), which was attributed to its high LA content.
Rose Corn Oil Trial
The experimental dietary group in the Rose Corn Oil Trial (RCOT) consumed an average of 64 g of corn oil per d, which provided 14·9 en % as LA(Reference Rose, Thomson and Williams37) (Table 3). Corn oil was substituted for typical fat sources and taken as a supplement with meals.
Minnesota Coronary Survey
The experimental cholesterol-lowering diets provided to Minnesota State Mental Hospital patients in the Minnesota Coronary Survey (MCS) were derived from the ‘BC’ diet of the institutional arm of the National Diet-Heart Feasibility Study at Faribault State Mental Hospital (Principal Investigator: Ivan D. Frantz Jr MD, University of Minnesota)(Reference Frantz, Dawson and Ashman39, 40, Reference Brewer, Ashman and Kuba52–Reference Frantz55). The n-6 PUFA LA accounted for 99 % of total PUFA in these institutional BC diets(40, Reference Frantz54–Reference Frantz56), with corn oil identified as the main source of PUFA. Liquid corn oil and corn oil polyunsaturated margarine were confirmed as the PUFA sources in the MCS via the R01 research grant application and supplementary progress reports(40, Reference Frantz54–Reference Frantz56). Dr Frantz and his collaborators concurrently selected safflower oil, the most efficacious cholesterol-lowering oil(Reference Fetcher, Foster and Anderson51), alongside corn oil in the free-living Twin Cities arm of the National Diet-Heart Feasibility Study(57), and for other human experiments at Minnesota State mental hospitals(Reference Frantz58, Reference Frantz59) and the University of Minnesota(Reference Moore, Anderson and Taylor60). Like corn oil, the nutrient composition of safflower oil (Table 4) is consistent with the fatty acid compositions reported for the institutional BC diets (LA = 99 % of total PUFA)(40, Reference Frantz55). Therefore, safflower oil may have also been utilised to some extent in the MCS.
Results
Meta-analyses of mixed n-6/n-3 PUFA randomised controlled trials
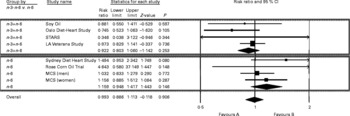
Among the four datasets using mixed n-3/n-6 PUFA diets, the pooled risk reduction for non-fatal MI+CHD death was 22 % (risk ratio (RR) 0·78; 95 % CI 0·65, 0·93; P = 0·005) (Table 5 and Fig. 3). The pooled risk reductions were 27 % for non-fatal MI (RR 0·73; 95 % CI 0·54, 0·99; P = 0·04), 19 % for CHD death (RR 0·81; 95 % CI 0·64, 1·03; P = 0·08) and 8 % for death from all causes (RR 0·92; 95 % CI 0·80, 1·06; P = 0·25). RR and 95 % CI were similar for all outcomes whether we used fixed effects or random effects models (Table 5).
(Risk ratios and 95 % confidence intervals)

MI, myocardial infarction; RR, risk ratio; NA, not applicable; CS, Coronary Survey; MRC, Medical Research Council; STARS, St Thomas Atherosclerosis Regression Study; LA, linoleic acid.
RR and 95 % CI values were significantly different at: *P < 0·05, **P < 0·01.
† Experimental dieters in the Sydney Diet-Heart Study had a 49 % increased risk of death from all causes, and 91 % (sixty-one of sixty-seven) and 96 % (sixty-four of sixty-seven) of deaths were attributed to CHD and CVD, respectively. However, CHD deaths were not reported by group.
Forest plot of non-fatal myocardial infarction (MI)+CHD death. The lower box and ♦ indicate that n-6 specific PUFA trials increased the risk of non-fatal MI+CHD death by 13 % (risk ratio (RR) 1·13; 95 % CI 0·84, 1·53; P = 0·427). These data do not include the Sydney Diet-Heart Study, an n-6 PUFA RCT that found a 49 % increased risk of death from all causes (RR 1·49; 95 % CI 0·95, 2·34; P = 0·08) (Table 5).The upper box and ♦ indicate that mixed n-3/n-6 PUFA trials reduced the risk of non-fatal MI+CHD death by 22 % (RR 0·78; 95 % CI 0·65, 0·93; P = 0·005). Overall and accompanying ♦ indicates that the combination of n-6 specific PUFA and mixed n-3/n-6 PUFA diets reduced the risk of non-fatal MI+CHD death by 15 % (RR 0·85; 95 % CI 0·73, 0·99; P = 0·04). n-3+n-6, mixed n-3/n-6 PUFA studies; n-6, n-6 specific PUFA studies; overall, all included PUFA trials; Soy Oil, Medical Research Council Soy trial; STARS, St Thomas Atherosclerosis Regression Study; MCS, Minnesota Coronary Survey.

Meta-analyses of n-6 specific PUFA randomised controlled trials
Combining the three datasets for n-6 specific PUFA diets with available endpoints, the pooled risk for non-fatal MI+CHD increased by 13 % (RR 1·13; 95 % CI 0·84, 1·53; P = 0·43). Considering the mixed n-3/n-6 and the n-6 specific PUFA diets separately, their effects on non-fatal MI+CHD death were significantly different (Q-statistic = 5·44, df = 1; P = 0·02) (Table 6).
n-6 specific PUFA diets increase risks of CHD and death in comparison to mixed n-3/n-6 PUFA diets in heterogeneity analyses
MI, myocardial infarction; SDHS, Sydney Diet-Heart Study; Q bet, between-groups heterogeneity statistic.
* Heterogeneity between groups with a P < 0·05 indicating significance.
† The SDHS. Ninety-one percent of total deaths in combined SDHS groups were attributed to CHD. Modelling the assumption that 91 % of deaths in each group were CHD deaths, the pooled effects of n-6 specific PUFA and mixed n-3/n-6 PUFA diets on CHD deaths are significantly different (P = 0·015).
Among the three datasets for n-6 specific PUFA diets with published endpoints, the pooled risk for CHD death increased by 17 % (RR 1·17; 95 % CI 0·82, 1·68; P = 0·38). The effects of the mixed n-3/n-6 and the n-6 specific PUFA diets on CHD deaths are borderline significantly different (Q-statistic = 2·88, df = 1; P = 0·09). In the SDHS, the experimental dieters had a 49 % increased risk of death from all causes (RR 1·49; 95 % CI 0·95, 2·34; P = 0·08) (Table 5)(Reference Woodhill, Palmer and Leelarthaepin38), and 91 % (sixty-one of sixty-seven) of total deaths in both groups combined were attributed to CHD. Unfortunately, CHD deaths were not reported by group. In a secondary analysis modelling an assumption that the same percentage of total deaths (91 %) were CHD deaths in each group, the pooled risk of CHD death in four n-6 specific PUFA datasets was increased by 28 % (RR 1·28; 95 % CI 0·96, 1·71; P = 0·09), and the effects of the mixed n-3/n-6 and the n-6 specific PUFA diets on CHD deaths were significantly different (Q-statistic = 5·87, df = 1; P = 0·015) (Table 6).
All four n-6 specific PUFA RCT datasets reported total deaths. Combining these four datasets, there was a non-significant trend towards increased risk of death from all causes (RR 1·16; 95 % CI 0·95, 1·42; P = 0·15 (random effects); RR 1·13; 95 % CI 0·97, 1·32; P = 0·12 (fixed effects)) (Table 5 and Fig. 4). The effects of the mixed n-3/n-6 and n-6 specific PUFA diets on risk of death from all causes were borderline significantly different (Q-statistic = 3·68, df = 1; P = 0·055). In pooled analyses, n-6 specific PUFA diets increased the risks of all relevant CHD outcomes, with or without the SDHS included (Table 5). Without the SDHS included, the pooled effects of the mixed n-3/n-6 and n-6 specific PUFA diets on risks of all CHD outcomes were different at ranges of P = 0·02–0·13; with the SDHS included the effects were different at ranges of P = 0·015–0·055 (Table 6).
Forest plot of total deaths from all causes. The lower box and ♦ indicate that n-6 specific PUFA diets increased the risk of death from all causes by 16 % (risk ratio (RR) 1·16; 95 % CI 0·95, 1·42; P = 0·15). The upper box and ♦ indicate that mixed n-3/n-6 PUFA diets reduced the risk of death from all causes by 8 % (RR 0·92; 95 % CI 0·80, 1·06; P = 0·25). Overall and accompanying ♦ indicate that the combination of all n-6 specific PUFA and mixed n-3/n-6 PUFA diets had no effect on the risk of death from all causes (RR 0·99; 95 % CI 0·89, 1·11; P = 0·91). n-3+n-6, mixed n-3/n-6 PUFA trials; n-6, n-6 specific PUFA trials; overall, all included PUFA trials; Soy Oil, Medical Research Council Soy trial; STARS, St Thomas Atherosclerosis Regression Study; MCS, Minnesota Coronary Survey; LA, linoleic acid; favours A, reduced risk; favours B, increased risk.
Evaluation for publication bias
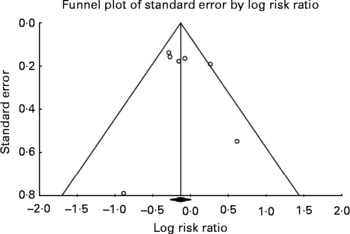
Visual inspection of the funnel plot, an indicator of publication bias, for non-fatal MI+CHD death (seven datasets) shows a fairly symmetric distribution (Fig. 5), with Begg's test being non-significant (τ = 0·38; P = 0·23), although this should be interpreted with caution when a small number of studies are examined(Reference Begg and Mazumdar61).
Evaluation of publication bias for non-fatal MI+CHD death. Visual inspection of the funnel plot for non-fatal MI and CHD death shows a fairly symmetric distribution indicating a low probability of publication bias. Begg's test was non-significant (τ = 0·38; P = 0·23).
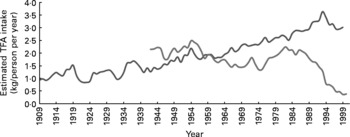
Estimation of trans-fatty acid (TFA) consumption in the US and UK control groups. Consumption of TFA in control groups for the US trials was estimated from the historical food commodities disappearance data for margarines and shortenings obtained from the Economic Research Service of the United States Department of Agriculture as per Center for Nutrition Policy and Promotion guidelines (Appendix 1). Consumption of TFA in control groups for the UK trials was estimated from UK National Food Survey data for per capita household margarine use as described in Appendix 1. The UK figures probably underestimate total TFA intake because they do not include data from shortenings, baked goods or fried foods. ![]() , TFA from margarines and shortenings, USA 1909–99;
, TFA from margarines and shortenings, USA 1909–99; ![]() ,TFA from margarines, UK 1942–2000.
,TFA from margarines, UK 1942–2000.
Sensitivity analyses
The pooled results for non-fatal MI+CHD death were not substantially altered in post hoc secondary analyses based on specific RCT characteristics. For example, excluding one small dataset with mixed n-3/n-6 PUFA diets that increased total PUFA intake by only 1·6 en % in the experimental diet (STARS)(Reference Watts, Lewis and Brunt33, Reference Watts, Jackson and Burke34), the pooled risk reduction remained 22 % (RR 0·78; 95 % CI 0·66, 0·93; P = 0·006). Including one dataset (DART)(Reference Burr, Fehily and Gilbert18) that increased total PUFA by only 2·8 en %(Reference Fehily, Vaughan-Williams and Shiels28), provided non-specific advice to increase ‘PUFA’ and lacked sufficient dietary information to evaluate the specific n-6 and n-3 PUFA composition of the experimental diet as a mixed n-3/n-6 PUFA study, the pooled risk reduction was 17 % (RR 0·83; 95 % CI 0·72, 0·95; P = 0·007). Including DART, but excluding STARS, the pooled risk reduction for mixed n-3/n-6 PUFA diets was 17 % (RR 0·83; 95 % CI 0·73, 0·96; P = 0·009).
Discussion
This analysis of RCT showed that mixed n-3/n-6 PUFA and n-6 specific PUFA diets have significantly different effects on CHD risk. In pooled analyses, mixed n-3/n-6 PUFA RCT significantly reduced the risks of non-fatal MI by 27 % and non-fatal MI+CHD death by 22 %. By contrast, n-6 specific PUFA diets increased risk of all CHD endpoints, with the increased risk of death from all causes approaching statistical significance (Table 5). Tests of heterogeneity showed that the n-6 specific PUFA diets and the mixed n-3/n-6 PUFA diets had statistically different effects on risk for non-fatal MI+CHD death (P = 0·02), and a borderline significant difference for total deaths (P = 0·055). Our findings highlight the importance of making a clear distinction between n-6 and n-3 PUFA, and question the conclusions of previous meta-analyses and public health advisories that imprecisely grouped n-6 and n-3 PUFA together as ‘PUFA’, ‘PUFA (almost entirely n-6 PUFA)’ or ‘n-6 PUFA’.
‘PUFA’ v. ‘PUFA (almost entirely n-6 PUFA)’ v. ‘n-6 PUFA’
Two previous meta-analyses(Reference Gordon and Rifkin6, Reference Mozaffarian, Micha and Wallace7) have recently been cited to support the proposition that PUFA in general, and n-6 PUFA in particular, are cardioprotective(Reference Harris, Mozaffarian and Rimm1–Reference Kris-Etherton, Fleming and Harris5, Reference Katan8, Reference Katan, Brouwer and Clarke12). In a pooled analysis of seven dietary intervention trials that increased ‘polyunsaturated fat in place of saturated fat’, Mozaffarian et al. (Reference Mozaffarian, Micha and Wallace7) found a modest CHD risk reduction of about 10 % per 5 en % increase in ‘PUFA’ consumption. Mozaffarian et al. (Reference Mozaffarian, Micha and Wallace7) concluded that their findings have ‘immediate implications’ for ‘population and individual level recommendations’ and that the current WHO recommended upper limit of 10 en % as non-specific PUFA(62) may need to be revisited. The AHA Science Advisory committee alternatively used the non-specific terms ‘PUFA’ and ‘PUFA (almost entirely n-6 PUFA)’ when referring to both individual RCT and a pooled analysis of six RCT cited in the body of the text(Reference Harris, Mozaffarian and Rimm1, Reference Kris-Etherton, Fleming and Harris5, Reference Gordon and Rifkin6) (Fig. 1). However, the advisory used the more specific term ‘n-6 PUFA’ in concluding that ‘at least 5–10 % of energy from n-6 PUFA reduces the risk of CHD relative to lower intakes’.
The Oslo Diet-Heart Study as an ‘n-6 PUFA’ Trial
The ODHS, which was included and heavily weighted in both previously discussed meta-analyses, illustrates the critical importance of distinguishing between n-6 specific PUFA diets and mixed n-3/n-6 PUFA diets. In Leren's(Reference Leren32) detailed publication of study methods, he reported numerous potential confounders (Table 7). First, experimental dieters were instructed to substitute fish, shellfish and ‘whale beef’ for meats and eggs, and were actually supplied with ‘considerable quantities of Norwegian sardines canned in cod liver oil, which proved to be popular as a bread spread’(Reference Leren32). These cold-water fish, sardines, cod liver oil, shellfish and whale provided an estimated 2·0 en % (about 5 g/d) of EPA and DHA (Appendix 1). For context, this is equivalent to more than sixteen typical fish oil pills (1 g pill = 300 mg EPA+DHA) per d. Thus, the experimental group in the ODHS consumed about five times as much EPA+DHA as the Gruppo Italiano per lo Studio della Sopravvivenza nell'Infarto Miocardico Trial, which was found to reduce sudden deaths by 45 % and total deaths by 20 %(63). Second, the experimental group consumed massive amounts of soybean oil, which provided large quantities of both LA (15·6 en %) and ALA (2·7 en %). ALA consumption was about 4·5 times average US intake(42), or about twelve typical flax oil pills (1 g pill = 560 mg ALA) per d. In addition, the fish and cod liver oil consumption provided Oslo (59°N latitude) dieters with 610 IU (15·25 μg) of daily vitamin D3, recently linked to lower blood pressure, plaque stabilisation, and reduced CHD events(Reference Zittermann and Koerfer64). Furthermore, experimental dieters were encouraged to eat more nuts, fruits, and vegetables; to limit animal fats; and to restrict their intake of refined grains and sugar. Finally, in the two decades before the ODHS, Oslo males had an alarming 7-fold increased incidence of first MI (from 9·0 per 10 000 in 1945 to 64·9 per 10 000 in 1961)(Reference Leren32). This rapid rise coincided with pervasive use of partially hydrogenated fish and vegetable oil margarines, accounting for 65 g/person per d (25 en % as partially hydrogenated oils, approximately10 en % as TFA) at study onset(Reference Leren32) (Appendix 1). These margarines provided the control group an estimated 6·9 g (2·6 en %) of unusual 20 and 22 carbon TFA produced from the partial hydrogenation of fish oil(Reference Cantwell, Flynn and Gibney65). Importantly, margarines were ‘entirely restricted’ and replaced with non-hydrogenated soybean and cod liver oils in the experimental group, whereas the control group continued consumption. The ODHS was clearly a multiple intervention trial with a profound reduction in TFA, and very large increases in ALA, EPA and DHA intakes, rather than simply an ‘n-6 PUFA’ trial. Given the numerous established and suspected cardioprotective modifications, and the atherogenic control diet, major and highly significant reductions in non-fatal MI and total death would be expected at 5 years of follow-up. Therefore, when put into appropriate context, the modest ODHS benefits (Table 5) do not support the proposition that ‘n-6 PUFA’ are cardioprotective and may in fact suggest the opposite.
The Oslo Diet Heart Study (ODHS): a mixed n-3/n-6 PUFA trial
LA, linoleic acid; ALA, α-linolenic acid; TFA, trans-fatty acid; en %, percentage of daily energy; U, unspecified.
*P = 0·11, **P = 0·04.
† The experimental group in the ODHS was provided with Norwegian sardines canned in cod liver oil, and instructed to substitute finfish, shellfish and whale for eggs and meats. Experimental dieters consumed an estimated 5 g/d (2 en %) of n-3 EPA+DHA (Appendix 1). The experimental group was also supplied with soy oil, which provided 15·6 en % as LA and 2·7 en % as ALA.
‡ Controls consumed a typical Norwegian diet containing about 2·6 en % from n-6 LA (8·75 g of LA/12 552 J (3000 cal).
§ TFA were ‘entirely restricted’ in the experimental group (no margarines). In comparison, the control group consumed an estimated 9·6 en % as TFA from 45 g/d of partially hydrogenated fish oil margarine and 20 g/d of partially hydrogenated vegetable oil margarine (Appendix 1).
Distinguishing between trans-fatty acids and SFA
Both the AHA Advisory(Reference Harris, Mozaffarian and Rimm1) and the Mozaffarian et al. (Reference Mozaffarian, Micha and Wallace7) meta-analysis of RCT imprecisely contend that they evaluated the effects of replacing SFA with PUFA, despite the inclusion of the ODHS and other RCT where experimental diets displaced large quantities of TFA-rich partially hydrogenated oils. Indeed, experimental diets replaced common ‘hard’ margarines, industrial shortenings and other sources of TFA in all seven of the RCT included in the meta-analysis by Mozaffarian et al. (Reference Mozaffarian, Micha and Wallace7). The mean estimated TFA content of the seven control diets was 3·0 en % (range 1·5–9·6 en %) (Table 3 and Fig. 6). In a recent pooled analysis of prospective cohort observational studies(Reference Mozaffarian, Aro and Willett66), each 2 en % replacement of TFA with SFA, MUFA or PUFA was associated with a CHD risk reduction of 20, 27 and 32 %, respectively. If this association is causal, the replacement of only 2 en % as TFA would be expected to account for the full 19 % reduction in CHD events that Mozaffarian et al. (Reference Mozaffarian, Micha and Wallace7) attributed to increasing unspecified PUFA in their meta-analysis. Unfortunately this potential confounding role of TFA was not appreciated. Similarly, the displacement of TFA, rather than the substitution of mixed n-3/n-6 PUFA for SFA, may account for some or all of the 22 % reduction in non-fatal MI+CHD death in our meta-analysis. By contrast, the increased CHD risks from n-6 specific PUFA diets in our meta-analysis may be underestimated as n-6 PUFA also replaced substantial quantities of TFA (Table 3). The consistent trends towards increased CHD risk of n-6 specific PUFA diets may have become significant if the n-6 PUFA replaced only SFA, instead of a combination of SFA and TFA.
Mixed n-6 and n-3 PUFA randomised controlled trials
All RCT in the Gordon meta-analysis(Reference Gordon and Rifkin6) that was cited by the AHA Advisory(Reference Harris, Mozaffarian and Rimm1) provided mixed PUFA diets containing substantial amounts of both LA and ALA(Reference Miettinen, Turpeinen and Karvonen17, Reference Turpeinen, Karvonen and Pekkarinen22, Reference Leren32, 35, Reference Hiscock, Dayton and Pearce36) and/or EPA+DHA(Reference Leren32, Reference Watts, Jackson and Burke34), except for one, in which experimental dieters actually lowered intake of SFA and total fat without increasing PUFA(67). Similarly, five of the seven RCT included in the Mozaffarian et al. (Reference Mozaffarian, Micha and Wallace7) meta-analysis provided mixed n-3/n-6 PUFA diets with substantial increases in both LA and ALA(Reference Miettinen, Turpeinen and Karvonen17, Reference Turpeinen, Karvonen and Pekkarinen22, Reference Leren32, 35, Reference Hiscock, Dayton and Pearce36) and/or EPA+DHA(Reference Leren32–Reference Watts, Jackson and Burke34), and another did not provide specific PUFA composition data(Reference Burr, Fehily and Gilbert18). The STARS increased LA only modestly (by 1·6 en %)(Reference Watts, Jackson and Burke34) and doubled intake of EPA+DHA. It was included in the Mozaffarian et al. (Reference Mozaffarian, Micha and Wallace7) meta-analysis despite a required pre-intervention ‘trial with cholestyramine to identify those who responded to and were tolerant of the drug’(Reference Watts, Lewis and Brunt33). Responders were then randomised to one of the three study arms: (1) a control group without diet advice or cholestyramine; (2) ‘lipid-lowering’ diet advice without cholestyramine; or (3) lipid-lowering diet advice plus cholestyramine. The RCOT(Reference Rose, Thomson and Williams37) had no pre-intervention trial requirement, increased LA more substantially (by 14·9 en %), but similarly randomised participants to one of the three study arms: (1) a control group without diet advice; (2) an n-6 specific PUFA diet in which corn oil replaced typical fat sources; or (3) a MUFA diet in which olive oil replaced typical fat sources. Although STARS had three study arms and a pre-intervention drug trial, it was included in their meta-analysis(Reference Mozaffarian, Micha and Wallace7) while the RCOT was excluded for containing ‘multiple interventions’, despite also having three study arms. Another n-6 specific PUFA RCT, the SDHS, was excluded because it reported only total death, which was considered a ‘non-CHD endpoint’(Reference Mozaffarian, Micha and Wallace7). However, the vast majority of deaths (91 %) in the SDHS were attributed to CHD(Reference Woodhill, Palmer and Leelarthaepin38). The MCS(Reference Frantz, Dawson and Ashman39) was the only RCT that reported increased CHD risk that was included in the Mozaffarian et al. (Reference Mozaffarian, Micha and Wallace7) meta-analysis. The MCS was also the only n-6 specific PUFA RCT analysed. However, because it was not recognised as an n-6 specific PUFA trial, the different effects of n-6 specific PUFA and mixed n-3/n-6 PUFA RCT were not apparent.
n-6 specific PUFA randomised controlled trials
Experimental dietary conditions specifically increased n-6 PUFA, without a concurrent increase in n-3 PUFA in three RCT and four datasets with 9,569 participants(Reference Rose, Thomson and Williams37–40, Reference Woodhill, Palmer and Blacket46, 57) (Table 3). Specific increases in n-6 PUFA were achieved by providing corn and/or safflower oils, which contain substantial LA and minimal ALA, as shown in Table 4. In the RCOT(Reference Rose, Thomson and Williams37), experimental dieters consuming corn oil had a 4·64-fold increased risk for both CHD death and death from all causes (RR 4·64; 95 % CI 0·58, 37·15; P = 0·15) (Table 5). Rose et al. (Reference Rose, Thomson and Williams37) concluded that ‘corn oil cannot be recommended in the treatment of ischemic heart disease’ because ‘it is most unlikely to be beneficial, and it is possibly harmful’. In the SDHS, the ‘Group F’ experimental dieters, who consumed safflower oil and a safflower oil polyunsaturated margarine, had a 49 % increased risk of death from all causes (RR 1·49; 95 % CI 0·95, 2·34; P = 0·08) (Table 5)(Reference Woodhill, Palmer and Leelarthaepin38). SDHS investigators did not report non-fatal MI or CHD death by group and thus were not included in other meta-analyses of CHD events. However, 91 and 96 % of total deaths in the combined groups were attributed to CHD and CVD, respectively(Reference Woodhill, Palmer and Leelarthaepin38). Failure to publish the full dataset of this negative study probably led to an overestimation of the beneficial effects of cholesterol-lowering ‘PUFA’ diets on non-fatal MI and CHD death, in previous meta-analysis and public health advisories, and an underestimation of potential adverse effects of n-6 specific PUFA in this meta-analysis. To our knowledge, the SDHS was not identified as an n-6 specific PUFA RCT in any prior analysis.
The largest n-6 specific PUFA RCT, the MCS, reported results for 4393 men and 4664 women separately(Reference Frantz, Dawson and Ashman39) (Tables 5 and 8). The unique opportunity to ‘learn about the preventability of coronary heart disease in women’(Reference Frantz54) was considered an important advantage in the MCS. The risk of non-fatal MI+CHD death was significantly increased among women consuming the n-6 specific PUFA diet for 1 year or less (RR 2·15; 95 % CI 1·19, 3·87; P = 0·01)(Reference Frantz, Dawson and Ashman39) (Table 8). Women consuming this n-6 specific PUFA diet for any duration had non-significant trends toward increased risk of non-fatal MI (RR 1·47; 95 % CI 0·90, 2·38; P = 0·12), non-fatal MI+CHD death (RR 1·31; 95 % CI 0·90, 1·90; P = 0·16)(Reference Frantz, Dawson and Ashman39) and any cardiovascular event (non-fatal MI+CHD death+stroke) (RR 1·32; 95 % CI 0·92, 1·90; P = 0·13) (Table 8)(Reference Frantz, Dawson and Kuba68). Although men had more or less equivocal results (Table 5), female experimental dieters had increased risk of all relevant endpoints. Since the MCS is the only valid RCT testing the effects of an n-6 specific PUFA diet in a female cohort, it is notable that there is a signal towards harm rather than benefit.
(Risk ratios and 95 % confidence intervals)
RR, risk ratios.
* The MCS was completed in 1973 but the results were not published until 1989(Reference Frantz, Dawson and Ashman39). However, the outcome data for total CVD risk are available via 1975 AHA Conference Scientific Proceedings(Reference Frantz, Dawson and Kuba68).
Are there risks in lowering n-6 PUFA below 5 en %?
We initially presumed that the current population-wide dietary advice to consume ‘at least 5–10 % of energy as n-6 PUFA’(Reference Harris, Mozaffarian and Rimm1, Reference Kris-Etherton, Fleming and Harris5) was developed from RCT data that assessed clinical CHD outcomes at or below the AHA-specified 5 en % cutoff. However, we could identify only one RCT, the Lyon Diet Heart Study (LDHS)(Reference de Lorgeril, Renaud and Mamelle69–Reference Simopoulos71), that lowered n-6 PUFA below 5 en % and reported CHD outcomes. The LDHS was not selected for inclusion or discussed in the AHA advisory and is not included in our meta-analysis. However, discussion of the LDHS is important in evaluating the potential risks of eating less than 5 en % as LA in the context of other dietary changes. It also provides an important context to judge the ODHS and other high-LA diets.
The LDHS randomly assigned 605 men after an MI to either a ‘Mediterranean diet enriched with α-linolenic acid’ (n 302) group or a control group (n 303) (Table 9). Unlike Oslo control dieters who consumed an atherogenic diet, LDHS controls consumed a prudent diet(Reference de Lorgeril, Salen and Martin72). Most pertinent, the treatment group replaced high-LA oils and spreads with low-LA olive oil, rapeseed oil and rapeseed-based soft margarine. Experimental dieters had a 32 % lower LA intake (3·6 en %) than control dieters (5·3 en %)(Reference de Lorgeril, Renaud and Mamelle69). After follow-up of 27 months, non-fatal MI+CHD death and overall mortality were 73 % (95 % CI 0·12, 0·59; P = 0·001) and 70 % (95 % CI 0·11, 0·82; P = 0·02) lower in the experimental group, a far more impressive CHD risk reduction than any RCT included in the aforementioned meta-analyses. Like the ODHS, the LDHS was a multiple intervention trial. LA was not changed in isolation; its reduction was accompanied by an increase in ALA from 0·3 to 0·8 en % (substantially < 2·7 en % as ALA in the ODHS experimental group) (Tables 7 and 9). Unlike the ODHS, the LDHS experimental and control diets were not confounded by differences in TFA(Reference de Lorgeril, Renaud and Mamelle69). However, experimental LDHS dieters did increase intake of oleic acid, fibre, and antioxidants, and reduce consumption of SFA in this multiple intervention trial(Reference de Lorgeril, Renaud and Mamelle69). Fish consumption was not significantly different (47 v. 40 g/d; P = 0·16)(Reference de Lorgeril, Renaud and Mamelle69). The LDHS does not prove that high LA intakes (>5 en %) have adverse consequences; however, it demonstrates that lowering LA below the AHA-specified 5·0 en % is not harmful and, in the context of a Mediterranean diet, produces profound CHD risk reduction. Given these potential benefits of LA lowering, an RCT specifically comparing the effects of low n-6 LA ( < 2 en %) to high LA (>7 en %) intakes on clinical CHD outcomes is warranted to fill a critical evidence gap. LA can be lowered as a controlled variable by providing either (1) high-oleic safflower or sunflower oil, or (2) the standard high-LA version of the same oil, with otherwise identical background diets.
Characteristics of the Lyon Diet Heart Study (LDHS)*
LA, linoleic acid; en %, percentage of daily energy; ALA, α-linolenic acid; TFA, trans-fatty acids; U, unspecified; NA, not applicable; MI, myocardial infarction; RR, risk ratio.
* The experimental group in the LDHS replaced high-LA oils with low-LA olive and rapeseed oils, and rapeseed-based soft margarine in addition to other dietary changes.
† Fish consumption of mixed species was not significantly different comparing experimental and control groups (47 v. 40 g/d, respectively; P = 0·16).
‡ CHD events (non-fatal MI+CHD death) were reduced by 73 % (RR 0·27; 95 % CI 0·12, 0·59; P = 0·001).
§ Total mortality was reduced by 70 % (RR 0·30; 95 % CI 0·11, 0·82; P = 0·02).
Limitations and strengths
The relatively small number of RCT that have tested the effects of mixed n-3/n-6 PUFA and n-6 specific PUFA diets on CHD outcomes is an important limitation of our analyses, therefore the present results should be interpreted with caution. However, a total of 11,275 participants were included in our analysis; 1,706 in four mixed n-3/n-6 datasets and 9,569 in four n-6 specific datasets. The acquisition of more detailed evidence from RCT has resulted in substantial improvements compared to prior meta-analysis. The extensive nature of our search allowed us to include relevant RCT that were not considered in prior analyses and to provide more detailed justification for the inclusion and exclusion of trials. Because trials with negative outcomes are less likely to be published(Reference Begg and Berlin73), and more likely to have delayed publication(Reference Stern and Simes74), publication bias is a potential limitation in any meta-analysis. However, we included two appropriate n-6 specific PUFA RCT with unfavourable outcomes(Reference Rose, Thomson and Williams37, Reference Woodhill, Palmer and Leelarthaepin38) that were not analysed by Mozaffarian et al. (Reference Mozaffarian, Micha and Wallace7). Another n-6 specific PUFA RCT(Reference Frantz, Dawson and Ashman39, Reference Frantz, Dawson and Kuba68) that we included, but Gordon did not(Reference Gordon and Rifkin6), published their unfavourable results 16 years after study completion. Our extensive search allowed us to identify the specific study oils used in each RCT, and to compile detailed data on the n-6 PUFA, n-3 PUFA and TFA content of the experimental and control diets for each RCT. This essential and previously unappreciated data allowed us to classify experimental dietary interventions as either mixed n-3/n-6 or n-6 specific PUFA diets, which were found to have significantly different effects on CHD outcomes.
Conclusion
This detailed methodological evaluation of RCT found that mixed n-3/n-6 PUFA and n-6 specific PUFA diets have significantly different effects on risk of non-fatal MI+CHD death. RCT that substituted mixed n-3/n-6 PUFA in place of TFA and SFA reduced CHD risk. By contrast, n-6 specific PUFA interventions tended to increase CHD risk. These increased CHD risks from n-6 specific PUFA diets may be underestimated as they replaced TFA and SFA; reductions of these potentially atherogenic fats would be expected to reduce CHD risk. Consistent with this, we found that the substitution of n-6 PUFA for TFA and SFA produced an increased risk of death from all causes that approached statistical significance, when analysed independently or in comparison to mixed n-3/n-6 PUFA diets. Among women, the only valid RCT that specifically increased n-6 PUFA found significant harm in the short term, and a signal toward harm with long-term consumption. Inclusion of the ODHS, which delivered several g of EPA and DHA per d and other mixed n-3/n-6 PUFA trials, and the exclusion of RCT that showed possible harm of n-6 PUFA, introduced significant confounds in the prior meta-analyses. These prior analyses were thus not appropriate for formulating advice specific to n-6 PUFA. Based on this evaluation of the specific effects of n-6 PUFA in RCT, advice to maintain or increase n-6 PUFA should be reconsidered, because there is no indication of benefit, and there is a possibility of harm. A clear distinction should be made between n-6 and n-3 PUFA in future meta-analyses, reviews, editorials and public health advisories.
Acknowledgements
This project was supported by the intramural research programme of the National Institute on Alcohol Abuse and Alcoholism. Its contents are solely the responsibility of the authors and do not necessarily represent the official views of the National Institute on Alcohol Abuse and Alcoholism or National Institutes of Health. We would like to acknowledge the efforts of everyone who helped us find missing data, especially Marcia Zorn (National Library of Medicine), Bradley Kuennen and Matthew Schuler (Iowa State University Library), Rachael Davis (E.G. Miner Medical Library), Vanessa Perez (American Heart Association National Center Library), Gillian Swan (UK Food Standards Agency), and the interlibrary loan departments of the Northwestern Galter Health Sciences Library, the University of North Carolina-Chapel Hill Health Sciences Library and the National Institutes of Health. We thank RCT investigators that provided useful information including Boonseng Leelarthaepin, Michael Burr and Lael Gatewood. We are grateful to Arthur Spector, Bill Lands, Klaus Gawrisch, Artemis Simopoulos and Keturah Faurot for contributing valuable comments on the manuscript before submission. C. E. R. designed the study, performed the review of the literature and public records, located missing data and was the main writer of the manuscript. J. R. H. directed the study and critically revised the manuscript. S. F. M. performed the literature review, located missing data and assisted in writing and revising the manuscript. J. M. D. conducted the statistical analyses and revised the manuscript. The authors declare that they have no conflicts of interest.
Appendix 1: Calculating the n-6 PUFA, n-3 PUFA and trans-fatty acid content of experimental and control diets
The average daily consumption of specified fatty acids and total energy was provided for the experimental and control groups for the majority of the RCT included in our analyses (Table 5). The percentage of energy from specific fatty acids and fatty acid categories was calculated as follows:
For example, the experimental group in the ODHS consumed an average of 7·0 g of ALA, and 2387 total kcal/d as shown in Table 13, p. 32 of Leren's report(Reference Leren32). Using the above formula, we calculated that Oslo dieters consumed 2·7 en % from ALA. Although daily EPA+DHA intakes were not specifically quantified, sufficient information was available to estimate EPA+DHA intake. The daily intakes of LA (41·3 g), ALA (7·0 g) and ‘other polyenoic’ fatty acids (6·6 g) were also provided(Reference Leren32). Aside from LA and ALA, the primary polyenoic acids in human diets are arachidonic acid (AA) and EPA+DHA. In the experimental group, meat was ‘restricted as much as possible’ and ‘one egg with yolk was allowed once a week’, while ‘fish of all types, and all kinds of shell fish were recommended’, and ‘whale beef’ was recommended as a meat substitute. Experimental dieters were also supplied with ‘considerable quantities of Norwegian sardines canned in cod liver oil, which proved to be popular as a bread spread’ (Norwegian Canning Industry, Stavanger Preserving Company and Kommedal Packing Company, Stavanger)(Reference Leren32). Because the main sources of AA (meats and eggs) were restricted, and cold-water fish, sardines, cod liver oil, shellfish and whale are all rich sources of EPA and DHA, it follows that the majority of these ‘other polyenoic’ fatty acids were EPA+DHA. We conservatively estimated that 75 % of these unspecified polyenoic acids were EPA+DHA, about 5 g/d (2 en %).
TFA consumption was estimated via the same methods. In the ODHS report, Leren states that the average daily per capita intake of margarine was 65 g/d and that ‘nearly all marine fat used for human consumption, 40–50 g/d per head, is hydrogenated and used in the manufacture of margarine’. While control group dieters generally ‘continued their habitual diet’, partially hydrogenated fish oil (PHFO) and partially hydrogenated vegetable oil margarines were ‘entirely restricted’ in the experimental diet, and replaced with non-hydrogenated soybean and cod liver oils. To estimate TFA intake in the control group, we first searched MEDLINE and found a single reference for the fatty acid content of PHFO, which contained 40·9 g of TFA/100 g of margarine(Reference Cantwell, Flynn and Gibney65). Interestingly, PHFO contains substantial quantities of TFA with largely unknown metabolic and health effects (i.e. 15·3 g per 100 g of 20 and 22 carbon trans-isomers, 7·5 g of which are 20 and 22 carbon trans-PUFA isomers derived from AA and EPA and DHA)(Reference Cantwell, Flynn and Gibney65). PHFO margarine is known to have more substantial adverse effects on lipoproteins (LDL, HDL and Lp(a)) than partially hydrogenated vegetable oil or butterfat(Reference Almendingen, Jordal and Kierulf93), however, the effects of PHFO on inflammation, endothelial activation, coagulation and arrythmogenesis are unknown. To estimate the TFA content of partially hydrogenated vegetable oil, we selected the median value used in a recent analysis (35·0 g/100 g)(Reference Mozaffarian and Clarke88), a conservative estimate because ‘hard’ margarines in the 1960s were generally higher in TFA than softer margarines of the modern era. Using these estimates, Oslo control dieters consumed 6·9 en % as TFA from PHFO and 9·6 en % from total TFA. These numbers include 6·9 g (2·6 en %) of unusual 20 and 22 carbon trans isomers, half of which (3·4 g, 1·3 en %) are 20 and 22 carbon trans-PUFA isomers(Reference Cantwell, Flynn and Gibney65).
Analogous methods were used to calculate intakes of LA, ALA, EPA+DHA and TFA by experimental and control dieters in other RCT as shown in Tables 3, 7 and 9 and their legends. For the two US studies, the LA Veterans Study and the Minnesota Coronary Study, the consumption of TFA from margarines and shortenings as food was estimated as using economic disappearance data for the years 1959–68 and 1967–73, respectively (Fig. 6) (42), and dividing by energy intake to determine en %. Compared to published literature on US TFA intake, these values are conservative estimates(Reference Enig, Atal and Keeney94). For the three UK studies, the RCOT(Reference Rose, Thomson and Williams37), MRC Soy(35) and DART(Reference Burr, Fehily and Gilbert18) TFA were estimated from UK National Food Survey data for per capita household margarine use for the years 1960–4, 1960–7 and 1983–5, respectively(89)(Fig. 6). These figures are comparable to other published literature on UK margarine intake(Reference Greaves and Hollingsworth91) and are likely to underestimate total TFA intake as they do not include TFA from shortenings, baked goods or fried foods. For the Sydney Diet-Heart Study(Reference Woodhill, Palmer and Leelarthaepin38), TFA were estimated from the Office of Economic and Community Development Food Consumption Statistics for per capita apparent consumption of margarine in Australia in 1966–73(Reference Roberts95, 96). This estimate is likely to underestimate total TFA intake as it does not include TFA from shortenings, baked goods or fried foods.


