


1. Introduction
People often rely upon space when talking about time. For example, speakers of different languages casually use space-grounded metaphors when they talk about past or future events, such as “the days ahead”, “the time behind”, “down to the present day”, and “Sally’s birthday is coming up” (e.g., Gentner et al., Reference Gentner, Imai and Boroditsky2002; Lakoff, Reference Lakoff and Ortony1993). Similarly, they tend to gesture forward and to the right side when talking about future life events, and backward and to the left side when discussing past events (Walker & Cooperrider, Reference Walker and Cooperrider2016), although there are some exceptions to this pattern (e.g., Aymara or Yupno cultures in Bolivia and Papua New Guinea; Núñez & Sweetser, Reference Núñez and Sweetser2006). These and similar findings offer evidence for the existence of a pervasive spatial-conceptual mapping system supporting the representation of temporal concepts by referencing them in a three-dimensional space where future events are presumed to have a forward-rightward-downward and past events – a backward–leftward–upward orientation (Ding et al., Reference Ding, Feng, He, Cheng and Fan2020; Miles et al., Reference Miles, Tan, Noble, Lumsden and Macrae2011; but see Tversky et al., Reference Tversky, Kugelmass and Winter1991; Vallesi et al., Reference Vallesi, Arbula and Bernardis2014 for culture-specific variations).
The specific mapping axes in this spatial-conceptual space are often referred to as mental timelines (MTL; Bender & Beller, Reference Bender and Beller2014; Bonato et al., Reference Bonato, Zorzi and Umiltà2012). The sagittal axis represents the spatial dimension most often revealed by space–time metaphors (Núñez & Cooperrider, Reference Núñez and Cooperrider2013) with the agent being at the “now” point, future concepts in the forward, and past concepts in the backward space. Indeed, speakers of different languages (with some culture-based exceptions; Núñez & Sweetser, Reference Núñez and Sweetser2006) associate future/past events with forward/backward orientation and motion (Boroditsky, Reference Boroditsky2000, Reference Boroditsky2018; Teghil et al., Reference Teghil, Marc and Boccia2021). For instance, reaction times (RTs) are reduced if participants use a front-oriented response key when classifying future events and a back-oriented response key when classifying past events (Teghil et al., Reference Teghil, Marc and Boccia2021). Such sagittal axis dominance may reflect the fact that horizontal and vertical axes need to be perceptually “projected” while the sagittal axis is experienced directly by regularly moving forward in space. Supporting this, many studies show that movement in space along the sagittal axis facilitates past/future word and sentence processing (Eikmeier et al., Reference Eikmeier, Alex-Ruf, Maienborn and Ulrich2015; Sell & Kaschak, Reference Sell and Kaschak2011; Ulrich, Reference Ulrich2012, inter alia). For example, Sell and Kaschak (Reference Sell and Kaschak2011) found that the processing of sentences about future/past events was facilitated when participants had to move their hand forward/backward in order to execute a response but not when they had to simply press the back–front response keys. This and similar findings show how a universally experienced forward movement in physical space underscores the sagittally oriented MTL across cultures.
Horizontal and vertical axes, in turn, are presumed to reflect a more flexible and context-dependent mapping that may differ across contexts and cultures (Myachykov et al., Reference Myachykov, Scheepers, Fischer and Kessler2014; Pitt & Casasanto, Reference Pitt and Casasanto2020). This flexible mapping follows, for example, culturally specific reading direction habits (see Bender & Beller, Reference Bender and Beller2014; Chen & O’Seaghdha, Reference Chen and O’Seaghdha2013 for review). As a result, the vertical MTL is downward oriented for native speakers of Mandarin reflecting top-to-bottom reading habits (Bergen & Lau, Reference Bergen and Lau2012; Boroditsky et al., Reference Boroditsky, Fuhrman and McCormick2011; Chen & O’Seaghdha, Reference Chen and O’Seaghdha2013) while the corresponding vertical representations may be upward oriented in the Western cultures (Leone et al., Reference Leone, Salles, Pulver, Golombek and Sigman2018; Ruiz Fernandéz et al., Reference Ruiz Fernandéz, Lachmair and Rahona2014). Similarly, the horizontal MTL is rightward oriented in Western cultures, consistent with the writing and reading direction (Bergen & Lau, Reference Bergen and Lau2012; Fuhrman & Boroditsky, Reference Fuhrman and Boroditsky2010; Ouellet et al., Reference Ouellet, Santiago, Funes and Lupiáñez2010). Conversely, the MTL is leftward oriented in cultures with left-oriented writing and reading systems (e.g., Hebrew: Fuhrman & Boroditsky, Reference Fuhrman and Boroditsky2010; Ouellet et al., Reference Ouellet, Santiago, Israeli and Gabay2009; Tversky et al., Reference Tversky, Kugelmass and Winter1991; and Arabic: Tversky et al., Reference Tversky, Kugelmass and Winter1991).
The rightward-oriented MTL most frequently observed in European cultures (Bergen & Lau, Reference Bergen and Lau2012; Fuhrman & Boroditsky, Reference Fuhrman and Boroditsky2010; Ouellet et al., Reference Ouellet, Santiago, Funes and Lupiáñez2010), whose speakers commonly read and write from left to right, is typically indexed by the so-called STEARC effect (Spatial-Temporal Association of Response Codes; Ischebeck et al., Reference Ischebeck, Heim, Siedentopf, Zamarian, Schocke, Kremser, Egger, Strenge, Scheperjans and Delazer2008). The nature of the STEARC effect and the corresponding horizontally arranged MTL, grounded in the conventional reading and writing directions (Pitt & Casasanto, Reference Pitt and Casasanto2020), is similar to the well-documented SNARC (Spatial Numerical Association of Response Code) effect showing faster and more accurate right-lateral responses to larger numbers and left lateral responses to smaller numbers (Dehaene et al., Reference Dehaene, Bossini and Giraux1993, inter alia; but see Zebian, Reference Zebian2005 for the opposite directionality in a language with right-to-left-oriented writing system). Indeed, existing research consistently reports faster left-lateral responses when processing past (or shorter duration) events and faster right-lateral responses when processing future (or longer duration) events (Ishihara et al., Reference Ishihara, Keller, Rossetti and Prinz2008; Mehlabani et al., Reference Mehlabani, Sabaghypour and Nazari2020; Santiago et al., Reference Santiago, Lupiáñez, Pérez and Funes2007). To date, the STEARC effect has been reported for single temporal words, phrases, and sentences (Anelli et al., Reference Anelli, Peters-Founshtein, Shreibman, Moreh, Forlani, Frassinetti and Arzy2018; Santiago et al., Reference Santiago, Lupiáñez, Pérez and Funes2007; Torralbo et al., Reference Torralbo, Santiago and Lupiañez2006; Vallesi et al., Reference Vallesi, Binns and Shallice2008, Reference Vallesi, Weisblatt, Semenza and Shaki2014; Weger & Pratt, Reference Weger and Pratt2008). Furthermore, several studies showed horizontal spatial mapping of time duration (e.g., Vallesi et al., Reference Vallesi, Binns and Shallice2008), time–space metaphors (Moore, Reference Moore2006; Núñez & Sweetser, Reference Núñez and Sweetser2006), deictic time words (i.e., “later”, “future”, e.g., Woodin & Winter, Reference Woodin and Winter2018), and earlier and later events presented as photographs (e.g., Boroditsky et al., Reference Boroditsky, Fuhrman and McCormick2011). Of particular importance to our study is the fact that several studies documented the activation of the horizontal MTL for specific time units, that is, days of the week and months of the year with the left-to-right arrangement from Monday to Sunday and from January to December (Gevers et al., Reference Gevers, Reynvoet and Fias2003, Reference Gevers, Reynvoet and Fias2004). Finally, emerging neuropsychological research suggests that the parietal cortex underpins both temporal and spatial processing (see Bueti & Walsh, Reference Bueti and Walsh2009, for a review). For example, focal damage to the parietal cortex may lead to both temporal and spatial processing deficits (e.g., Battelli et al., Reference Battelli, Cavanagh, Martini and Barton2003; Critchley, Reference Critchley1953). Moreover, the inferior parietal cortex is activated in tasks that require the integration of temporal and spatial information both in humans (Assmus et al., Reference Assmus, Marshall, Ritzl, Noth, Zilles and Fink2003) and in primates (Onoe et al., Reference Onoe, Komori, Onoe, Takechi, Tsukada and Watanabe2001). Finally, this network may be involved during the processing of other scalar concepts such as number, size, and valence, suggesting its relatively universal role in the spatial-conceptual mapping of abstract concepts (Walsh, Reference Walsh2003, Reference Walsh, Kadosh and Dowker2015).
Here, we report the results of a study investigating the mapping of individual time units in horizontal space during the processing of Russian temporal words. Like other European languages, Russian employs left-to-right reading and writing directions. In Russian culture, the year begins in January and ends in December, the week spans from Monday to Sunday, and 24-hour and 12-hour time formats are used about equally often. The novelty of our approach is twofold. First, we used, for the first time, a computerized version of the line-bisection task (Fischer, Reference Fischer2001). One of the advantages of this task is that it simultaneously engages participants’ attentional, motor, and cognitive processes, which were previously shown to be of particular importance for the activation of spatial-conceptual mappings in time concepts (Sell & Kaschak, Reference Sell and Kaschak2011). The use of the line-bisection task allows simultaneous attribution of both (1) response-related RTs and (2) overt sensorimotor responses operationalized as the response’s spatial coordinates, hence allowing both chronometric and spatial data analyses. Second, while previous studies analyzed the activation of the horizontal MTL separately for different time units (He et al., Reference He, He, Zhao, Wang, Li and Louwerse2020; Laeng & Hofseth, Reference Laeng and Hofseth2019; Leone et al., Reference Leone, Salles, Pulver, Golombek and Sigman2018; Price, Reference Price2009), or in regards to other domains (Bono & Zorzi, Reference Bono and Zorzi2013; Dodd et al., Reference Dodd, Van der Stigchel, Adil Leghari, Fung and Kingstone2008; Franklin et al., Reference Franklin, Jonides and Smith2009; Ischebeck et al., Reference Ischebeck, Heim, Siedentopf, Zamarian, Schocke, Kremser, Egger, Strenge, Scheperjans and Delazer2008; Zorzi et al., Reference Zorzi, Priftis, Meneghello, Marenzi and Umiltà2006), we compared mappings of distinct time units by using the same experimental task along the same horizontal MTL. Third, while existing studies offer evidence for the horizontal arrangement of days and months (Gevers et al., Reference Gevers, Reynvoet and Fias2003, Reference Gevers, Reynvoet and Fias2004), there is no research, to the best of our knowledge, that would investigate the horizontal MTL for the hours of the day. Note that, in addition to studies that show linearly arranged horizontal MTL in days of the week, other studies report circular clockwise representations for months (Brang et al., Reference Brang, Teuscher, Ramachandran and Coulson2010; Laeng & Hofseth, Reference Laeng and Hofseth2019; Leone et al., Reference Leone, Salles, Pulver, Golombek and Sigman2018) and hours of the day (Bächtold et al., Reference Bächtold, Baumüller and Brugger1998; Bock et al., Reference Bock, Irwin, Davidson and Levelt2003; Goolkasian & Park, Reference Goolkasian and Park1980; Ristic et al., Reference Ristic, Wright and Kingstone2006; Vuilleumier et al., Reference Vuilleumier, Ortigue and Brugger2004). The latter is not only important to be able to generalize the STEARC effect across different time units; it is also necessary to compare the strength of association between the horizontal space and time in these different temporal domains.
2. Methods
2.1. Experimental design
In this study, we analyzed task-related RTs and x-coordinates of participants’ mouse click responses (XC) in order to compare the nature of horizontal mapping in distinct temporal subdomains – hours of the day, days of the week, and months of the year. To evaluate the strength of the association between time units and the lateral attentional shift, three experimental factors were independently manipulated in a 3 × 2 × 3 within-subject design: Time Unit (Hours/Days/Months), Word Bias (Left/Right), and Scale Bias (Left/Center/Right). The Time Unit factor represented Russian words for days of the week (e.g., понедельник [ponedel’nik] – ‘Monday’), months (e.g., апрель [aprel’] – ‘April’), and hours of the day (e.g., девять часов утра [devyat’ chasov utra] – ‘nine a.m.’ (literally: ‘nine o’clock in the morning’); семь часов вечера [sem’ chasov vechera] – ‘seven p.m.’ (literally: ‘seven o’clock in the evening’). The Word Bias factor represented the potential semantic bias of a temporal word. That is, we used three putatively left-biasing (Monday, Tuesday, and Wednesday) and three right-biasing week-day words (Friday, Saturday, and Sunday) (Gevers et al., Reference Gevers, Reynvoet and Fias2004). Similarly, the month set included three left-biasing (February, March, and May) and three right-biasing month words (August, September, and October) (Gevers et al., Reference Gevers, Reynvoet and Fias2003). The hours set included three left-biasing (five a.m., seven a.m., and nine a.m.) and three right-biasing items (four p.m., six p.m., and eight p.m.). While there are no studies using similar/comparable hour items, some existing research confirms a horizontal arrangement of the expressions referring to morning/day/evening daytimes (Ding et al., Reference Ding, Feng, Cheng, Liu and Fan2015). Each temporal word was paired with three visual Scale Bias stimuli. The visual stimuli were horizontal lines representing different time intervals within the corresponding unit type (hours, days, months). The Scale Bias lines were selected in such a way that each auditory stimulus would correspond to one of the three conditions: Left Bias, Center Bias, and Right Bias. For example, the word “Monday” could be presented alongside the Scale Bias line “Sunday–Thursday” biasing a left-oriented response, a “Saturday–Wednesday” line biasing a center-oriented response, or a “Friday–Tuesday” line biasing a right-oriented response. The Scale Bias design for other word types followed the same logic.
Congruent and incongruent experimental conditions were established as the combination of the Word Bias and Scale Bias factors. RT performance in the congruent conditions (left word bias + left scale bias/right word bias + right scale bias) was hypothesized to be associated with a specific RT decrease in comparison to the incongruent one (left word bias + right scale bias/right word bias + left scale bias). In incongruent trials, we expected an increase in RTs, due to attentional displacement, similar to the effects observed in the classical Posner cueing paradigm (Posner, Reference Posner1980). An additional question was whether the interaction between perceptual (scale) and semantic (word) biases would cause a greater displacement of participants’ (x-axis) mouse responses in the corresponding direction (hereafter: summation of biases effect). The central scale bias condition was used to disentangle the effects of the two types of bias involved in the experimental task: scale (based on the scale arrangement) and word (based on the general lateral distribution of the corresponding concepts within their entire scope). In addition, having a Center Scale condition allowed us to go beyond the scope of the forced shift of visual attention and observe attention shifts attributable purely to the activation of the word meaning. Therefore, the dependent variables were task-related RT and the XC.
2.2. Materials
The auditory stimuli were 32-bit audio recordings sampled at 22,050 Hz. Individual stimulus durations varied between 800 and 2,000 ms. Auditory stimuli were recorded using male and female synthesized voices in Yandex SpeechKit software (implemented at http://5btc.ru/voice/). As mentioned above, an equal number of stimuli per subdomain were selected with the same number of left- and right-biasing items to balance the stimulus sets. Each auditory item was paired with three visual Scale Bias stimuli. The visual stimuli were same-length horizontal lines (1,400 pixels) presented in the center of the screen with extreme points marked on both sides. The resulting set of 54 stimuli was randomly presented three times, with short breaks allowing participants to rest between the subblocks. A full set of stimuli used in the experiment is presented in Table 1.
Stimulus material

2.3. Participants
Fifty-four native speakers of Russian participated in the study (age 21.5 ± 4.1 years; 36 females). All participants had normal or corrected-to-normal vision and had no knowledge of the study design or hypotheses. The experimental procedures were approved by the HSE University Ethics Committee. Each participant gave their written consent to take part in the study. Each participant received a payment of 250 Russian rubles and was debriefed at the end of the session.
2.4. Procedure
Each participant was tested individually in a soundproof booth. Participants sat in front of a screen at an approximate viewing distance of 60 cm. Participants used a desktop optical computer mouse to provide their line-bisection responses. The monitor specifications were 16:9, diagonal 21.5", and screen resolution 1,920 × 1,080 pixels. The experiment was implemented in PsychoPy Version 3.2.3. Response coordinates were recorded as height units. Height units provide a measure of the coordinate response relative to the height of the window. As a result, the dimensions of a standard screen 4:3 aspect ratio range from (–0.6667, –0.5) in the bottom left to (+0.6667, +0.5) in the top right. The x/y screen coordinate dimensions were between (–0.8, –0.5) in the bottom left to (+0.8, +0.5) in the top right. The spoken words were presented via headphones binaurally at a comfortable sound level, determined individually.
At the beginning of their individual experimental sessions, participants were instructed to listen to each word attentively and then respond as fast as possible by intuitively moving the mouse cursor to and clicking on the approximated location of the presented word of the visually presented line. The experiment began with eight practice trials that were not repeated in the main experimental session. The main session consisted of three blocks of trials with short breaks in-between; each block consisted of 54 individually randomized trials (each of the 54 stimuli was presented once per block). Each trial started with a centrally presented fixation cross. The central fixation cross remained on the screen for 400 ms. After a 300-ms inter-stimulus interval, participants heard a word (a day of the week, a month, or an hour of the day) and saw a line representing the corresponding scale interval centrally on the screen. Participants moved the mouse cursor to the chosen location on the line and indicated their location choice with a left mouse click. The line remained on the screen until the response. Task-related RT was defined as the time interval between the onset of the target (a horizontal line) and the participant’s response (left mouse click). In order to provide a form of post-hoc control of task performance, participants answered verification questions about presented words in 20% of trials (e.g., ‘Was the word you just saw “today”’?) by using “M” key of a standard computer keyboard to provide an affirmative answer and “C” key – to provide a negative one. A typical trial sequence is shown in Fig. 1.
Example of an experimental trial sequence.

3. Statistical analyses
For RT data trimming, false alarm values shorter than 240 ms and delays over 2.5 median absolute deviations (MAD) above the group median were excluded (Leys et al., Reference Leys, Ley, Klein, Bernard and Licata2013). The remaining 91.3% of the data were subjected to statistical analyses. RT and response coordinate data were analyzed separately with the help of within-participant analysis of variance (ANOVA) models with the following factors: Time Unit (Hours/Days/Months), Word Bias (Left/Right), and Scale Bias (Left/Center/Right) with the subsequent examination via pair-wise t-tests corrected for false discovery rate (FDR; Benjamini & Hochberg, Reference Benjamini and Hochberg1995).Footnote 1 For data analyses, IBM SPSS Statistics (version 23.0) predictive analytic software was used. Significance of an effect was assumed at p < 0.05, FDR-corrected. Owing to the complexity of the design leading to multiple statistical outcomes, we will focus on the theoretically most critical effects in the text. For a more comprehensive overview, all statistical results are presented in tables. The script of the experiment, the data, and the scripts used for statistical analyses are accessible via a link to an anonymized repository: https://osf.io/jy4h5/?view_only=9dc7a32e664746c5a695625bb0139c1f.
4. Results
4.1. Reaction time data
We registered three main effects. Moreover, all two-way interactions and a three-way interaction were also significant. Statistical results are presented in Table 2. Mean RTs in each combination of the factors are presented in Table 3.
Reaction times. ANOVA: Time Unit, Word Bias, and Scale Bias

Mean reaction times; standard errors are in parentheses

A detailed examination of the significant main effect of Time Unit showed that words denoting hours of the day were processed 86 ms faster than days and 197 ms faster than months, while days of the week were 111 ms faster than months (see Table 4). Thus, participants’ responses were graded in the following order: the quickest responses were observed for hours of the day, then for days of the week, followed by months. These contrasts, while interesting, were not immediately relevant to our research hypotheses.
Reaction times. Pairwise t-tests: main effect of Time Unit

More importantly, our predictions regarding RT facilitation (in congruent conditions) and interference (in incongruent conditions) were supported by the significant interaction between Word Bias and Scale Bias. A more detailed examination of this interaction revealed that responses were 104 ms faster when left-biased scales were combined with left-biased words instead as opposed to right-biased words, although there was no reliable difference between left-biased and right-biased words for the right-based scale (see Table 5). In other words, responses to left-biased words were faster when those words were combined with a congruent left-scale bias.
Reaction times. Pairwise t-tests: interaction between Word Bias and Scale Bias

We further examined the significant three-way interaction between Time Unit, Word Bias, and Scale Bias by breaking it down into three two-way interactions along the Time Units variable (Hours/Days/Months) (see Table 6). This allowed an examination of the congruent/incongruent bias conditions for each of the unit types. The RT facilitation effect was confirmed for days of the week (although restricted to left-biased congruence): participants were 104 ms faster when stimuli were presented in congruent (left-biased scales and left-biased words) than in incongruent (left-biased scales and right-biased words) conditions (see Fig. 2 and Table 7). For months, there were no significant differences between the conditions (see Fig. 3). Further significant results were obtained for hour units: responses were faster for left-biased words in all conditions. Namely, there was a 167 ms difference between left-biased and right-biased hours units presented on left-biased scales, and a 135 ms difference between left-biased and right-biased hour units presented on right-biased scales (see Fig. 4). It suggests that all left-biased hour units were processed faster than right-biased ones regardless of congruency of conditions.
Reaction times. ANOVA: interaction between Word Bias and Scale Bias along Time Unit

Reaction times. Interaction between Word Bias and Scale Bias along Time Unit (days). Error bars represent 95% confidence intervals.

Reaction times. Pairwise t-tests: interaction between Word Bias and Scale Bias along Time Unit

Reaction times. Interaction between Word Bias and Scale Bias along Time Unit (months). Error bars represent 95% confidence intervals.

Reaction times. Interaction between Word Bias and Scale Bias along Time Unit (hours). Error bars represent 95% confidence intervals.

To further investigate these findings, we decided to follow up the significant interaction between Time Unit and Scale Bias (see Table 8). This procedure revealed that the strategies participants used for hours of the day differed from those used for other time units. Hour units presented on left-biased scales were processed 147 ms faster than on center scales, and 183 ms faster than on right-biased ones. Thus, RTs for hour units increased as a function of scale bias in the following order: left > center > right, while the strategy for other time units was not as unidirectional (see Fig. 5).
Reaction times. Pairwise t-tests: interaction between Time Unit and Scale Bias

Reaction times. Interaction between Time Unit and Scale Bias. Error bars represent 95% confidence intervals.

4.2. Response coordinate data
A 3 × 2 × 3 ANOVA revealed a significant effect of Word Bias and Scale Bias, a two-way interaction between Time Unit and Scale Bias, and a three-way interaction (see Table 9). Mean x-axis response coordinates in each combination of the factors are presented in Table 10. Recall that an additional research question was whether the interaction between perceptual (scale) and semantic (word) biases would cause a greater displacement of participants’ responses in the corresponding direction. For this purpose, response coordinate data were analyzed using within-participant ANOVA models separately for the central, left, and right scales with the following independent factors: Time Unit (Hours/Days/Months) and Word Bias (Left/Right).
Mean response coordinates (in height units); standard errors are in parentheses

Response coordinates. ANOVA: Time Unit, Word Bias, and Scale Bias

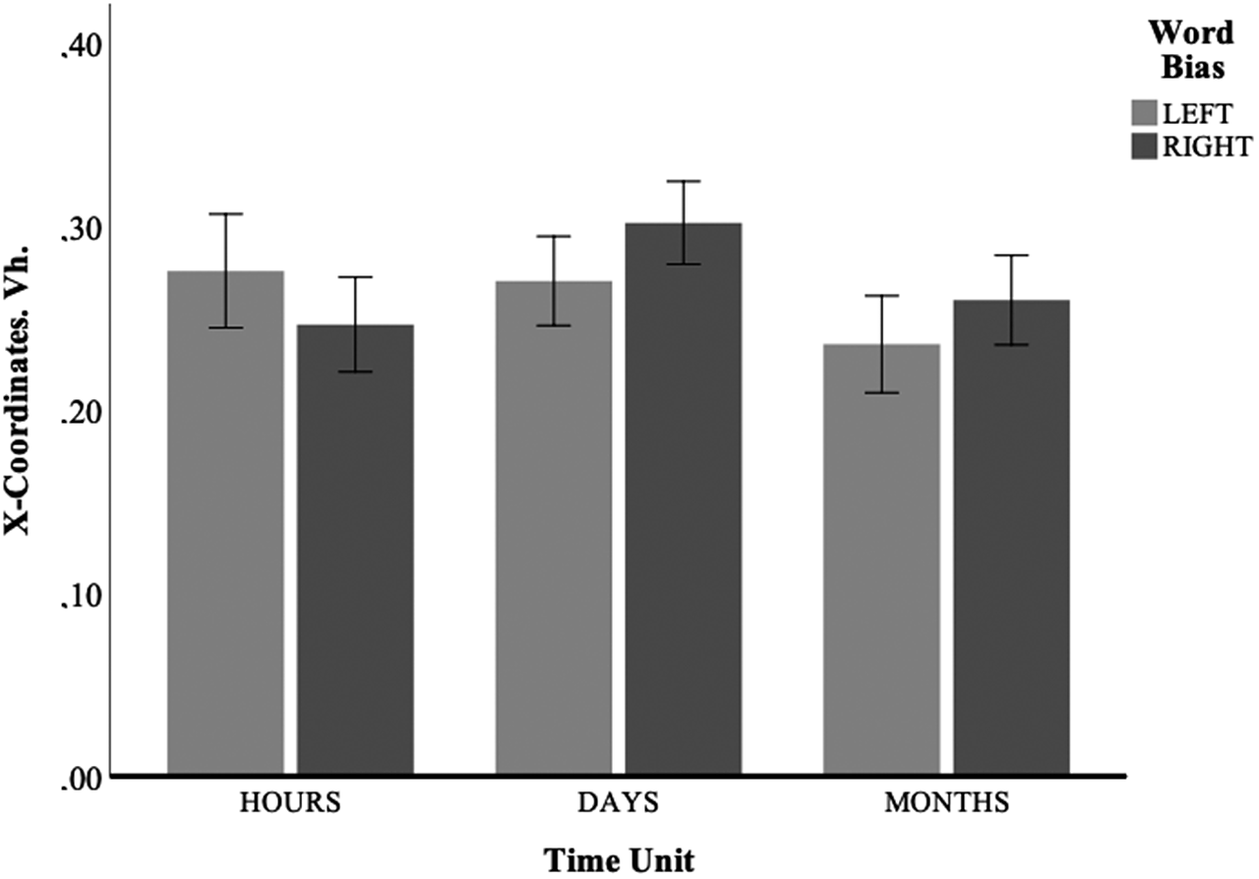
For the central scale (see Table 11), we registered a significant main effect of Word Bias: participants placed left-biased words further toward the left side of the line than right-biased ones. A significant interaction between Time Unit and Word Bias allowed the determination of the locus of this effect in differences for each time unit (see Fig. 6 and Table 12). Examination of the interaction by means of pairwise t-tests revealed significant differences in x-coordinates between right- and left-biased words which emerged only for hours of the day. These findings suggest that expected shifts of visual attention attributed purely to the activation of the word meaning were observed only for hour units.
Response coordinates. ANOVA: interaction between Time Unit and Word Bias along Scale Bias

Response coordinates. Pairwise t-tests: interaction between Time Unit and Word Bias along Scale Bias

x-coordinates. Interaction between Time Units and Word Bias (Center Scale Bias). Error bars represent 95% confidence intervals.

For the left scale, we registered two significant main effects: Word Bias and Time Unit (see Table 11). The main effect of Word Bias indicates that participants placed left-biased words presented with left-biased scales (congruent condition) further toward the left side of the line than right-biased ones. Although the interaction was not significant, we performed pair-wise comparisons in the absence of a significant interaction (Wilcox, Reference Wilcox1987) because we had specific a priori hypotheses with respect to these comparisons (see Introduction). A-priori designed t-test planned comparisons found significant differences between congruent and incongruent conditions for hours of the day (see Fig. 7, Table 12). Thus, for the left-biased scale, participants placed left-biased hours more on the left side of the line than right-biased ones. Thus, the summation of biases caused the greater displacement of participants’ responses in the direction corresponding to summation only for hours of the day.
x-coordinates. Interaction between Time Units and Word Bias (Left Scale Bias). Error bars represent 95% confidence intervals.

For the right scale, we registered a significant main effect of Time Unit and a significant interaction between Time Unit and Word Bias (see Table 11). Examination of this interaction using pairwise t-tests (see Fig. 8, Table 12) revealed significant differences for right- and left-biased months and days of the week: right-biased words (congruent condition) were placed more on the right side of the line than left-biased ones (incongruent condition). A significant difference in x-coordinates between right- and left-biased hours of the day was reversed: left-biased hour units were placed more on the right side of the line than right-biased ones.
x-coordinates. Interaction between Time Units and Word Bias (Right Scale Bias). Error bars represent 95% confidence intervals.
5. Discussion
The main goal of this study was to examine how different time units are mapped onto horizontal space and whether the corresponding mappings are relatively regular and consistent. Participants listened to words denoting hours of the day, days of the week, and calendar months while indicating where the corresponding units should be located on a horizontal line. In addition, the extreme coordinates of the line were variably labeled in order to elicit a visual scale bias and provide us with a variety of data corresponding to different associations of the stimulus word within the corresponding unit (sub)scale. To the best of our knowledge, this is the first study to (1) simultaneously examine horizontal time–space interactions for different time units and (2) use a line-bisection task, allowing simultaneous attribution of chronometric and spatial signatures of time-denoting word access within the same response.
Our analysis partially confirmed that Russian time units (hours of the day, days of the week, and months) followed a horizontal spatial orientation. Regardless of the time units used, congruent conditions (left word + left scale biases) led to task-related RT facilitation effects, whereas processing of words in incongruent conditions resulted in slower task performance. Comprehension of left-biased time units presented with a central Scale Bias condition caused regular shifts of spatial attention that were reflected in left biases of participants’ responses. Moreover, participants’ manual responses were more biased to the left when left-biased time units were presented with a left scale bias. One potential reason for the left-oriented asymmetry in the patterns is a possible effect of SNARC-related small number advantage (Cai & Li, Reference Cai and Li2015; Di Bono & Zorzi, Reference Di Bono and Zorzi2013).
Together, these findings support the notion of a horizontal space–time association and, as such, are consistent with existing research (Gevers et al., Reference Gevers, Reynvoet and Fias2003; Ishihara et al., Reference Ishihara, Keller, Rossetti and Prinz2008; Ouellet et al., Reference Ouellet, Santiago, Funes and Lupiáñez2010). More importantly, considerable differences between time units with regard to the strength and the nature of their association with horizontal space were revealed by the observation of several significant interactions and effects which we discuss in detail below, separately for each time unit.
5.1. Calendar months
The analysis of ‘months’ data did not reveal any RT facilitation effect. In other words, the putative semantic bias of the month units did not lead to shifts in participants’ spatial attention. This finding is inconsistent with previous research showing horizontal STEARC effect for month units (Gevers et al., Reference Gevers, Reynvoet and Fias2003, but see Price & Mentzoni, Reference Price and Mentzoni2008). Our experiment also did not show regular shifts of spatial attention when month units were presented in a central Scale Bias condition. However, shifts in participants’ manual responses in the corresponding direction were found for the combination of right scale and right word biases. Together, these findings indicate that participants experienced a somewhat greater difficulty relating month words to horizontal space. Indeed, months are typically presented on printed calendars as vertical grids or separate pages, without a clear horizontal direction. Alternative explanations may lie in other forms of spatial mapping “preferred” for this type of temporal words, such as a clock dial circle with a clockwise / counterclockwise direction and a location of January corresponding to numbers 6 or 12 on a classic 12-hour clock setup (Laeng & Hofseth, Reference Laeng and Hofseth2019; Leone et al., Reference Leone, Salles, Pulver, Golombek and Sigman2018; Seymour, Reference Seymour1980; Zorzi et al., Reference Zorzi, Priftis, Meneghello, Marenzi and Umiltà2006). Previous studies have indeed showed weak associations between months and horizontal space (e.g., Bono & Zorzi, Reference Bono and Zorzi2013; Price & Mentzoni, Reference Price and Mentzoni2008; Zorzi et al., Reference Zorzi, Priftis, Meneghello, Marenzi and Umiltà2006). In contrast to this, month units are often used in research on space–time representations (Dodd et al., Reference Dodd, Van der Stigchel, Adil Leghari, Fung and Kingstone2008; Franklin et al., Reference Franklin, Jonides and Smith2009; Gevers et al., Reference Gevers, Reynvoet and Fias2003; He et al., Reference He, He, Zhao, Wang, Li and Louwerse2020). These findings suggest that the use of month units might be optimal for cross-domain studies documenting an interplay between the spatial mappings underlying numerical magnitude (i.e., SNARC effect) and temporal words (i.e., STEARC effect). The latter observation is important as it suggests a cross-domain priming mechanism that is not necessarily based on the activation of a common attentional interface (Myachykov et al., Reference Myachykov, Chapman and Fischer2017) but on different mechanisms such as, for example, a similar numbering or sequencing strategy (e.g., He et al., Reference He, He, Zhao, Wang, Li and Louwerse2020).
5.2. Days of the week
Analyses of the days of the week data provided overall evidence that access to this type of temporal words leads to a regular shift of spatial attention, confirming a horizontal semantic bias in the corresponding conceptual representations. Importantly, RT facilitation effects were observed in congruent conditions (left word bias + left scale bias). Additionally, the interaction between perceptual and semantic right biases (congruent condition) caused a greater displacement of participants’ responses in the corresponding direction, confirming summation of bias effects for the right scale. These findings suggest a horizontal arrangement of the days of the week with Monday, Tuesday and Wednesday mapped in the left space and Friday, Saturday and Sunday – in the right space of the corresponding MTL. This finding is consistent with previous research (e.g., Gevers et al., Reference Gevers, Reynvoet and Fias2004; Leone et al., Reference Leone, Salles, Pulver, Golombek and Sigman2018). Our results suggest that like other time units, days of the week are conceptualized along a horizontal dimension. This may reflect a cultural influence as weekdays are usually represented graphically via a classic calendar grid, which typically shows a left-to-right progression from Monday to Sunday in Russian culture.
5.3. Hours of the day
Results showed that the processing of hours of the day caused a regular attentional shift corresponding to the hypothesized semantic biases with a right-oriented horizontal projection from morning to evening. Notably, participants’ performance in congruent conditions (left word bias + left scale bias) caused the greatest response coordinate displacement in the response-congruent direction. An attentional shift attributable purely to the activation of the word meaning (central Scale Bias condition) was observed. It indicates a strong association between hour units and lateral attentional shift. These findings indicate that the association between the horizontal axis and hours of the day may be the strongest among the three time units investigated here. One important caveat, however, is that the analysis revealed that participants used a left-to-right oriented strategy when performing the task with hour units, which might reflect counting direction. Moreover, the fact that all left-biased hour units were processed faster than right-biased ones regardless of congruent and incongruent conditions cannot be explained by difficulties in lexical information processing, as differences between words “утра” (a.m.) and “вечера” (p.m.) used for hour stimuli only differ by 1 syllable (although this factor cannot be fully ruled out at this stage). Instead, it might be explained by left pseudoneglect (Schmitz & Peigneux, Reference Schmitz and Peigneux2011) which was previously registered in similar SNARC research using line-bisection paradigm (Loftus et al., Reference Loftus, Nicholls, Mattingley, Chapman and Bradshaw2009). Indeed, the stimulus type we used is compositional, and it involves both words and numbers. Hence, the strong horizontal mapping observed may reflect a numerical SNARC effect rather than a representation of STEARC effect. Therefore, close association between hours and horizontal space may be influenced by numerical concepts and thus be partially driven by the SNARC effect (cf. He et al., Reference He, He, Zhao, Wang, Li and Louwerse2020; Zhao et al., Reference Zhao, He, Zhao, Huang, Zhang, Wu and Chen2018). However, as we used numbers with similar biases for morning and evening hours (e.g., 6 a.m. and 6 p.m.), this factor is unlikely to explain this result entirely, suggesting a direct space–time mapping for hours of the day, irrespective of a SNARC-like numerical influence. The explanation for strong horizontal representations of hours might lie in the time-of-the-day words that represent hour units, as they directly refer to parts of the day (‘утра’, a.m. – literally in the morning; ‘вечера’, p.m. – literally in the evening). Thus, participants could rely on a more general day flow (beginning in the morning and ending in the evening) instead of hours of the day. Regardless of the exact mechanism, our findings indicate that participants consistently selected a rightward-oriented horizontal projection when accessing these temporal words.
5.4. Conclusions and limitations
Our findings provide evidence that time units and corresponding words comprise a complex semantic category with simultaneous direct and indirect (possibly via numerical SNARC) sensorimotor mapping mechanisms as well as different degrees of association with the horizontal space. In general, our findings are consistent with the existence of a horizontal MTL with left-biased time units (e.g., Monday) located in the leftward space and right-biased time units (e.g., Sunday) in the rightward space. However, we conclude that the horizontal axis has a stronger association with hours of the day than with longer units, such as days of the week and months. This general conclusion may reflect both the influence of other spatial representations (e.g., calendar, circle) as well as the influence of other spatial-conceptual domains (e.g., SNARC). One of the limitations of this study is that the reason behind observing the effects of RT facilitation and summation of biases only for certain pairs of stimuli (either for left word bias + left scale bias or for right word bias + right scale bias) is yet to be clarified. This question should be addressed by future research. Future research on the topic might also benefit from using the same or comparable experimental tasks for different temporal word types. Furthermore, future research should consider using lexical or abstract stimuli that are fully comparable in their forms to avoid potential confounds originating from spatial-numerical associations. Another limitation is that the inclusion of an ordered scale in the task already presents participants with a horizontally-oriented time line. Although spatial components are often included in tasks investigating spatial representations (e.g., Bächtold et al., Reference Bächtold, Baumüller and Brugger1998; Leone et al., Reference Leone, Salles, Pulver, Golombek and Sigman2018), future studies of time units should be conducted in the absence of such components (see Lachmair et al., Reference Lachmair, Ruiz Fernández and Gerjets2016; Myachykov et al., Reference Myachykov, Ellis, Cangelosi and Fischer2016 for numerical domain), using, e.g., eye-tracking and neuroimaging methods. Similarly, as reading of written words (from left to right) could affect spatial mapping of time units itself – both in terms of mapping direction and in terms of spatial arrangement – written stimuli should be presented auditorily in future research. This may also be further controlled using subjects of different cultural backgrounds with different writing directions and diverging traditions for representation of time units. Finally, it is important to expand the scope of our findings by investigating space–time interactions in other dimensions (i.e., vertical and sagittal axes, circular representations) as well as by addressing the question of space–time interactions in other time units, for example, minutes and years.
Acknowledgements
The article was prepared in the framework of a research grant funded by the Ministry of Science and Higher Education of the Russian Federation (grant ID: 075-15-2022-325).
Data availability statement
The script of the experiment, the data, and scripts used for statistical analyses are accessible via a link to an anonymized repository: https://osf.io/jy4h5/?view_only=9dc7a32e664746c5a695625bb0139c1f.


 Open access