


1. Introduction
Part of communicating as a bilingual is selecting which language(s) to use to convey a message. Sometimes, this language is dictated by the circumstances. For example, a Mandarin–English bilingual in the UK will typically use English when studying. However, a language switch is needed when calling a Chinese monolingual friend. In these cases, language switching is guided by external cues (e.g., the interlocutor). In other situations, however, bilinguals can choose their language and switching can take place more freely – for example, when surrounded by other bilinguals speaking the same languages.
According to the Adaptive Control Hypothesis (ACH, Green & Abutalebi, Reference Green and Abutalebi2013), these different types of situations pose different demands on language control. When language choice is dictated by cues (e.g., interlocutors), the ACH posits that various control processes are needed, including cue detection (to know which language to use), goal maintenance (ensuring the target language is used), and interference control (to avoid interference from the non-target language). When switching, bilinguals disengage from the previously used language and engage with the new language, which might require inhibition of the non-target language (Inhibitory Control Model, Green, Reference Green1998) and relies on competitive language coordination (Green & Wei, Reference Green and Wei2014). In contrast, the ACH argues that these control processes might be less needed when bilinguals can switch freely with other bilinguals. Here, a more opportunistic approach might be used that allows bilinguals to use the words that come to mind fastest, regardless of the language they are in (Green & Abutalebi, Reference Green and Abutalebi2013). These environments might allow for more cooperative rather than competitive language coordination (Green & Wei, Reference Green and Wei2014).
Within language production, language-control mechanisms might thus differ depending on the type of switching. Furthermore, the role of language control when processing switches made by others remains unclear. While various studies have suggested that comprehension too might be influenced by language competition and show language-switching costs (e.g., Litcofsky & Van Hell, Reference Litcofsky and Van Hell2017; Olson, Reference Olson2017), others question the robustness of comprehension switching costs and suggest that language competition might be less influential during comprehension (e.g., Declerck, Koch, Duñabeitia, Grainger & Stephan, Reference Declerck, Koch, Duñabeitia, Grainger and Stephan2019).
The current study therefore compared three types of language switching (Experiment 1: cued and free switching during production; Experiment 2: processing language switches during comprehension). To examine language-switching costs we manipulated the response-stimulus interval (RSI). A longer RSI might provide more time for activation of the previous task set (i.e., the representations needed to correctly respond to a specific task) to decay (e.g., Allport, Styles & Hsieh, Reference Allport, Styles, Hsieh, Umilta and Moscovitch1994), thus creating less interference if another task set is needed on the next (switch) trial. If language-switching costs are (at least partly) resulting from interference stemming from the previously used language, they should be smaller when the RSI is longer. We examined RSI effects across cued and free switching in production as well as when processing switches in comprehension to assess potential differences across contexts and modalities.
2. Experiment 1: Cued and voluntary production
2.1. Introduction
Cued language switching
Most research has assessed how bilinguals switch languages in response to cues (e.g., colours or flags) during picture naming (e.g., Costa & Santesteban, Reference Costa and Santesteban2004; Meuter & Allport, Reference Meuter and Allport1999). Within dual-language contexts (interchangeable use of two languages), switching costs are typically observed (e.g., Meuter & Allport, Reference Meuter and Allport1999), with slower responses when switching than when using the same language again (non-switch trials). Mixing costs compare the non-switch trials from the dual-language condition to single-language conditions, which often shows longer naming times in the dual-language condition (e.g., Christoffels, Firk & Schiller, Reference Christoffels, Firk and Schiller2007). These switching and mixing costs suggest that bilinguals need to manage interference from the “other” language but reflect different types of control (more reactive versus proactive control respectively). Following the Inhibitory Control model (Green, Reference Green1998), bilinguals might regulate interference by inhibiting words in the language currently not in use. For example, when switching from Mandarin to English, bilinguals activate English words but also suppress Mandarin words. Switching costs might not just stem from applying inhibition when switching but also from lifting previously applied inhibition (i.e., when switching back to Mandarin, the previously applied inhibition during English naming has to be lifted). Other explanations focus on activation, with bilinguals over-activating words in the target language and this increased activation of the previously used language persisting into the next trial and slowing down switching (e.g., Philipp, Gade & Koch, Reference Philipp, Gade and Koch2007). In both activation- and inhibition-focused explanations, however, language control (by enhancing activation of the target language and/or by suppressing interference from the other language) is an important aspect of switching.
Voluntary language switching
In contrast to cued naming tasks, voluntary switching has been assessed by asking bilinguals to name pictures in their language of choice. Freely using two languages might be less demanding than cued language use, as suggested by the faster responses in voluntary than cued picture-naming tasks (e.g., de Bruin, Samuel & Duñabeitia, Reference de Bruin, Samuel and Duñabeitia2018). Furthermore, freely using two languages might require less (proactive) language control than using one language in single-language contexts (a mixing benefit observed in e.g., de Bruin et al., Reference de Bruin, Samuel and Duñabeitia2018; Grunden, Piazza, García-Sánchez & Calabria, Reference Grunden, Piazza, García-Sánchez and Calabria2020; and partially in e.g., Gollan & Ferreira, Reference Gollan and Ferreira2009).
Results regarding voluntary switching costs, however, are mixed. Most studies show a voluntary switching cost (e.g., de Bruin et al., Reference de Bruin, Samuel and Duñabeitia2018; de Bruin, Samuel & Duñabeitia, Reference de Bruin, Samuel and Duñabeitia2020; Gollan & Ferreira, Reference Gollan and Ferreira2009; Gollan, Kleinman & Wierenga, Reference Gollan, Kleinman and Wierenga2014; Jevtović, Duñabeitia & de Bruin, Reference Jevtović, Duñabeitia and de Bruin2020; Gross & Kaushanskaya, Reference Gross and Kaushanskaya2015). Some comparisons find smaller voluntary than cued costs (e.g., Gollan et al., Reference Gollan, Kleinman and Wierenga2014; Jevtović et al., Reference Jevtović, Duñabeitia and de Bruin2020) while others find comparable costs (e.g, de Bruin et al., Reference de Bruin, Samuel and Duñabeitia2018; Gollan et al., Reference Gollan, Kleinman and Wierenga2014). However, voluntary costs are not always observed (e.g., Blanco-Elorrieta & Reference Blanco-Elorrieta and PylkkänenPylkkänen, Reference Blanco-Elorrieta and Pylkkänen2017; Kleinman & Gollan, Reference Kleinman and Gollan2016; Zhu, Blanco-Elorrieta, Sun, Szakay & Sowman, Reference Zhu, Blanco-Elorrieta, Sun, Szakay and Sowman2022). Although more research is needed, differences in the presence/size of this cost might relate to the bilinguals tested (Green & Abutalebi, Reference Green and Abutalebi2013), stimuli (e.g., using items strongly associated with one language, Zhu et al., Reference Zhu, Blanco-Elorrieta, Sun, Szakay and Sowman2022), or instructions (e.g., asking bilinguals to use a bottom-up approach by always choosing the same language for a given picture, Kleinman & Gollan, Reference Kleinman and Gollan2016).
When voluntary switching costs are observed, it suggests that even during voluntary switching, there might be some ongoing interference from the previously used language that can influence the switch to the other language. However, it remains unclear whether cued and voluntary costs are the result of similar underlying mechanisms. While cued switching requires goal maintenance and interference suppression to ensure the cued language is followed without interference from the other language, voluntary switching might use more cooperative rather than competitive control (Green & Abutalebi, Reference Green and Abutalebi2013; Green & Wei, Reference Green and Wei2014).
Response-stimulus interval
In this study, we therefore wanted to examine why language switching costs might be present during different switching contexts. Specifically, we examined how the switching cost relates to interference stemming from the previously used language. We therefore manipulated the interval between the response and the next stimulus (RSI).
The influence of RSI on switching costs has predominantly been studied in the non-linguistic task-switching literature. For example, Rogers and Monsell (Reference Rogers and Monsell1995) and Kray and Lindenberger (Reference Kray and Lindenberger2000) found that switching costs decreased with longer RSIs. Given that the switching pattern was predictable, this decrease might be because participants had more time to reconfigure the task set in preparation for the task required on the next trial. Voluntary task switching too might benefit from this extra time to decide which task to use next and to prepare the new task set, with shorter switching costs when the RSI is longer (Arrington & Logan, Reference Arrington and Logan2004). This explanation, however, is less likely to hold in voluntary language switching. In voluntary task switching, participants might be able to reconfigure the task set as soon as they finish the previous trial. A task set might be chosen before the stimulus is shown (e.g., the decision to respond to the parity or size of a digit might be less dependent on the actual digit). In contrast, in language switching, the language choice is closely related to the picture that has to be named and how fast the corresponding word can be accessed in each language (de Bruin et al., Reference de Bruin, Samuel and Duñabeitia2018). As a consequence, voluntary language switching might not benefit from additional interval time to prepare the next language set in advance when the item to be named is not known yet.
However, smaller switching costs with longer RSIs have also been observed in cued tasks when participants do not know which task to prepare in advance (e.g., Meiran, Chorev & Sapir, Reference Meiran, Chorev and Sapir2000), suggesting that RSI can also influence switching costs when the next task/language cannot be prepared yet (i.e., unpredictable cued or voluntary switching). In that case, RSI effects might be the result of longer RSIs allowing for more decay of activation from the previous task set. Following task-set inertia theories (e.g., Allport et al., Reference Allport, Styles, Hsieh, Umilta and Moscovitch1994), the task set from the previous trial (e.g., activating Language A and inhibiting Language B to name in Language A) might persist into the current trial (which would require the opposite when switching). Longer RSIs might (passively) reduce this interference from the previous task set and consequently less time might be needed to switch to the new task.
There is some evidence to suggest RSI can influence cued language switching costs too (Ma, Li & Guo, Reference Ma, Li and Guo2016). Chinese-English bilinguals completed a cued picture-naming paradigm with RSIs of 500ms, 800 ms, and 1500 ms. Switching costs decreased with an increase in RSI, especially for the first language (L1). Overall switching costs were also larger when switching to the L1 than to the second language (L2). This was interpreted in light of the amount of inhibition needed to suppress a more dominant language (L1). More inhibition of the L1 might be needed when using the L2 than vice versa. As a consequence, more time might be needed to overcome this previously applied inhibition when switching back to the L1, resulting in larger switching costs (Green, Reference Green1998). Larger L1 RSI effects could suggest that the longer RSI helped with passive decay of previously applied inhibition over the L1.
While explanations around active, advance preparation of the new task set are thus less likely for unpredictable cued or voluntary language switching, RSIs might influence these switching costs by providing more time for interference from the previous language set to decay. This could be through more decay of the activation of the previously used language and/or through more decay of previously applied inhibition, thus making the new target language more easily accessible.
Current study
The current study manipulated RSI length to compare cued and voluntary language switching. Our first aim was to replicate and further examine the influence of RSI on cued switching as observed in Ma et al. (Reference Ma, Li and Guo2016). Our second aim was to examine the potential influence of RSI on voluntary switching costs. If the influence of the previous language set is comparable for voluntary and cued naming, switching costs should be expected to be influenced by RSI similarly. However, if voluntary switching costs are less influenced by interference from the previous language set, voluntary costs should benefit less from longer RSIs allowing for more passive decay of interference. RSI effects on voluntary switching costs should then be smaller than effects on cued costs, or absent. While we were particularly interested in switching costs, we analysed mixing costs too to examine whether any potential RSI effects were specifically related to reactive control associated with switching.
2.2. Methods
Participants
Experiment 1 was completed by 32 Mandarin–English bilinguals. One additional participant only completed the first session and was replaced. One participant was removed from analysis after experiment completion due to reporting language and reading difficulties. Based on power analyses in simr (Green & MacLeod, Reference Green and MacLeod2016), using Experiment 3 in Ma et al. (Reference Ma, Li and Guo2016) to get a rough estimate of the expected effect size, and with 40 trials per condition and 100 simulations, this sample size yielded over 80% power. The final 31 participants (28 female; Mage = 23.7, SDage = 4.5) had (corrected-to-) normal vision and hearing and no known neurological, language, or reading impairments. Participants were right handed. The study was approved by the Ethics Committee of the Department of Psychology at the University of York.
All participants completed a language-background questionnaire (based on Anderson, Mak, Chahi & Bialystok, Reference Anderson, Mak, Chahi and Bialystok2018; Hartanto & Yang, Reference Hartanto and Yang2020; Rodriguez-Fornells, Kramer, Lorenzo-Seva, Festman & Münte, Reference Rodriguez-Fornells, Kramer, Lorenzo-Seva, Festman and Münte2012) and a written English picture-naming proficiency task (de Bruin, Carreiras & Duñabeitia, Reference de Bruin, Carreiras and Duñabeitia2017). Table 1 provides details about the participants’ language background. All apart from one were native Mandarin speakers; one participant reported Cantonese as their native language but acquired Mandarin during early childhood. All participants started acquiring English between the ages of 3 and 13 (MAoA = 8.4, SD = 2.6). English proficiency was lower than Mandarin proficiency but participants were living in the UK (Marrival = 2.2 years before the study; SD = 1.9) and their current language use was balanced or English-dominant with most interlocutors and in most environments/activities (see Table S1). Participants reported switching frequently on a daily basis and on average spent about half of their time in the UK in dual-language or dense-switching contexts (see Table S1).
Overview of the participants’ (self-rated) proficiency and mean daily-life language use and exposure while in the UK, per language (Experiment 1).
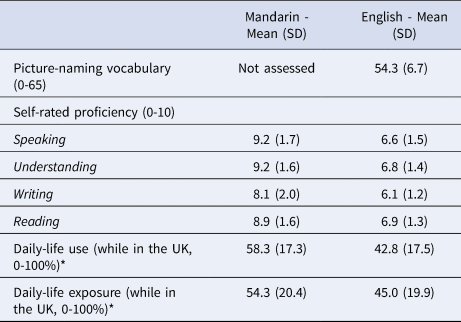
* Most participants spoke more languages than Mandarin and English (with many reporting speaking a local Chinese dialect) but all reported Mandarin and English to be the most used languages at the moment of testing.
Materials
Forty pictures (MultiPic Database, Duñabeitia et al., Reference Duñabeitia, Crepaldi, Meyer, New, Pliatsikas, Smolka and Brysbaert2018) were divided into two sets (see Appendix A). Half of the participants saw set 1 in the cued task and set 2 in the voluntary task, with the other half seeing each set in the opposite task. Frequency was matched between languages (see Appendix A). The main selection requirement was for words to be highly frequent and short. English words were one to three syllables and one to nine phonemes long. Mandarin words were one or two characters long.
Procedure
Participants completed the cued and voluntary naming tasks using PsychoPy (Peirce et al., Reference Peirce, Gray, Simpson, MacAskill, Höchenberger, Sogo, Kastman and Lindeløv2019) in two separate sessions approximately one week apart. The experiment lasted one hour per session. Half of the participants completed the cued task first and half the voluntary task. At the end of the first session, they completed the English proficiency test; after the second session they completed the questionnaire (see “Participants”). The study was led in person by a Mandarin–English bilingual. At the start of each session, participants saw the pictures with the English and Mandarin words in a familiarisation phase. They were asked to look at each picture and read the words in silence and to press space when they were ready to see the next item. Each session included a part with a long RSI (2 seconds) and a short RSI (0.5 seconds), comparable to Ma et al.'s shortest and longest RSI (Experiment 3, 2016). In line with Ma et al. (Reference Ma, Li and Guo2016), RSI was manipulated across blocks, with the order (short or long first) counterbalanced across participants. This also avoided influence of other variables proposed to explain RSI effects when RSI is manipulated within blocks (cf. Horoufchin, Philipp & Koch, Reference Horoufchin, Philipp and Koch2011). Within each RSI condition, participants first completed a single-language block, then a dual-language block, and then another single-language block. The order of languages in the single-language parts was counterbalanced across participants. The first single-language block and the dual-language part were preceded by three and nine practice trials respectively, using pictures that were not part of the actual experiment.
In total, participants completed 80 single-language trials (40 per language) and 200 dual-language trials per RSI condition in each task. Within the cued dual-language task, there was a similar number of switches and non-switches per language and each picture was presented an equal number of times in each condition. Trials were pseudo-randomised in an unpredictable order with no more than three trials of the same type (switch or non-switch) in a row. In the voluntary task, trial type and language depended on the participants’ responses. In both tasks, pictures were presented pseudo-randomly so that participants did not see the same picture twice in a row.
Each trial started with a fixation cross that was presented for either 0.5 or 2 seconds (depending on the RSI condition). Next, participants saw the picture they had to name (in the cued task the cue was presented simultaneously). Participants were instructed to press space immediately after naming the picture to start the RSI interval around the end of the wordFootnote 1.
In the single-language tasks, participants were told to name all pictures in one language. In the cued dual-language task, participants were told to choose the language in response to the country flag they saw as a cue. We used two versions of each cue (one rectangular and one circular version of the flag) to avoid confounds between language and cue switching (i.e., there was a cue switch on every trial, even when there was no language switch). In the voluntary dual-language task, participants were told they could name the pictures in Mandarin or English. They were asked to use both languages throughout the task but could switch whenever they wanted and use the word that came to mind first. Instructions were provided in both languages prior to dual-language tasks and in the language of the task in single-language tasks.
Data analysis
All data are available here: https://osf.io/q5ku4/
We first analysed the cued and voluntary tasks separately. For each task, we conducted one analysis assessing switching costs (switch and non-switch trials) and one analysis assessing mixing effects (non-switch and single-language trials). We used generalized linear mixed-effect models (for accuracy and voluntary switching frequency) and linear mixed-effect models (for RTs) using lme4 package version 1.1-21 and lmerTest 3.1.-3 in R 3.6.1.
Accuracy and naming language were coded by the bilingual experiment leader during the experiment. Answers were incorrect if no or a late response was given or if the wrong word, a combination of two languages, or the wrong language (cued) was used. Accurate responses starting with a hesitation were scored as correct and the onset of the word was taken as the naming onset. These response times (RTs) were determined from the recordings using Checkvocal (Protopapas, Reference Protopapas2007). For the RT analysis, we removed incorrect responses, dual-language trials for which we could not determine trial type (i.e., trials preceded by a break or incorrect response), and RT outliers (2.5SD above/below mean per participant and condition, using trimr, Grange, Reference Grange2015; 2.0% of correct trials in the cued task; 2.2% voluntary task). For the accuracy analysis, we only excluded the first dual-language trial after a break. RTs were log-transformed to improve normality of the distribution (means of untransformed RTs are reported). Analyses started with a maximal structure including participants’ and items’ intercepts and slopes. When models did not converge, we removed correlations between intercepts and slopes and then the by-item slopes explaining the least variance until convergence was reached (the final models can be found on the OSF page). All models included the fixed factors RSI (long = −0.5; short = 0.5), Language (Mandarin = −0.5; English = 0.5), and Trial type (mixing: single = −0.5; non-switch = 0.5; switching: non-switch = −0.5; switch = 0.5), and their interactions. For the voluntary task we also conducted an analysis examining switching frequency, which included trial type (non-switch = 0, switch = 1) as the dependent variable and RSI and language as the fixed effects. We first analysed the two tasks separately to assess whether there was indeed an RSI effect in the cued task (which would be expected based on the task-switching literature but remains underexamined in the language-switching literature) before assessing any potential RSI effects in the voluntary task. Afterwards we conducted a final analysis across the two tasks that also included the factor Task (Voluntary = −0.5; Cued = 0.5).
2.3. Results
Cued task
Accuracy
There was a significant accuracy switching cost (see Table S2), with higher accuracy on non-switch trials (M = 95.7%, SD = 3.4) than switch trials (M = 93.1%, SD = 5.5; β = −0.573, SE = 0.086, z = −6.687, p < .001). Accuracy was higher in English (M = 95.7%, SD = 3.9) than Mandarin (M = 93.2%, SD = 5.4; β = 0.571, SE = 0.111, z = 5.146, p < .001). This interacted with trial type, reflecting that the switching cost was smaller in Mandarin (Mcost = 2.3%, SD = 3.3) than English (Mcost = 3.0%, SD = 3.3, β = −0.405, SE = 0.172, z = −2.362, p = .018). Lastly, accuracy was higher in the long RSI condition (M = 95.4%, SD = 4.6) than the short RSI condition (M = 93.5%, SD = 4.7; β = −0.470, SE = 0.124, z = −3.782, p < .001). There were no interactions with RSI (all ps > .35).
The analysis on single-language and non-switch trials showed a significant mixing cost, with higher accuracy on single-language (M = 99.0%, SD = 1.4) than non-switch trials (M = 95.7%, SD = 3.4; β = −1.502, SE = 0.188, z = −7.995, p < .001). Again, accuracy was higher in English (β = 0.588, SE = 0.205, z = 2.873, p = .004) and in the long RSI condition (β = −0.396, SE = 0.170, z = −2.323, p = .020). There were no interactions between any of the predictors (all ps > .10).
Reaction times – switching cost
There was a significant switching cost (β = 0.079, SE = 0.008, t = 9.497, p < .001), with longer RTs on switch (M = 1156.7, SD = 159.1) than non-switch trials (M = 1070.6, SD = 145.4). There was also a main effect of language (β = −0.089, SE = 0.011, t = −8.257, p < .001), reflecting shorter RTs in English (M = 1062.9, SD = 149.1) than Mandarin (M = 1163.7, SD = 154.8). Trial type interacted with language (β = 0.050, SE = 0.009, t = 5.413, p < .001), with larger costs when switching to English (Mcost = 108.7, SD = 53.5) than to Mandarin (Mcost = 59.9, SD = 72.7).
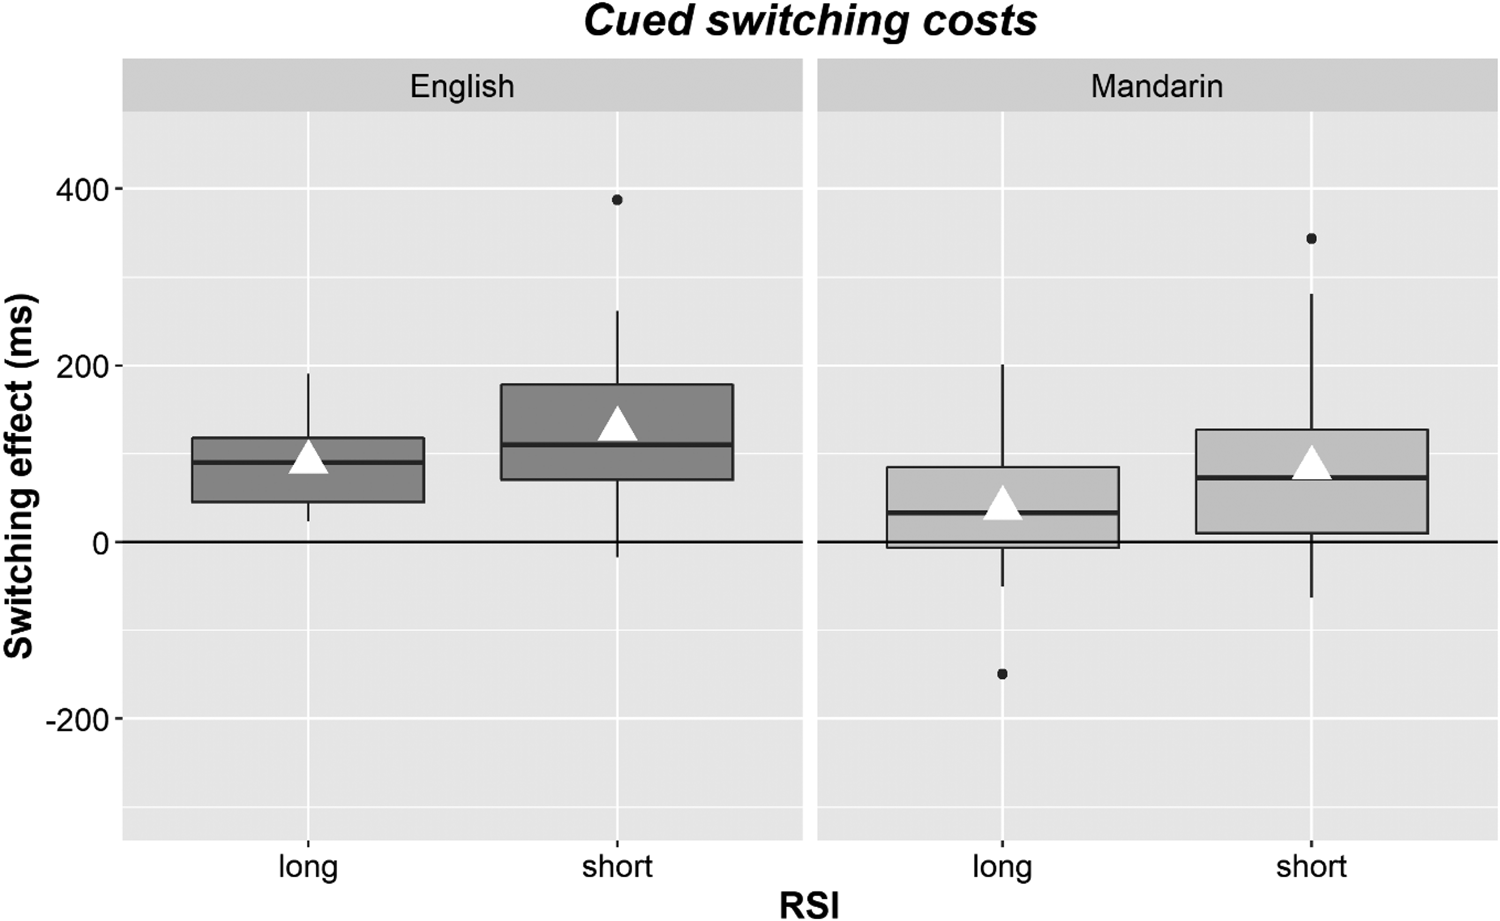
Overall RTs were similar in the long (M = 1102.9, SD = 160.7) and short RSI condition (M = 1124.4, SD = 155.5; β = 0.016, SE = 0.015, t = 1.074, p =.291). Of main interest was the interaction between RSI and trial type (β = 0.028, SE = 0.009, t = 3.140, p = .004): Switching costs were larger in the short RSI condition (Mcost = 108.3, SD = 78.0) than in the long RSI condition (Mcost = 66.2, SD = 46.4). This interaction was not modulated by language (β = 0.001, SE = 0.015, t = 0.049, p = .961) and there was no interaction between language and RSI (β = −0.010, SE = 0.009, t = −1.040, p = .307). In both languages, switching costs were larger in the short RSI condition (see Figure 1 and Table 2).
Boxplots showing the cued switching costs in English (left) and Mandarin (right) and per RSI condition (long or short). The boxplot shows the interquartile range with the black dots representing the outliers falling outside 1.5*interquartile range. The median is indicated by the horizontal black line and the centres of the white triangles show the means.
RT means (and SDs) for the cued task per trial type (single-language, non-switch, and switch), language (Mandarin and English), and RSI condition (short, long).

Reaction times – mixing cost
The mixing-cost analysis too showed an effect of language (β = −0.103, SE = 0.013, t = −7.678, p < .001), with shorter RTs in English than in Mandarin. There was a mixing cost (β = 0.203, SE = 0.013, t = 15.125, p < .001), with longer RTs on non-switch trials (M = 1070.6, SD = 145.4) than single-language trials (M = 870.6, SD = 100.9). This mixing cost did not differ between Mandarin (Mcost = 219.6, SD = 95.2) and English (Mcost = 184.5, SD = 92.3; β = −0.022, SE = 0.017, t = −1.318, p = .198, see Figure 2).
Boxplots showing the cued mixing costs in English (left) and Mandarin (right) and per RSI condition (long or short). The boxplot shows the interquartile range with the black dots representing the outliers falling outside 1.5*interquartile range. The median is indicated by the horizontal black line and the centres of the white triangles show the means.

Importantly, the mixing cost did not interact with RSI (β = 0.003, SE = 0.014, t = 0.230, p = .820) or with RSI and language (β = 0.037, SE = 0.023, t = 1.625, p = .115). The mixing cost was similar for short and long RSIs in both languages (see Figure 2 and Table 2). There was no main effect of RSI (β = 0.0004, SE = 0.013, t = 0.030, p = .977), but RSI did interact with language (β = −0.028, SE = 0.010, t = −2.865, p =.008). In Mandarin, short RSI trials (M = 1036.7, SD = 132.8) were answered somewhat more slowly than long RSI trials (M = 1024.2, SD = 141.3) while the opposite was true for English (short M = 917.4, SD = 111.9, long M = 932.4, SD = 129.0). However, the effect of RSI was not significant in either Mandarin (β = 0.014, SE = 0.014, t = 1.049, p = .303) or English (β = −0.014, SE = 0.014, t = −0.953, p = .348).
To sum up, the cued task showed significant switching and mixing costs. Switching costs were influenced by RSI, with smaller switching costs when there was more time between the response and the next stimulus. In contrast, mixing costs were not affected by RSI.
Voluntary task
Two participants produced only one or zero Mandarin non-switch trials in the short RSI condition and were removed from the analysis. Accuracy was high (all Ms > 95%) and was not analysed further.
Switching frequency
Participants used English more often than Mandarin (MEnglish use = 68.0% of included trials, SD = 11.8). On average, they switched on 31.7% of trials (SD = 11.2). Participants also produced relatively more non-switch trials in English than Mandarin, resulting in a relatively lower English switching frequency (M = 24.9%, SD = 11.7) than Mandarin frequency (M = 51.9%, SD = 13.4; β = −1.292, SE = 0.168, z = −7.706, p < .001). Switching frequencies were not modulated by RSI (main effect RSI: β = −0.095, SE = 0.061, z = −1.565, p = .118; interaction RSI x language: β = −0.053, SE = 0.135, z = −0.392, p = .695).
Reaction times - switching cost
The RT switching analysis (see Table 3) showed a main effect of trial type (β = 0.039, SE = 0.007, t = 5.286, p < .001), reflecting a switching cost with longer RTs on switch (M = 873.9, SD = 119.4) than non-switch (M = 819.5, SD = 105.5) trials. This interacted with language (β = 0.031, SE = 0.014, t = 2.173, p = .039), with larger switching costs for English (Mcost = 45.4, SD = 46.2) than Mandarin (Mcost = 24.8, SD = 75.8). Overall responses were faster in English (M = 815.1, SD = 113.3) than Mandarin (M = 884.5, SD = 112.4; β = −0.054, SE = 0.014, t = −3.900, p < .001).
RT means (and SDs) for the voluntary task per trial type (single-language, non-switch, and switch), language (Mandarin and English), and RSI condition (short, long).

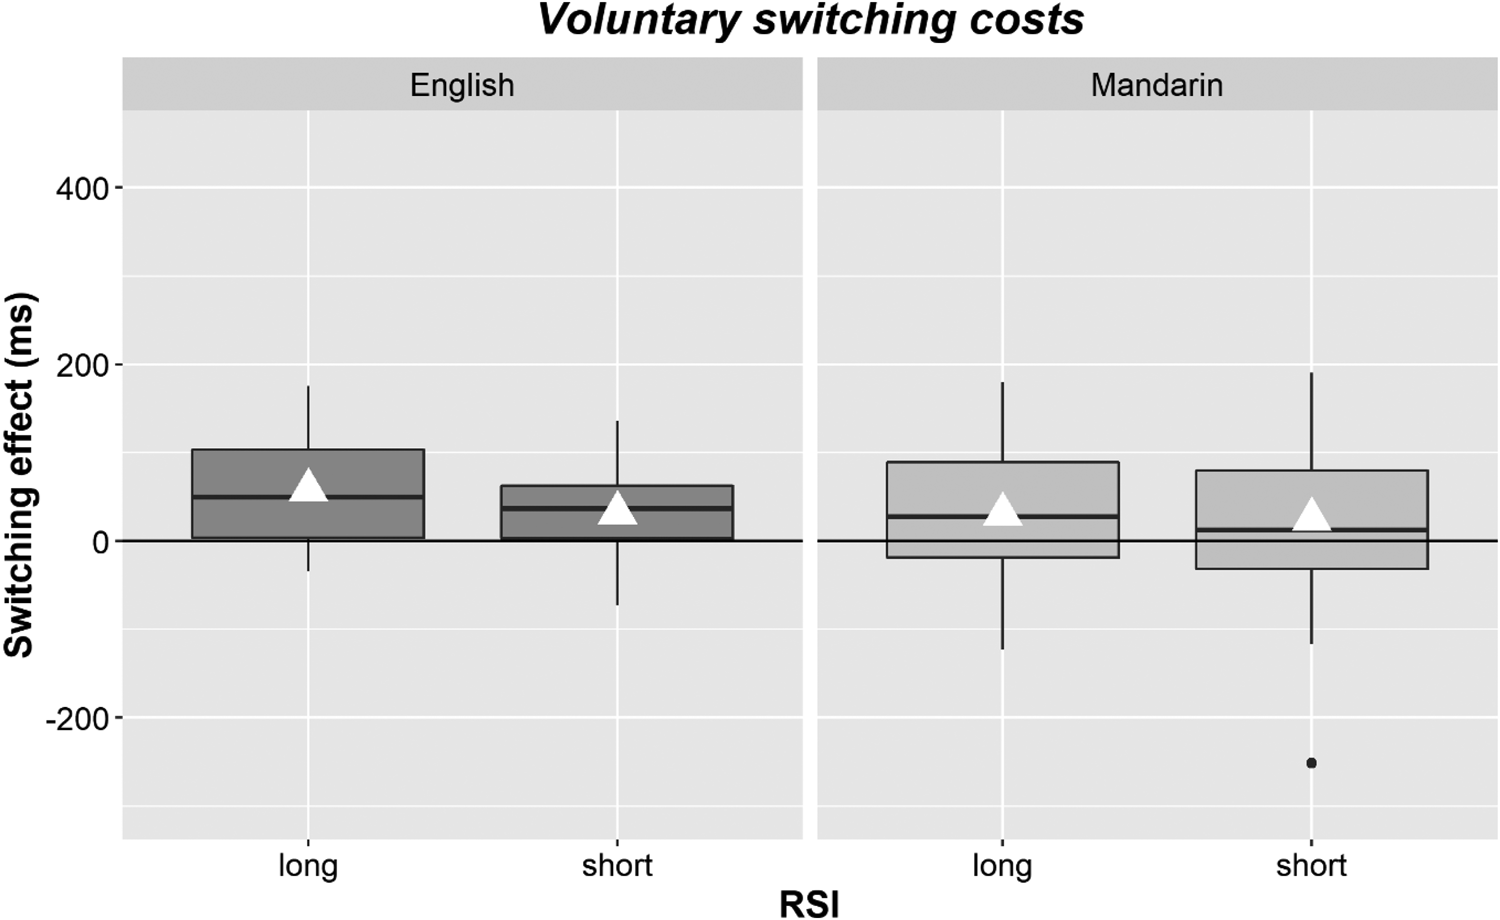
Of main interest here, there were no effects of or interactions with RSI. Overall RTs were similar in the long (M = 829.5, SD = 112.2) and short RSI conditions (M = 839.6, SD = 124.8; β = 0.006, SE = 0.021, t = 0.265, p = .793). Switching costs were similar in the long RSI (Mcost = 62.1, SD = 62.1) and short RSI condition (Mcost = 46.5, SD = 39.8; β = −0.013, SE = 0.013, t = −1.057, p = .300; see Figure 3)Footnote 2. RSI did not interact with language (β = −0.007, SE = 0.015, t = −0.499, p = .621) or with language and trial type (β = −0.017, SE = 0.020, t = −0.871, p = .392). To sum up, contrary to cued switching costs, voluntary switching costs were not modulated by RSI length.
Boxplots showing the voluntary switching costs in English (left) and Mandarin (right) and per RSI condition (long or short). The boxplot shows the interquartile range with the black dots representing the outliers falling outside 1.5*interquartile range. The median is indicated by the horizontal black line and the centres of the white triangles show the means.
Reaction times – mixing effect
Similar to the switching analysis, English responses were faster than Mandarin (β = −0.099, SE = 0.016, t = −6.137, p < .001). The main effect of trial type did not reach significance (β = −0.026, SE = 0.014, t = −1.902, p = .067) but interacted with language (β = 0.053, SE = 0.019, t = 2.832, p = .009). There was a mixing benefit in Mandarin (Mbenefit = −48.3, SD = 92.4; β = −0.051, SE = 0.018, t = −2.885, p = .008), reflecting faster responses on non-switch dual-language trials than in the single-language context. In English, there was neither a mixing benefit nor a cost (Meffect = 1.6, SD = 79.5; β = −0.0001, SE = 0.016, t = −0.004, p = .997, see Figure 4).
Boxplots showing the voluntary mixing effects in English (left) and Mandarin (right) and per RSI condition (long or short). The boxplot shows the interquartile range with the black dots representing the outliers falling outside 1.5*interquartile range. The median is indicated by the horizontal black line and the centres of the white triangles show the means.

There was no main effect of RSI (β = 0.019, SE = 0.015, t = 1.265, p = .216). There was no interaction between RSI and the mixing effect (β = −0.012, SE = 0.016, t = −0.744, p = .463), with similar mixing benefits in long (Mbenefit = −36.8, SD = 88.7) and short RSI (Mbenefit = −49.7, SD = 82.5) conditions. There was an interaction between language and RSI (β = −0.027, SE = 0.013, t = −2.148, p = .040) as well as between trial type, language, and RSI (β = 0.055, SE = 0.021, t = 2.567, p = .015). As can be seen in Table 3, this was driven by the single-language trials, which showed an RSI effect in Mandarin but not English (language x RSI: β = −0.055, SE = 0.019, t = −2.944, p = .006). Non-switch trials did not show significant RSI differences in Mandarin or English (language x RSI: β = 0.001, SE = 0.014, t = 0.078, p = .939).
Comparison between the cued and voluntary tasks: Switching cost
Comparing the cued and voluntary task showed that task and trial type interacted with RSI (β = 0.038, SE = 0.017, t = 2.242, p = .033). RSI effects on switching costs indeed differed between the cued and voluntary task. As the analyses per task show, cued switching costs were smaller after long than short RSIs while RSI did not influence voluntary switching costs. Follow-up analyses per RSI showed that cued costs were larger than voluntary costs in the short RSI condition (β = 0.054, SE = 0.015, t = 3.714, p < .001) but not in the long RSI condition (β = 0.014, SE = 0.015, t = 0.918, p = .366).
There was also a main effect of task (β = 0.254, SE = 0.027, t = 9.376, p < .001), reflecting faster responses in the voluntary than in the cued task. Language also interacted with task (β = −0.038, SE = 0.011, t = −3.444, p = .002). The language difference (faster responses in English) was larger in the cued than in the voluntary task. Furthermore, there was an interaction between task and trial type (β = 0.035, SE = 0.012, t = 2.950, p = .006), reflecting larger switching costs in the cued than voluntary task (see Tables 2 and 3). No other interactions with task were observed (all ps >.2).
Comparison between the cued and voluntary tasks: Mixing effect
There was again a main effect of task (β = 0.117, SE = 0.020, t = 5.932, p < .001), reflecting faster voluntary responses. There was also an interaction between task and the mixing effect (β = 0.230, SE = 0.021, t = 11.086, p < .001), reflecting the cued mixing cost that was absent in the voluntary task. This further interacted with language (β = −0.072, SE = 0.021, t = −3.543, p = .001), reflecting that the cued mixing costs did not differ between languages while the voluntary task showed a Mandarin mixing benefit and no effect in English. No other interactions with task were observed (all ps > .08).
2.4. Discussion
Experiment 1 compared how bilinguals switch languages during cued versus voluntary naming. Specifically, we assessed if and how switching and mixing effects were modulated by RSI (the interval between a response and the next stimulus). Both cued and voluntary switching tasks showed switching costs, which were larger in the cued task and when switching to English. In the cued task, there was furthermore an effect of RSI, with a larger switching cost when the interval was shorter. In the voluntary task, however, no effect of RSI on switching costs was observed. Mixing effects were not influenced across languages by the RSI.
Cued and voluntary switching
In line with several previous voluntary switching studies, there was a switching cost (de Bruin et al., Reference de Bruin, Samuel and Duñabeitia2018; Gollan & Ferreira, Reference Gollan and Ferreira2009; Gollan et al., Reference Gollan, Kleinman and Wierenga2014). However, this cost was larger in the cued than voluntary task. Furthermore, while the cued task showed a mixing cost, the voluntary task showed a mixing benefit in Mandarin and no mixing effect in English. These findings are in line with the Adaptive Control Hypothesis (Green & Abutalebi, Reference Green and Abutalebi2013), positing that proactive control is less needed in contexts allowing for the (opportunistic) use of two languages than in single-language contexts that require proactive control over the language currently not in use.
While the participants were more dominant in Mandarin than in English (Mandarin was their first language in terms of age of acquisition and proficiency), all conditions (including the single-language parts) showed higher accuracy and faster responses in English. Furthermore, participants used English more often than Mandarin in the voluntary task. The participants were living in a bilingual/L2-dominant environment (UK). In their daily lives, most participants used both languages often or used English more in certain environments (see Table S1). Furthermore, while a bilingual led the study, it took place within the university, an L2 context. It is likely that in this UK environment, the bilingual's L2 English was more active. As a consequence, this might have been the faster and preferred language.
This might also explain why the voluntary mixing benefit was only observed in Mandarin. Previous studies with unbalanced bilinguals (e.g., Gollan & Ferreira, Reference Gollan and Ferreira2009) have observed a mixing benefit for the less dominant language only. If English was indeed the more active language, the Mandarin single-language condition might have required relatively more proactive control over English, leading to a larger mixing benefit when this proactive control was not/less needed in free naming contexts. Furthermore, the larger switching cost to English in both tasks might have been the result of more reactive inhibition of English being needed when using Mandarin in the dual-language contexts, resulting in longer time needed to overcome this previously applied inhibition when switching back to English.
RSI effect
An RSI effect on switching costs was observed in the cued task, with smaller switching costs for longer RSIs. This is in line with task-switching studies (e.g., Rogers & Monsell, Reference Rogers and Monsell1995) and a language-switching study (Ma et al., Reference Ma, Li and Guo2016). The RSI effect on switching costs was only present in the cued task but not in the voluntary task. In the cued task, bilinguals might over-activate the language that has to be used and/or suppress the other language to control interference. When switching languages, the previous language set is no longer applicable and might interfere with the new language set. A longer RSI might have allowed for more decay of this interference. In contrast, if a more cooperative mode is employed when switching freely, in which language task schemas are shifted depending on the language preferred/accessed faster on each trial, language competition might be weaker and less language control (through activation or inhibition) might be required. As a consequence, there might be less room for previous language-set decay to make a difference, as the amount of previous language-set interference, and thus decay needed, is smaller. Furthermore, while RSI effects might occur in voluntary task switching (e.g., Arrington & Logan, Reference Arrington and Logan2004) as a consequence of preparing a task in advance, the next language cannot (always) be prepared until the image is shown. As a consequence, the voluntary language switching task would not have benefited from additional advance preparation either.
RSI did not reduce mixing effects, strongly suggesting that RSI effects are related to reactive processes involved in switching specifically. The mixing-effect analyses did show some overall-RT effects of RSI. These effects, however, were largely related to particularly long Mandarin single-language RTs in the short RSI condition. While it is unclear why this was the case, these effects were not related to dual-language use.
3. Experiment 2: Processing switches during language comprehension
3.1. Introduction
Switching in production thus might differ depending on how the switch is made (i.e., cued or voluntarily). However, another variable that might play a role is whether the switch needs to be made or processed. Most research (e.g., Spivey & Marian, Reference Spivey and Marian1999; Thierry & Wu, Reference Thierry and Wu2007) and models of bilingual comprehension (e.g., BIA, Dijkstra & Van Heuven, Reference Dijkstra and Van Heuven1998; BIA-d, Grainger, Midgley & Holcomb, Reference Grainger, Midgley and Holcomb2010; BIA+, Dijkstra & Van Heuven, Reference Dijkstra and Van Heuven2002) suggest that during comprehension too both languages are active and compete with each other. Although the way in which this competition is resolved varies, most models predict switching costs to arise during comprehension. Some studies have indeed shown switching costs in at least one language (e.g., Bultena, Dijkstra & Van Hell, Reference Bultena, Dijkstra and van Hell2015; Litcofsky & Van Hell, Reference Litcofsky and Van Hell2017; cf. Van Hell, Fernandez, Kootstra, Litcofsky & Ting, Reference Van Hell, Fernandez, Kootstra, Litcofsky and Ting2018, for a review), with cross-modal studies suggesting there is overlap between production and comprehension (e.g., Gambi & Hartsuiker, Reference Gambi and Hartsuiker2016; Peeters, Runnqvist, Bertrand & Grainger, Reference Peeters, Runnqvist, Bertrand and Grainger2014). However, other studies suggest language-control processes differ between production and comprehension (e.g., Ahn, Abbott, Rayner, Ferreira & Gollan, Reference Ahn, Abbott, Rayner, Ferreira and Gollan2020; Blanco-Elorrieta & Pylkkänen, Reference Blanco-Elorrieta and Pylkkänen2016) or do not observe any switching costs during comprehension (e.g., Declerck et al., Reference Declerck, Koch, Duñabeitia, Grainger and Stephan2019). One possible explanation is that language comprehension recruits less parallel language activation and might thus experience less interference from the previous language set. We investigated this in Experiment 2 by manipulating RSI during comprehension.
Current study
We used an animacy judgement task in which bilinguals interchangeably saw Mandarin or English words and indicated with a button press whether the word referred to a living or non-living object. Similar to Experiment 1, one part used a long RSI and one a short RSI. If comprehension-switching costs are related to interference from the previous language set, we would expect smaller switching costs in the long RSI condition. However, no effect of RSI on switching costs would suggest that language-set interference during comprehension is not substantial enough to benefit from more time for decay.
3.2. Methods
Participants
Experiment 2 was completed by 60 participants (recruited through Prolific.co). Three participants were excluded due to performing at or below chance in parts of the task (N = 2) or due to indicating having a reading impairment (N = 1). Using the fixed effect for the cued switching x RSI effect reported in Experiment 1 (β = 0.028), we ran a power analysis using simr (with 100 simulations). A sample size of 30 participants yielded over 90% power. While the original plan was to run Experiment 2 with the same participants as Experiment 1, this was disrupted by the start of the pandemic. Experiment 2 therefore had to be run online with a new group of participants and we doubled the sample size to account for potentially noisier data than in the lab.
The final 57 participants (M age = 27.4, SD = 5.5; 38 female) had (corrected-to-) normal vision and hearing and no known neurological, language, or reading impairments. Six participants reported being left handed. They gave informed consent to the study, which was approved by the Ethics Committee of the Department of Psychology at the University of York. Thirty-six participants spoke Mandarin as their first language. The other participants spoke Cantonese as their first language but also spoke Mandarin well. Participants acquired English during childhood (M age = 5.3, SD = 3.5, range = 0-15) and were living in the UK or US at the moment of testing. On average participants were 12 years old when they first moved to the UK/US but there was a wide range, with some participants born in the UK/US and others having moved in adulthood.
All participants completed a written version of the English picture-naming proficiency task (de Bruin et al., Reference de Bruin, Carreiras and Duñabeitia2017). Table 4 shows those scores and self-rated Mandarin and English proficiency and use. While most participants were not native speakers of English, on average they reported a higher proficiency in and more frequent use of English than Mandarin.
Overview of the participants’ (self-rated) proficiency and mean daily-life language use and exposure while in the UK/US, per language in Experiment 2.

*While participants were asked to make sure their scores across the two languages added up to 100%, this was not always the case, resulting in a mean combined score over 100%.
Materials
Participants completed an animacy judgement task in which they had to indicate whether a word referred to a person/animal or to an inanimate object. We selected a list of twelve items, of which six referred to living beings and six referred to inanimate objects. Fewer items were selected than in Experiment 1 to keep the number of item repetitions similar while reducing the total number of trials for the online study. The stimuli were highly frequent words and did not differ between languages (see Appendix B). All words apart from one had two characters in Mandarin; all English words were one or two syllables long.
Procedure
Participants completed the task on Gorilla.sc (Anwyl-Irvine, Massonié, Flitton, Kirkham & Evershed, Reference Anwyl-Irvine, Massonié, Flitton, Kirkham and Evershed2020). The task started with single-language practice tasks in which they saw each word once in each language (in addition to four practice items to practise the animacy judgements). This part was included to make sure participants were familiar with the animacy judgements for each item before starting the dual-language task. Given that effects of RSI were only observed on the switching, and not on the mixing, effects in Experiment 1, we did not set up the study to compare the single-language part with the dual-language part. The single-language parts were followed by the dual-language part, in which words were presented interchangeably in English and Mandarin. Language (Mandarin or English single-language practice first) and RSI condition (short or long first) were counterbalanced across participants. Instructions were presented in both languages and told participants to judge the animacy of the word regardless of the language it was presented in. After completing four practice trials, participants completed 96 experimental trials (24 English switch, 24 Mandarin switch, 24 English non-switch, 24 Mandarin non-switch) per RSI. Each item was repeated twice per condition, with lists being pseudo-randomised in a similar manner to Experiment 1. To avoid differences between the two RSI conditions depending on which one was completed first, participants completed the single-language practice blocks prior to each RSI condition. After the animacy task, participants completed the picture-naming task and questionnaire (see “Participants” section). The total study lasted approximately 25 minutes and participants could take breaks after each part.
Data analysis
Data analysis followed the same approach as Experiment 1, with the exception that the RT analysis included trials preceded by an error (as trial type could still be determined). Prior to RT analysis, 2.2% of correct trials were excluded as outliers (2.5SD above/below mean per participant and condition, plus trials faster than 300ms). All included participants passed the attention check of scoring above 75% correct. We conducted one analysis for accuracy and one for RT data, using the predictors Language (Mandarin/English), RSI (short/long), and Trial type (non-switch/switch).
3.3. Results
Accuracy
Overall accuracy was high (see Table S3). Accuracy was lower in Mandarin (M = 93.4%, SD = 7.9) than English (M = 95.3%, SD = 5.6; β = 0.333, SE = 0.147, t = 2.263, p = .024). Accuracy was higher in the long RSI condition (M = 94.7%, SD = 9.0) than in the short RSI condition (M = 94.0%, SD = 5.2; β = −0.377, SE = 0.149, t = −2.538, p = .011). Lastly, accuracy was higher on non-switch (M = 94.9%, SD = 6.0) trials than on switch trials (M = 93.8%, SD = 6.6; β = −0.206, SE = 0.088, t = −2.353, p = .019). There were no significant interactions (Language x Trial type: β = 0.169, SE = 0.177, t = 0.952, p = .341; Language x RSI: β = −0.115, SE = 0.213, t = −0.539, p = .590; Trial type x RSI: β = 0.044, SE = 0.176, t = 0.250, p = .803; Language x Trial type x RSI = β = −0.139, SE = 0.413, t = −0.336, p = .737).
Reaction times
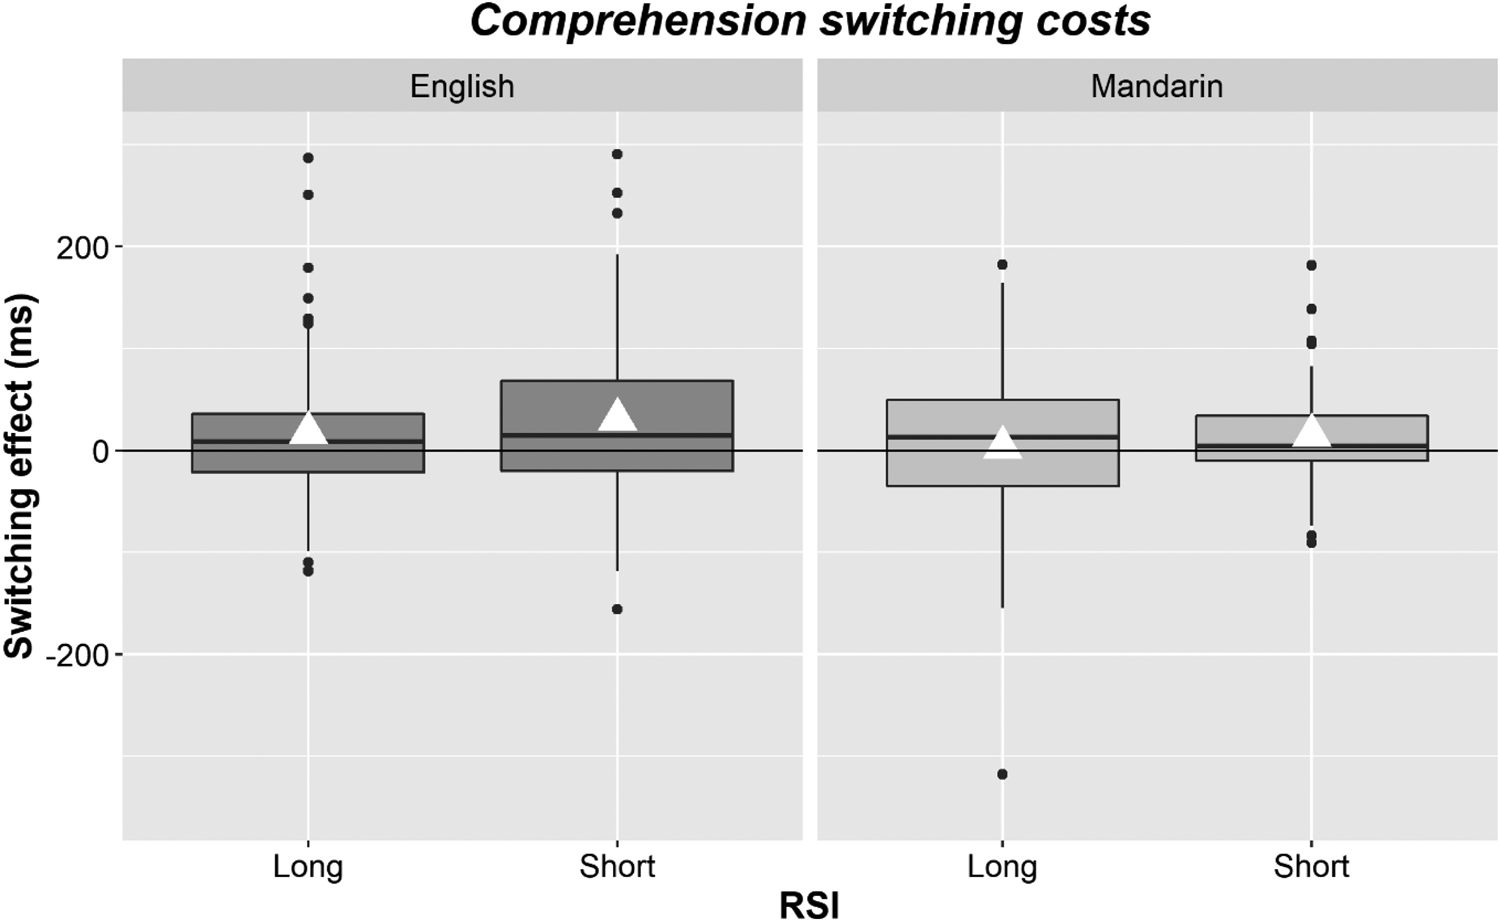
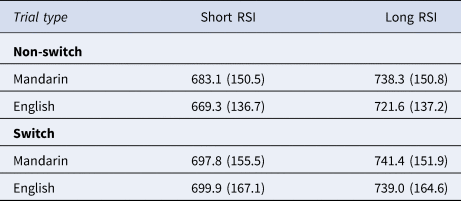
In terms of RTs (see Table 5), there was a significant effect of trial type (β = 0.022, SE = 0.010, t = 2.247, p = .044) reflecting a switching cost with slower responses on switch (M = 718.8, SD = 135.8) than non-switch trials (M = 702.4, SD = 122.1; see Figure 5). There was also a main effect of RSI (β = −0.067, SE = 0.020, t = −3.345, p = .001), with slower responses in the long (M = 734.5, SD = 139.2) than short RSI condition (M = 687.1, SD = 144.4). Of main interest was the finding that there was no interaction between RSI and trial type (β = 0.014, SE = 0.011, t = 1.331, p = .207), reflecting similar switching costs in the short and long RSI condition (see Figure 5). There were no main effects of language (β = −0.008, SE = 0.012, t = −0.718, p = .477) or interactions with language (Language x Trial type: β = 0.012, SE = 0.019, t = 0.640, p = .531; Language x RSI: β = 0.004, SE = 0.011, t = 0.335, p = .741; Language x RSI x Trial type: β = 0.006, SE = 0.018, t = 0.323, p = .748)Footnote 3.
Boxplots showing the comprehension switching costs in English (left) and Mandarin (right) and per RSI condition (long or short). The boxplot shows the interquartile range with the black dots representing the outliers falling outside 1.5*interquartile range. The median is indicated by the horizontal black line and the centres of the white triangles show the means.
RT Means (and SDs) for the comprehension task per trial type (non-switch and switch), language (Mandarin and English), and RSI condition (short, long).
3.4. Discussion
Experiment 2 assessed whether RSI influences switching costs during language comprehension. Switching costs were observed in both languages in terms of accuracy and RTs. An overall effect of RSI was observed, with slower responses in the long RSI condition, potentially because the overall pace of the task was slower. However, RSI did not interact with trial type, reflecting similar switching costs in short and long RSI conditions.
The absence of RSI effects in Experiment 2 suggests, in line with the explanation offered by Declerck et al. (Reference Declerck, Koch, Duñabeitia, Grainger and Stephan2019), that parallel language activation, and thus competition between languages, might be reduced during language comprehension. As a consequence, less time might be needed for interference from the previous trial to decay. In our study in particular, language competition might also have been reduced as a consequence of orthography being a strong language cue. Mandarin and English differ in script and the presentation of Chinese characters could have been a sufficiently strong cue to (partly) restrict language activation to Mandarin. It is possible that more parallel activation (and potentially an RSI effect) arises in languages with more similar orthographies.
However, we still observed a language-switching cost (contrary to e.g., Declerck et al., Reference Declerck, Koch, Duñabeitia, Grainger and Stephan2019, but in line with e.g., Litcofsky & Van Hell, Reference Litcofsky and Van Hell2017; Olson, Reference Olson2017). It is possible that this language-switching cost at least partly reflects a switch-cost at the orthographic level, given that switches in language also requested a switch in orthography. The different writing systems (alphabetic versus logographic script) might have allowed bilinguals to manage language activation at the lexical level but could still come at a cost during visual and/or orthographic processing, thus increasing the size of the switching cost.
4. General discussion
This study assessed switching costs during production (cued versus free naming, Experiment 1) and comprehension (Experiment 2). We manipulated the Response-Stimulus Interval (RSI) to assess how switching costs were influenced by a longer interval. All tasks showed switching costs. However, only cued-switching costs were influenced by RSI, with smaller costs in the longer RSI condition. RSI did not influence voluntary-switching costs or comprehension-switching costs.
4.1. Response-stimulus interval effects
Various explanations have been offered for RSI effects. Those related to active preparation of the next task set (cf. Rogers & Monsell, Reference Rogers and Monsell1995) are unlikely in this study due to the unpredictable order of languages/stimuli. Our RSI effects were also specifically related to RT differences on switch trials (with non-switch trials being unaffected). This suggests that the RSI influenced switching in particular (as opposed to previous research suggesting that RSI effects might be the result of task repetitions benefiting from shorter RSIs, Horoufchin et al., Reference Horoufchin, Philipp and Koch2011). Furthermore, we manipulated RSI across (and not within) blocks, thereby excluding temporal distinctiveness between the current and previous trial as the cause of RSI effects (Horoufchin et al., Reference Horoufchin, Philipp and Koch2011).
A more likely explanation (e.g., Allport et al., Reference Allport, Styles, Hsieh, Umilta and Moscovitch1994) is that the longer RSI allowed for more decay of interference from the previously used language set. Long RSIs could help with decay of activation of the previously used language or with decay of inhibition applied over the previous non-target language. Ma and colleagues (2016) suggested that longer RSIs help to reduce the latter (previously applied inhibition). Their study showed larger switching costs to Chinese than English and larger RSI effects when switching to Chinese. This suggests that the longer RSI was especially beneficial for the language that had to be suppressed more and that benefited more from time to reduce the previously applied inhibition. In our study, however, RSI effects were not modulated by language (despite an asymmetry in switching costs). This suggests that the RSI effects observed in our cued task are more likely related to decay of interference from the previously used language than from decay of previously applied inhibition over the previous non-target language. It is possible that the influence of RSI on switching might differ depending on the type of bilinguals tested (e.g., despite using the same language pairs, participants in our study were living in a more bilingual/L2-dominant environment than the participants in Ma et al., Reference Ma, Li and Guo2016). However, more research is needed to establish exactly how RSI effects on language switching might vary between bilinguals.
4.2. Language switching in different contexts and modalities
While switching costs were observed in all tasks, the different effects of RSI suggest that, at least to some extent, they might be related to different amounts or types of language interference. Following the interpretation discussed above that longer RSIs might have allowed more passive decay of activation of the previously used language, this suggests that cued switching costs might be more strongly influenced by language-set interference than voluntary or comprehension switching. The difference between cued and voluntary switching aligns with the frameworks presented by Green and Abutalebi (Reference Green and Abutalebi2013) and Green and Wei (Reference Green and Wei2014), showing that more competitive language control is used when switching in cued environments while more cooperative mechanisms are in place during free language switching. The absence of RSI effects in Experiment 2 suggests that these competitive language control mechanisms might also be less needed during comprehension, if the amount of parallel activation and competition is indeed reduced as compared to production.
While the absence of an RSI effect suggests that there might be less language competition/interference during voluntary switching, it does not necessarily mean there is no interference at all. Rather, the amount of previous-language interference might be too small to benefit from more time for passive decay. The variability observed in the relationship between RSI and voluntary switching costs could also suggest that there might be individual differences in (decay of) interference. Furthermore, switching costs remained present even in the voluntary condition and while cued costs were larger than voluntary costs in the short RSI, they were similar in the long RSI condition. This is similar to task-switching studies reporting a ‘residual’ cost (even when participants know which task is coming up in advance, e.g., Rogers & Monsell, Reference Rogers and Monsell1995). This suggests that part of the switching cost is related to interference stemming from the stimulus response itself, which cannot be prepared until participants see the picture that has to be named. While cued switching might benefit from additional time for interference from the previous language set to decay, neither the cued nor the voluntary switching task allowed participants to benefit from this time to prepare the actual response. Co-activation of words in both languages when the actual word-form is chosen might still create interference in both cued and voluntary naming, especially when switching languages.
Similarly, the absence of an RSI effect does not suggest that language competition is absent during comprehension. The presence of switching costs in Experiment 2 could support the presence of interference between languages and the need for language control to process switches, although this might be taking place (also) at the orthographical level, especially when the orthographies are dissimilar. Critically, however, in line with Declerck et al. (Reference Declerck, Koch, Duñabeitia, Grainger and Stephan2019), our findings suggest that bilinguals might experience less competition between languages when comprehending switches. Any interference from the previously used language set might have been minimal enough to have decayed even within the shortest interval between the response and next stimulus.
5. Conclusion
Bilingual switching and language control might depend on the context and modality. While switching costs were observed in different contexts (voluntary and cued naming) and modalities (production and comprehension), only cued switching costs were influenced by the interval between a response and the next stimulus. When switching in response to cues, such as interlocutors, more time might allow for more decay of interference from the previously used language set and as such might facilitate switching. In contrast, interference from the previous language set might be smaller during voluntary switching and comprehension, which may benefit less from longer intervals. This supports theories arguing that more language control is needed during cued naming than voluntary naming and during production than comprehension.
Data availability statement
The data are openly available at https://osf.io/q5ku4/ (DOI 10.17605/OSF.IO/Q5KU4)
Competing interests declaration
The authors declare none
Supplementary Material
For supplementary material accompanying this paper, visit https://doi.org/10.1017/S1366728922000554
Appendix A
Stimuli used in Experiment 1. Frequency was matched between languages in Set 1 (Mandarin M = 4.5, SD = 0.6; English M = 4.6, SD = 0.5; t(19) = −0.585, p = .565) and in Set 2 (Mandarin M = 4.6, SD = 0.7; English M = 4.6, SD = 0.5; t(19) = −0.004, p = .997) based on ZIPF log frequency (SUBTLEX-CH, Cai & Brysbaert, Reference Cai and Brysbaert2010; SUBTLEX-UK, Van Heuven, Mandera, Keuleers, & Brysbaert, Reference Van Heuven, Mandera, Keuleers and Brysbaert2014). Mean English syllable length in Set 1 was 1.6 (SD = 0.7) and 1.5 in Set 2 (SD = 0.7). Mandarin words were one or two characters long.
Mandarin and English words corresponding to the pictures shown in Experiment 1. Stimuli were divided across two sets, which were used in either the cued or switching task (counterbalanced across participants).

Appendix B
Stimuli used in Experiment 2. Stimuli did not differ significantly between languages in terms of Mandarin ZIPF frequency (M = 4.3, SD = 0.5) and English ZIPF frequency (M = 4.5, SD = 0.3, t(11) = −2.078, p = .062). The living and non-living items were also matched in terms of Mandarin frequency (t(10) = −0.676, p = .514), English Frequency (t(10) = 0.253, p = .806), and English syllables (t(10) = −1.118, p = .290). All English words were one or two syllables long (M = 1.5, SD = 0.5). All Mandarin words were one or two characters long.
Mandarin and English words used in Experiment 2


 Open access