


Introduction
Rapid anthropogenic changes in regional climates and ecosystems are expected to accelerate within this century and will likely contribute to the already elevated extinction rates observed in recent years (Ceballos et al., Reference Ceballos, Ehrlich, Barnosky, García, Pringle and Palmer2015). Mitigating these negative effects on global biodiversity necessitates a deep understanding of how taxa respond to the types of environmental changes that are projected in the future. Vertebrate taxa exhibit diverse life histories and adaptations that enable them to respond to environmental changes; however, evidence indicates a general decline in their resilience, particularly as the number of environmental threats increases (Capdevila et al., Reference Capdevila, Noviello, McRae, Freeman and Clements2022). For areas of the world predicted to have rapid temperature and precipitation changes, such as the southwestern United States, mitigating biodiversity loss necessitates increasing our understanding of the degree to which biota may be resilient to such changes (Sinervo et al., Reference Sinervo, Lara Reséndiz, Miles, Lovich, Rosen, Gadsden and Gaytán2024).
Temperature is a climatic variable which plays a large role in the physiology of many organisms, and changes in temperature are expected to produce substantial responses in biota. For example, the fossil record was used to demonstrate a decrease in body mass in bison with increased temperature over the last 40,000 years in North America (Martin et al., Reference Martin, Mead and Barboza2018). We also see some evidence that rising global temperatures even within recent decades may be driving a response in taxa manifesting as a downward shift in their average body size (Gardner et al., Reference Gardner, Peters, Kearney, Joseph and Heinsohn2011). For taxa that are ectotherms, these observations are consistent with the temperature–size rule, which predicts increased growth rate for organisms under increased temperatures but at the cost of reduced growth efficiency, resulting in smaller body size at maturity (Angilletta and Dunham, Reference Angilletta and Dunham2003). Body size is an important trait for organisms that governs processes related to thermoregulation, metabolic requirements, intra- and interspecific interactions, and other life-history traits such as fecundity (Hernández‐Pacheco et al., Reference Hernández‐Pacheco, Plard, Grayson and Steiner2021). In these ways, body size has the potential to play a large role in determining resiliency to future environmental changes.
Coupled with rising temperatures, forecasted changes in global precipitation regimes also have the potential to play a large role in the persistence of biota (Iknayan and Beissinger, Reference Iknayan and Beissinger2018). This is especially a concern for organisms that have life histories deeply tied to water, because changes in water availability can have dramatic impacts on survivorship (Greenberg and Palen, Reference Greenberg and Palen2021). Many amphibians, for example, have permeable skin and eggs that require environments with high amounts of moisture. Indeed, short-term changes in precipitation patterns have been correlated with amphibian extirpations (Jaeger, Reference Jaeger1980), extinctions (Pounds and Crump, Reference Pounds and Crump1994), and dramatic changes in breeding probability (Kinkead and Otis, Reference Kinkead and Otis2007). These types of predicted climate changes are of concern in places like Texas, where increased temperature and drought severity (Banner et al., Reference Banner, Jackson, Yang, Hayhoe, Woodhouse, Gulden and Jacobs2010) will likely impact hydrophilous amphibians.
Generally, our understanding of the impacts of climate change on extant taxa over long timescales is limited, due in part to challenges in gathering long-term ecological data. One way to gain a long-term perspective on responses to climate change is by looking to the past. Paleoclimate proxies reveal that regions like Texas have experienced significant fluctuations in temperature and moisture during the Holocene (Wong et al., Reference Wong, Banner and Musgrove2015). Paleoclimate records paired with fossil data offer valuable insights into how biota responded to these climatic shifts. In this study, we used the fossil record of Ambystoma, commonly known as mole salamanders, to understand past responses to environmental changes. We provide a synthesis of published fossil occurrences of Ambystoma in the southwestern United States and northern Mexico since the late Neogene to reveal regional changes in the geographic distribution of this genus through time. Next, we examined fossil Ambystoma from Hall’s Cave, a well-dated late Pleistocene to Late Holocene fossil site in central Texas with several directly associated paleoclimate records. We used Hall’s Cave to investigate the responses of Ambystoma to environmental changes and determine the likely causes for the eventual extirpation of the genus from the region.
Our study site, Hall’s Cave, is located in Kerr County on the Edwards Plateau, an uplifted region of central and west Texas that covers nearly 97,000 km2. Hall’s Cave contains a stratigraphic sequence that spans the last 20,000 years from the late Pleistocene to the Holocene and has numerous radiocarbon dates spread throughout the sequence that provide precise constraints on the age of fossils within the deposit (Toomey, Reference Toomey1993). Today, Hall’s Cave is a single chambered sinkhole with a sloped talus entrance at its southwestern end, which likely served as the entry point for sediment accumulation. Small vertebrate fossils are numerous in the Hall’s Cave deposit, with raptor predators thought to be the primary driver of bone accumulation (Toomey, Reference Toomey1993).
Salamander fossil vertebrae from this deposit were previously identified as Ambystoma tigrinum (Parmley, Reference Parmley1988; Toomey, Reference Toomey1993). However, subsequent morphological analyses based on linear and geometric morphometrics showed that fossil vertebrae can only be confidently referred to the tiger salamander species complex (Ledesma et al., Reference Ledesma, Ayala and Kemp2022). Today, salamanders of the genus Ambystoma are no longer found near Hall’s Cave, and the genus is largely absent from Edwards Plateau (Toomey, Reference Toomey1993; Tipton et al., Reference Tipton, Hibbitts, Hibbitts, Hibbitts and Laduc2012). We used fossils of Ambystoma from Hall’s Cave to infer timing and causes of extirpation of this group based on presence/absence data and examined body-size change in Ambystoma to test our hypothesis that increasing temperature from the late Pleistocene into the Holocene resulted in an average decreased body size, supporting predictions of the temperature–size rule.
Methods
Fossil identification and compiling fossil occurrences
We identified fossil vertebrae for this study following previous research that used apomorphies and morphometric analyses to identify salamander vertebrae from Hall’s Cave as Ambystoma and likely representing the tiger salamander species complex (Ledesma et al., Reference Ledesma, Ayala and Kemp2022). Non-vertebral fossil salamander elements were not identified using an apomorphy-based framework, but they are morphologically indistinguishable from elements of modern Ambystoma in terms of shape and size; thus, we felt confident in assigning these non-vertebral fossils as likely representing Ambystoma. Furthermore, previous ancient DNA analysis of bulk bone samples from Hall’s Cave (Seersholm et al., Reference Seersholm, Werndly, Grealy, Johnson, Keenan Early, Lundelius and Winsborough2020) identified only Ambystoma and no other salamander from the deposit. All fossil Ambystoma from Hall’s Cave examined in this study are housed at the University of Texas at Austin vertebrate paleontology collections (TxVP). We tabulated the number of identified specimens (NISP) of Ambystoma fossils within the 5 cm excavation intervals of the Hall’s Cave sequence (Toomey, Reference Toomey1993).
We conducted a literature search in May 2024 for publications on fossil localities in the southwestern United States (including Texas, New Mexico, and Arizona) and northern Mexico spanning the late Neogene and Quaternary that report fossil Ambystoma. We included publications listed in Holman (Reference Holman2006) that met our geographic and temporal criteria. Our records for New Mexico and Arizona follow those published by Darcy et al. (Reference Darcy, Mead and Morgan2022). We conducted a search for Texas and Mexico localities in Google Scholar using the following keywords: “fossil” AND “salamander” OR “Ambystoma*” AND “Texas” OR “Mexico” AND “Pleistocene” OR “Holocene.” We also include some fossil localities in Texas currently under study that we verified as containing Ambystoma. References for fossil localities are provided in Supplementary Table 1.
Body-size estimation and prediction for fossils
We performed analyses in R v. 4.3.0 (R Core Team, 2023). Allometric models were generated to estimate body size based on linear measurements taken on the femora and humeri of modern-day comparative specimens with known snout–vent lengths (SVL). We measured 159 dry skeletal specimens spanning 12 different species of Ambystoma (A. annulatum, A. gracile, A. jeffersonianum, A. mabeei, A. macrodactylum, A. maculatum, A. mavortium, A. opacum, A. ordinaria, A. subsalsum, A. texanum, and A. tigrinum) from The University of Texas at El Paso Biodiversity Collections (UTEP). We imaged femora and humeri with a scale bar (units in millimeters) using a DSLR camera. The software ImageJ (v. 2.3.0/1.53q) was used to take measurements (Fig. 1a and b).
(a and b) Measurements taken on modern and fossil humeri and femora of Ambystoma. Pictured are the left femur in dorsal view (a) and the right humerus in ventral view (b). (c) Fossil humerus of Ambystoma from Hall’s Cave showing evidence of digestive corrosion. (d) Fossil femur of Ambystoma showing breakage at the distal end. Scale bar: 1 mm.

Measurement accuracy was assessed by measurements being repeated six times on 18 modern specimens and three times on 6 fossil specimens. One user (Veda Velamuri) measured all modern specimens, and one user (KJM) measured all fossil specimens. To quantify measurement differences between users, both operators measured 18 modern specimens six times. The average percent difference between users’ measurements was only 1.62%, indicating that user-related measurement error was minimal.
Bone measurements and body size (SVL) were log-transformed, and we performed ordinary least-squares regression for each type of measurement. We created linear models based on all sampled species of Ambystoma as well as models trained on only species within the tiger salamander species complex. Interestingly, some small individuals (generally smaller than 66 mm SVL and noted to be juveniles representing a larval state) belonging to the tiger salamander species complex do not have a log-linear relationship between body size and limb measurements. We removed the juveniles from the dataset because it would affect body-size predictions for fossils, none of which appeared to be juveniles based on size and ossification patterns.
We used both the genus and species-complex models to predict SVL for fossil humeri and femora assigned to Ambystoma from Hall’s Cave. We only measured femora and humeri that were not broken in a way that would preclude accurate measurements. In total, we took 244 measurements on 173 fossils including 75 humeral lengths, 111 humeral distal widths, and 57 femoral lengths. We performed 1000 random subsampling iterations of the humerus distal-width dataset to the same sample size as the femur-length dataset and generated linear regression models to test whether reconstructed trends in the humerus and femur are comparable given sample size differences. We also performed bootstrap resampling for regression models based on the femur-length dataset using the Boot function from the car package v. 3.1-2 (Fox and Weisberg, Reference Fox and Weisberg2019).
Paleoenvironmental proxies and analyses
We used 38 previously published radiocarbon dates (Cooke et al., Reference Cooke, Stern, Banner, Mack, Stafford and Toomey2003; Sun et al., Reference Sun, Shanahan, DiNezio, McKay and Roy2021) spread throughout the Hall’s Cave stratigraphic sequence to develop an age–depth model (Supplementary Fig. 1) using Bacon v. 3.2.0 (Blaauw and Christen, Reference Blaauw and Christen2011). Supplementary Figure 2 shows age uncertainty associated with NISP values and SVL reconstructions. We used previously published paleoenvironmental proxies to contextualize patterns observed in the fossil record of Ambystoma from Hall’s Cave. Paleoproxies include relative abundance values between two different gopher taxa (Thomomys and Geomys) from Hall’s Cave, whereby an increase in the relative abundance of Thomomys was used to indicate relatively shallower and drier soils, whereas an increase in the relative abundance of Geomys indicated deeper, wetter, and more friable soils (Miller, Reference Miller1964; Toomey, Reference Toomey1993). Changes in strontium isotope values (Sr87/Sr86) measured on enamel of fossil rodent teeth and hackberry (Celtis) seed remains from Hall’s Cave were also used as proxies for soil thickness (Cooke et al., Reference Cooke, Stern, Banner, Mack, Stafford and Toomey2003). We used δ13C values taken from sediment from Hall’s Cave as a proxy for the abundance of C3 versus C4 photosynthetic plants (Wicks et al., Reference Wicks, Thirumalai, Shanahan and Bell2015; Sun et al., Reference Sun, Shanahan, DiNezio, McKay and Roy2021). We used the package pastclim v. 1.2 (Leonardi et al., Reference Leonardi, Hallett, Beyer, Krapp and Manica2023) to download paleoclimate reconstructions of mean annual temperature (MAT), annual precipitation (AP), and precipitation of the wettest quarter (PWQ) for Hall’s Cave based on global circulation models (Beyer et al., Reference Beyer, Krapp and Manica2020).
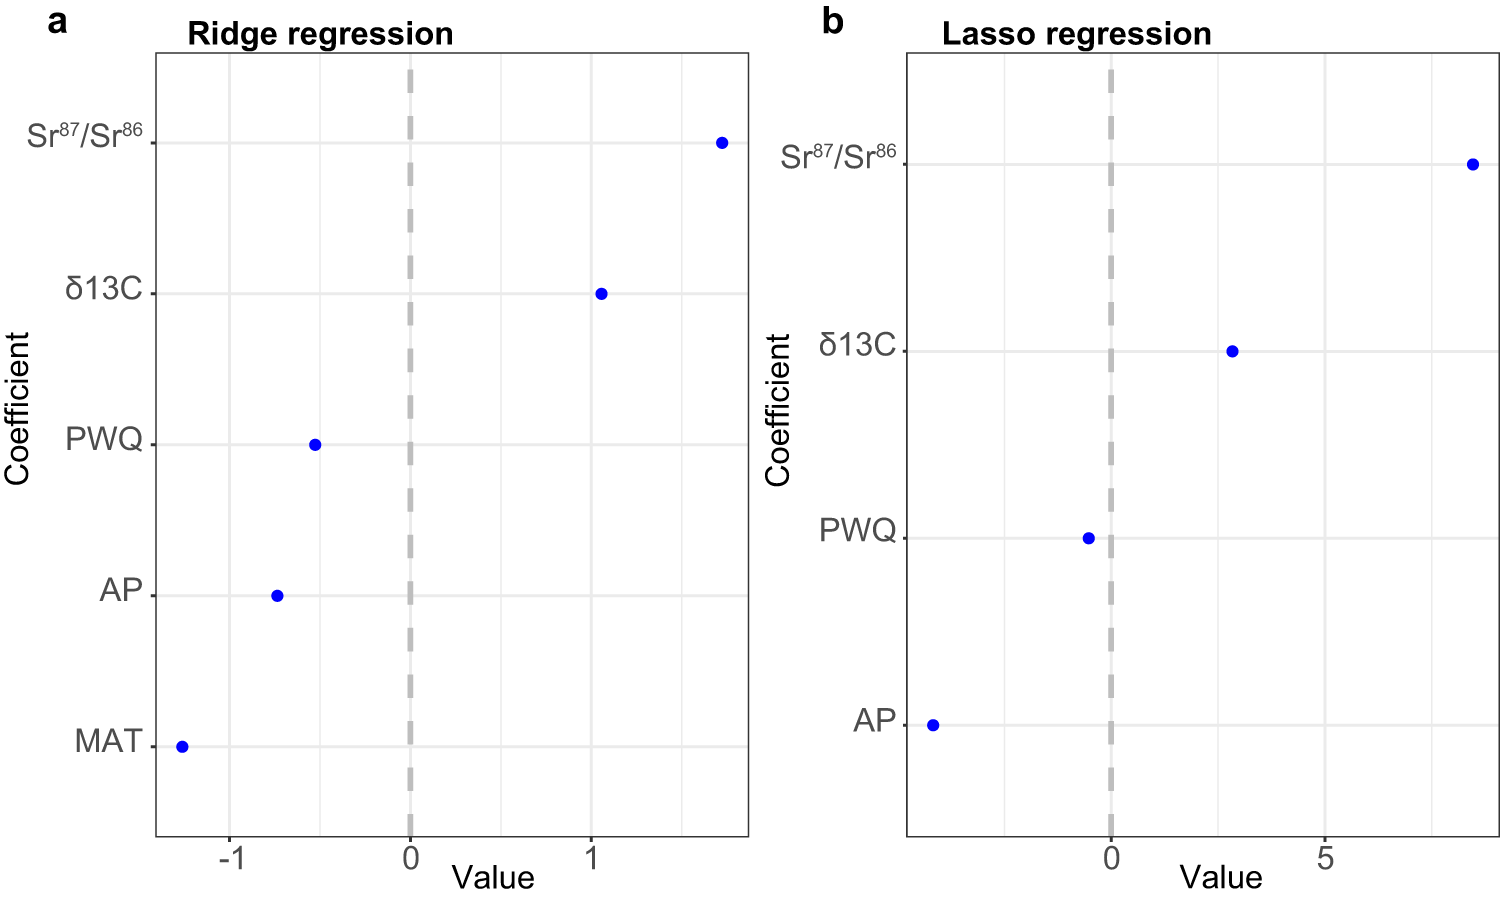
We tested whether environmental variables (MAT, AP, PWQ, δ13C, and Sr87/Sr86), which we hypothesized would influence viability of populations of Ambystoma, significantly explained the presence of Ambystoma in the Hall’s Cave sequence. We scaled variables and used Firth’s bias-reduced penalized-likelihood logistic regression (FPLR) implemented in both the logistf v. 1.26.0 (Heinze et al., Reference Heinze, Ploner, Jiricka and Steiner2023) and the brglm v. 0.7.2 (Kosmidis, Reference Kosmidis2021) packages and tested various models with variables as independent predictors and with an interaction term between δ13C and Sr87/Sr86. We only included δ13C and Sr87/Sr86 in FPLR models due to high multicollinearity with other variables. To assess the influence of variables with high amounts of multicollinearity, we used lasso and ridge penalized logistic regression in glmnet v. 4.1–8 (Friedman et al., Reference Friedman, Hastie and Tibshirani2010) and included all variables. We used cross-validation to select the lambda parameter for lasso and ridge models.
We tested our hypothesis that increasing temperature from the late Pleistocene into the Holocene led to a decrease in average body size using ordinary least-squares regression and generalized additive models (GAMs) implemented in the mgcv package v. 1.9-1 (Wood, Reference Wood2017). We first used GAMs to model paleoclimate data and estimated values for the mean reconstructed age of each interval in the Hall’s Cave sequence. We fitted linear and generalized additive models with reconstructed body size for fossils as the response variable. For linear models, we used reconstructed MAT from global circulation models as the explanatory variable. For GAM models, we included separate smoothed terms for ages of the fossils and MAT and visualized the partial effects of terms using the gratia package v. 0.8.1 (Simpson, Reference Simpson2024). We incorporated an autocorrelation moving average correlation structure to our GAM to account for temporal autocorrelation in our data. We also employed a Bayesian posterior change analysis using the bcp package v. 4.0.3 (Erdman and Emerson, Reference Erdman and Emerson2007) to determine whether we could identify time periods when there was a shift in body size. All data and code used to reproduce results can be found in the Supplementary Material (Supplementary Spreadsheet 1) and at https://doi.org/10.5281/zenodo.15213456.
Results
Regional changes in distribution
The fossil record of Ambystoma from the southwestern United States and northern Mexico documents substantial range reduction since the Pleistocene. Our literature search revealed several Pleistocene localities that contain Ambystoma spread across the Edwards Plateau (Fig. 2). Additional extralimital records of Ambystoma occur at Pleistocene localities in Mexico, including localities in the states of Sonora (Mead, Reference Mead2022) and Chihuahua (Messing, Reference Messing1986). Most fossil localities containing Ambystoma that we discovered in our search are Pleistocene in age. We found no fossil localities that contain Ambystoma that span the earliest Pleistocene and Pliocene in northern Mexico, only 1 site of this age in Texas, and 10 sites of this age in New Mexico and Arizona (Darcy et al., Reference Darcy, Mead and Morgan2022).
Late Neogene age fossils localities in the southwestern United States and northern Mexico reported to contain fossil Ambystoma plotted on top of the modern geographic range of Ambystoma in these regions (GBIF.org., 2024). Fossil deposits are colored by age with North American Land Mammal Ages shown in parentheses. U.S. and Mexico state boundaries are shown as well as ecoregions within Texas, including the Edwards Plateau (marked by increased line width) in the central portion of Texas. Numbers denote fossil localities: 1, Illusion Lake site; 2, Phillips Cave; 3, Fowlkes Cave; 4, Clear Creek Fauna; 5, Ray Roberts Lake; 6, Carrol Creek Local Fauna; 7, Schulze Cave Fauna; 8, Avenue Local Fauna; 9, Ben Franklin Local Fauna; 10, Macy Locality 100; 11, Howard Ranch Local Fauna; 12, Sims Bayou Fauna; 13, Coffee Ranch; 14, Sierra Diablo Cave; 15, Hall’s Cave; 16, Vera Local Fauna; 17, Seymour Formation; 18, Miller’s Cave; 19, Lubbock Lake site; 20, Slaton Local Fauna; 21, Zesch Cave; 22, Beck Ranch Local Fauna; 23, Tonk Creek; 24, Fyllan Cave; 25, Inner Space Cavern; 26, Jimenez Cave; 27, Térapa Local Fauna; 28, 111 Ranch; 29, Benson; 30, California Wash; 31, Clarkdale; 32, Curtis Ranch; 33, Verde; 34, Buckhorn; 35, Caballo; 36, Kelly Canyon; 37, “La Union, South microsite”; 38, SAM Cave (San Antonio Mountain); 39, Papago Springs; 40, Pit Stop Quarry; 41, Pyeatt Cave; 42, Show Low; 43, Casados Ranch; 44, Dry Cave; 45, Howell’s Ridge Cave; 46, Lake Estancia; 47, Pendejo Cave; 48, Sheep Camp Shelter; 49, Tramperos Creek; 50, U-Bar Cave; 51, Lake San Agustín: C-N Lake; 52, Lake San Agustín: Very Large Array; 53, Lake San Agustín: White Lake; 54, Easley Ranch Local Fauna; 55, Seminole Sink. References for sites are in Supplementary Table 1.

Ambystoma persistence from Hall’s Cave
We recovered 3433 salamander fossils from Hall’s Cave. Most of those fossils (n = 2456) are vertebrae. Besides vertebrae, we recovered fossils spanning 20 other skeletal elements (Table 1). Ambystoma are present throughout the Hall’s Cave sequence from more than 20,000 years before present (yr) until about 5338 yr (Fig. 3a). The number of salamander fossils within levels ranges from a single fossil to more than 300. Holocene-aged levels generally contain fewer fossils of Ambystoma compared with Pleistocene levels. Concurrent with the last known fossil occurrence of Ambystoma from Hall’s Cave, there is a shift in the strontium isotopic values based on plant and faunal remains from Hall’s Cave (Fig. 3b and c) indicative of shallow soil depths similar to those near Hall’s Cave today (Cooke et al., Reference Cooke, Stern, Banner, Mack, Stafford and Toomey2003). The region around Hall’s Cave is reconstructed with relatively low AP from the Early to Middle Holocene leading up to the last fossil occurrence of Ambystoma (Fig. 3d). Model selection for FPLR using Akaike information criterion (AIC) slightly favored a model with Sr87/Sr86 and δ13C as independent predictors implemented in the brglm package, while a model with only δ13C was favored in logistf (Table 2). However, the model with Sr87/Sr86 and δ13C as independent predictors was favored over the model with only δ13C in a penalized-likelihood ratio test. The difference between model selection criteria is likely a result of the penalty that AIC places on additional terms in the model. Our model with an interaction between Sr87/Sr86 and δ13C was favored using a penalized-likelihood ratio test and AIC differences between models with and without an interaction term was small (<3). Models with Sr87/Sr86 and δ13C as independent predictors have both variables as significant (P < 0.05), and models including an interaction term have Sr87/Sr86 and the interaction between the two variables as significant predictors (P < 0.05). Our FPLR model with independent variables predicts decreased probability of presence with lower values of Sr87/Sr86 and δ13C independently, and the model with an interaction term predicts decreased probability of presence with lower values of Sr87/Sr86 given low δ13C values (Supplementary Fig. 3). Both lasso and ridge penalized logistic regression illustrate a large effect of Sr87/Sr86 on presence, followed by δ13C and AP (Fig. 4). MAT was shown to have a large effect in ridge regression, but its coefficient was shrunk to zero in lasso regression. This is likely a result of the fact that when variables are correlated, lasso regression tends to select one and shrink others, and MAT is highly correlated with Sr87/Sr86.
(a) Persistence and abundance of fossils identified as Ambystoma throughout the Hall’s Cave sequence. Area plot shows the square root of the total number of identified specimens (NISP) for each level. (b) Strontium isotope values taken from plant and rodent remains from Hall’s Cave (Cooke et al., Reference Cooke, Stern, Banner, Mack, Stafford and Toomey2003). (c) Relative abundance of gopher taxa in the Hall’s Cave sequence (Toomey, Reference Toomey1993). (d) Annual precipitation (AP) for the region around Hall’s Cave based on reconstruction from global circulation models (Beyer et al., Reference Beyer, Krapp and Manica2020).

Results of our ridge (a) and lasso (b) penalized regressions showing the relative strength and contribution of different variables, indicated by their coefficients, to the presence of Ambystoma in the Hall’s Cave deposit.

The number of identified specimens assigned to Ambystoma for each salamander element recovered from Hall’s Cave, Texas.a

a NISP, number of identified specimens.
Model comparison and selection criteria for penalized-likelihood logistic regression models implemented in two R packages.

a AIC, Akaike information criterion.
Body-size predictions
The mean standard deviation of repeated measurements on modern specimens was 0.136 mm for the humerus total length, 0.053 mm for the humerus distal width, and 0.107 mm for the femur total length. The average relative standard deviation was small for modern measurements (1.49–2.5%), indicating consistency between measurements. Measurements on fossil specimens also showed high consistency, with mean standard deviation of repeated measurements being 0.190 mm for the humerus total length, 0.065 mm for the humerus distal width, and 0.145 mm for the femur total length.
We found that measurements taken on the humerus and femur displayed a significant linear relationship with body size for our dataset of modern comparative specimens (P < 0.05). Models estimating body size using only species within the tiger salamander species complex had a lower mean squared error compared with models based on all species of Ambystoma in our dataset. Models for the humerus and femur length using all species of Ambystoma produced SVL predictions for fossils that were on average 8 to 10 mm smaller compared with models based on the tiger salamander species complex. Body-size predictions based on fossil humerus distal widths were similar using all species or only the tiger salamander subset. All body-size predictions for fossils using the tiger salamander species complex had greater interquartile ranges, indicating more spread in body-size predictions. SVL predictions for fossils from these models were used to test our hypothesis on the relationship between temperature and body size. We tested whether reconstructed body-size trends in the fossil record were dependent on whether we used predictive models trained on all species or models trained on only species in the tiger salamander complex. However, we found that using predictions from either model did not change our interpretations of temperature and body-size relationships (Supplementary Fig. 4), so we focused on predictions from the tiger salamander model.
Temperature and body-size relationship
Linear models using all left and right elements reconstructed a significant inverse relationship between MAT and body size as predicted by the distal width of the humerus (df = 109, F = 5.224, P = 0.024). For linear models using only left or right fossil elements, only body-size predictions based on the left humerus distal width resulted in a significant inverse relationship between MAT and body size (df = 53, F = 4.493, P = 0.0387). Body-size predictions based on the humerus length and femur length did not have a significant relationship with MAT (Fig. 5a). Fewer specimens could be measured for the femur length (n = 57) compared with either the humerus length (n = 75) or humerus distal width (n = 111). In nearly all models in which we performed random subsampling of body-size predictions based on the humerus distal width, there was an inverse relationship between body size and MAT, indicating that the relationship reconstructed based on the humerus distal width is robust. Further, our bootstrap resampling for the regression model based on the femur-length dataset did not yield any significant relationships between body size and temperature, indicating that different relationships between temperature and body size as reconstructed from the humerus and femur likely are not driven solely by sample size differences.
Results from models testing the effects of temperature on body size. (a) Linear models showing fitted relationship between temperature and body size (measured as snout–vent length [SVL]) with 95% confidence intervals shaded in gray. (b) Results from our generalized additive model (GAM) showing partial effects of mean annual temperature (MAT) on body size as reconstructed based on the three different measurements taken on fossil Ambystoma from Hall’s Cave. Blue dots show partial residuals, 95% confidence intervals are shaded in gray, and tick marks at the bottoms of plots show values of MAT incorporated into the model.

For our GAM, an autoregressive model of P order two was selected as the best-fitting model. A MAT smoothed term significantly explained body-size predictions based on the humerus distal width and humerus length. Our GAMs incorporating body-size reconstructions based on the humerus distal width and humerus length showed a significant negative partial effect on body size associated with higher MAT (Fig. 5b). There was no significant partial effect of temperature on body-size reconstructions based on the femur length.
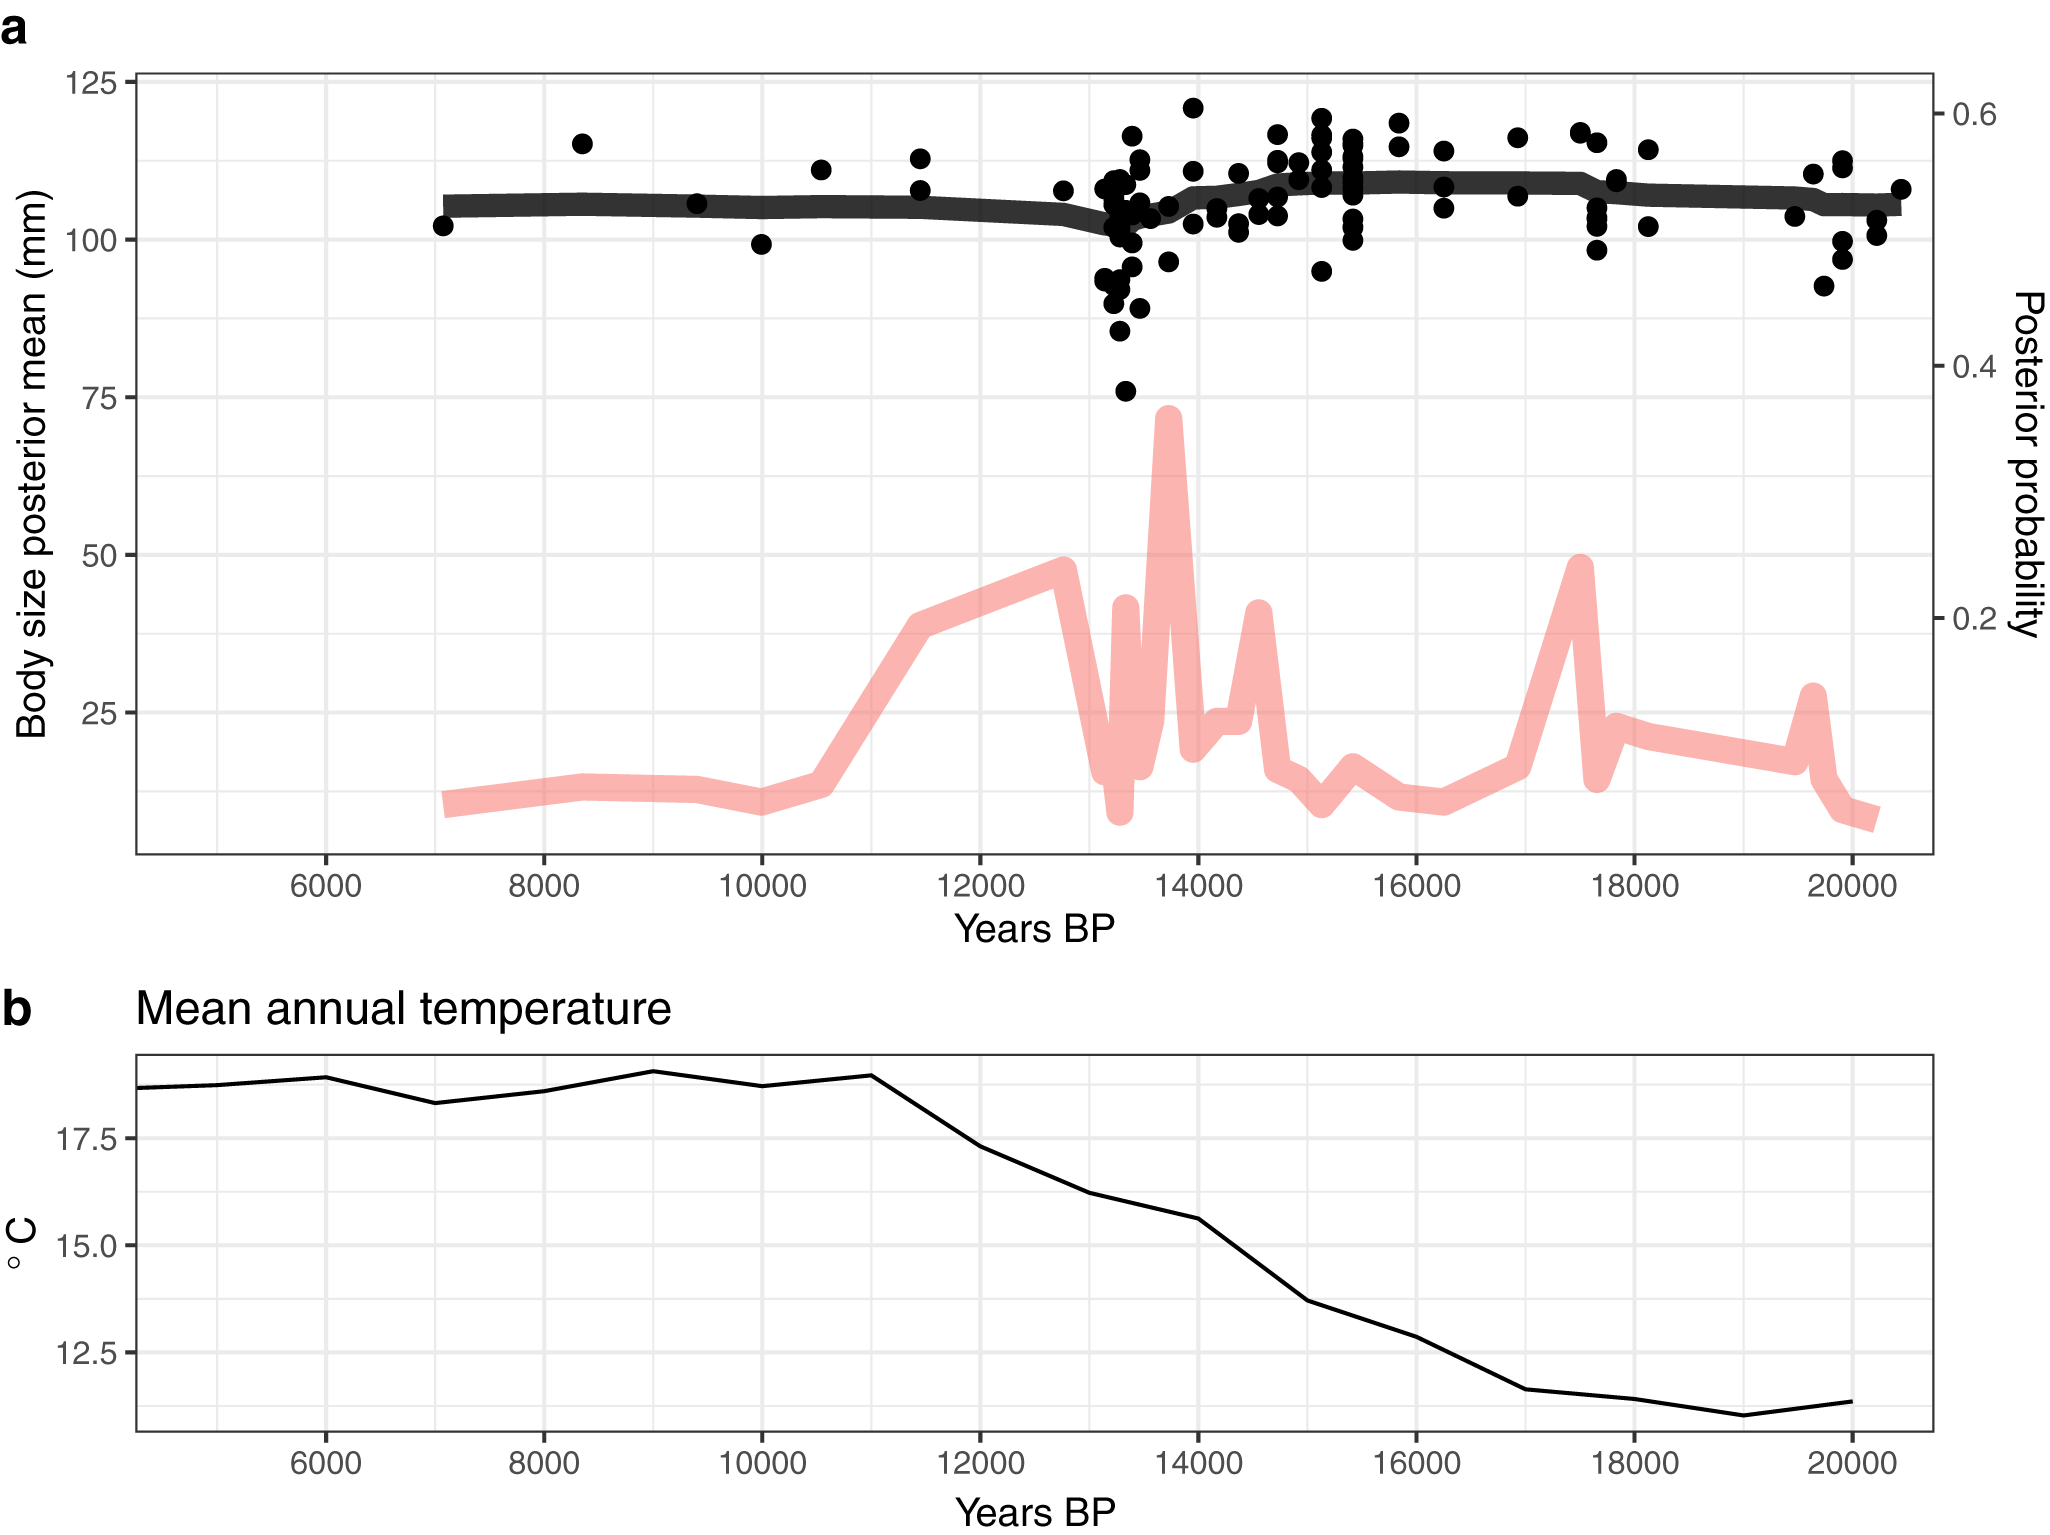
A Bayesian posterior change point analysis of body size reconstructed from the humerus distal width recovered the highest posterior probability of a change point around 13,700 yr; however, the posterior probabilities for any change point occurring were relatively low for all intervals (Fig. 6). The change point identified at 13,700 yr occurs during warming reconstructed for Hall’s Cave during the Bølling–Allerød interstadial and is associated with a change in the posterior mean body size from approximately 118 mm before the start of the Bølling–Allerød interstadial (∼14,690 yr) to 112 mm at the end of the Bølling–Allerød interstadial (∼12,890 yr). This time period is associated with a 2°C change in MAT from the region around Hall’s Cave. Our change point analysis did not identify any substantial changes in body size with increased warming into the Holocene.
Results from our Bayesian posterior change point analysis of body size reconstructed from the humerus distal width contextualized with mean annual temperature (MAT) reconstructed for the region around Hall’s Cave. (a) Body-size posterior mean trend plotted as a black line surrounded by dots representing body-size reconstructions for fossils. The posterior probability of a change point occurring at a particular time is plotted at the bottom as a pink line. (b) MAT reconstructed for the region around Hall’s Cave based on global circulation models (Beyer et al., Reference Beyer, Krapp and Manica2020).

Discussion
Today, 15 of the 32 recognized species of Ambystoma are evaluated as being threatened with extinction, and risks associated with climate change are listed as a reason for concern for several species (IUCN, 2024). For one subspecies in southern Arizona (Ambystoma mavortium stebbinsi) that has state and federal protections, models predict that future climate change will drive this subspecies to extinction (Sinervo et al., Reference Sinervo, Lara Reséndiz, Miles, Lovich, Rosen, Gadsden and Gaytán2024). In fact, climate change is predicted to negatively impact populations of Ambystoma across the southwestern United States (Sinervo et al., Reference Sinervo, Lara Reséndiz, Miles, Lovich, Rosen, Gadsden and Gaytán2024). Long-term data are especially useful for increasing our understanding of biotic responses to climate change (Jones and Driscoll, Reference Jones and Driscoll2022) and here we show that the fossil record provides useful insights into the long-term responses of Ambystoma to rapid and drastic environmental changes.
Last known occurrence and taphonomy
Our results show that salamanders of the genus Ambystoma underwent substantial changes in geographic distribution since the Pleistocene. Our literature search revealed both open-air and cave sites that contained fossil Ambystoma; however, fossil sites containing Ambystoma on the Edwards Plateau are all from cave settings. Caves likely have a higher probability of preserving small and fragile salamander bones compared with many open-air sites; however, certain open-air deposit, such as sinks with permanent or semi-permanent water, are known to preserve high numbers of fossil Ambystoma (Tihen, Reference Tihen1942). Further investigation into these types of sites may provide additional information on the past distribution of Ambystoma. Although there are several records of Ambystoma in central Texas on the Edwards Plateau from the Pleistocene, Ambystoma are only found on the edges of the plateau today (Fig. 2). Hall’s Cave records the last known fossil occurrence of Ambystoma in the central portion of the Edwards Plateau dated to approximately 5000 yr. Of course, the last known occurrence of a taxon in the fossil record does not always temporally correspond to the last occurrence of that taxon in the region (Signor and Lipps, Reference Signor, Lipps, Silver and Schultz1982; Walsh, Reference Walsh1998), but there are some reasons why the last fossil occurrence of Ambystoma at Hall’s Cave may represent the last occurrences of that taxon in the region. We made considerable efforts to sample fossil salamander material from Hall’s Cave. Although previous efforts were made to identify and catalog fossil Ambystoma from Hall’s Cave, not all levels were sampled, and only fossil vertebrae were cataloged (Toomey, Reference Toomey1993). Hall’s Cave was excavated in six separate pits, and we examined all levels from three of these pits (1, 1A, and 1B) as well as previously picked material from all other pits. This allowed us to rigorously sample an interval that spanned the last fossil occurrence of Ambystoma. We focused on identifying all salamander fossil elements from these pits to increase our confidence that we are capturing the last occurrence for Ambystoma across multiple excavation pits.
The continued persistence of small herpetofauna fossils throughout the Holocene portions of Hall’s Cave (Toomey, Reference Toomey1993) is consistent with the interpretation that Ambystoma became extirpated in the Middle Holocene, versus being absent because of shifting taphonomic processes. These other herpetofauna are similar in size to Ambystoma, and their remains were likely deposited in Hall’s Cave through raptor predation, which was considered the primary source of small animal remains in the cave (Toomey, Reference Toomey1993). It was previously suggested that the presence of fossil Ambystoma from Hall’s Cave may have been a result of the salamanders inhabiting the cave in the past (Toomey, Reference Toomey1993). If Ambystoma did enter and inhabit the cave in the past, a concern would be the possibility that these adeptly fossorial salamanders burrowed into the sediment, causing mixing between layers. Evidence of burrowing was found in Hall’s Cave (Toomey, Reference Toomey1993), and burrow morphology is at least somewhat similar to that reported for species of Ambystoma (Dzenowski and Hembree, Reference Dzenowski, Hembree, Hembree, Platt and Smith2014). Although many fossil elements of Ambystoma are relatively complete, they often exhibit breakage patterns similar to those caused by certain raptor predators on amphibian bones (Pinto Llona and Andrews, Reference Pinto Llona and Andrews1999). For example, the complete total length could be measured for only 57 of the 203 humeri identified as Ambystoma in the deposit. Further, some fossil Ambystoma show evidence of breakage and digestion consistent with those seen on raptor prey items (Fig. 1c and d). If fossil accumulation of Ambystoma from Hall’s Cave was primarily driven by salamanders living within the cave, we would expect a relatively higher occurrence rate of complete fossils, because they would not be subjected to as many taphonomic variables, as well as a more equal abundance of cranial elements relative to the postcrania. It is possible that some Ambystoma found their way into the cave, using it as a cooler or wetter refuge and subsequently died and were buried. However, for the reasons previously presented, this does not seem to be the primary mode of accumulation of Ambystoma fossils in the cave.
Role of climate in extirpation
Decreased soil depth and/or drying of soils was previously hypothesized to play an important role in the extirpation of Ambystoma from the region around Hall’s Cave (Toomey, Reference Toomey1993). Results of our FPLR models support the idea that decreased soil depth played a significant role in the disappearance of Ambystoma. Elevated rates of erosion reconstructed based on titanium values from Hall’s Cave sediment mark the beginning of soil denudation around 15,000 yr (Sun et al., Reference Sun, Shanahan, DiNezio, McKay and Roy2021). Strontium isotope values from plant and rodent remains indicate soils reached modern thickness values by at least 5000 yr. However, Sr87/Sr86 values from hackberries dating as far back as 11,000 yr, predating the last occurrence of Ambystoma, are consistent with values for modern trees rooted in limestone bedrock (Cooke et al., Reference Cooke, Stern, Banner, Mack, Stafford and Toomey2003). Several burrowing species (e.g., the eastern mole [Scalopus aquaticus] and at least one species of gopher in the genus Geomys) disappeared from the Hall’s Cave record as soils in the region became progressively shallower (Toomey, Reference Toomey1993; Jass et al., Reference Jass, Poteet and Bell2015). During the Middle Holocene, an increase in the relative abundance of the gopher genus Thomomys, a taxon associated with relatively shallower and drier soils, was used to support the role that changes in soil thickness had in driving the loss of burrowing species (Toomey, Reference Toomey1993). However, the fact that some mesic fossorial taxa (e.g., the woodland vole [Microtus pinetorum] and gophers of the genus Geomys) persist and increase in relative abundance in the Late Holocene during a return to wetter times was used as evidence to support the relatively greater importance of soil moisture for governing the presence of these taxa (Toomey, Reference Toomey1993). In fact, Geomys were extirpated only recently from the region, likely as a consequence of historic anthropogenic landscape modifications and soil erosion caused by the overgrazing of livestock (Semken, Reference Semken1961; Toomey, Reference Toomey1993). Despite the reconstructed changes in soil depth, the disappearance of burrowing taxa from Hall’s Cave during the Middle Holocene like the eastern mole, the Texas kangaroo rat (Dipodomys elator), and Ambystoma was instead hypothesized to be mainly a result of the relatively drier soils available during that time (Toomey, Reference Toomey1993). Ambystoma, however, are known to occur in soils that are equally as dry as or drier than those found on the Edwards Plateau today. In modern populations of Ambystoma talpoideum, decreased soil moisture was not related to risk of desiccation; instead, increased mortality was associated with elevated temperature and decreased vegetation cover (Rothermel and Luhring, Reference Rothermel and Luhring2005). These observations suggest decreased soil moisture alone may not have played a large role in the extirpation of Ambystoma from the region around Hall’s Cave.
Another possible soil factor leading to the extirpation of Ambystoma could be changes in soil texture. An increased relative abundance of the gopher genus Thomomys during the Middle Holocene was used to reconstruct a change in soil texture from predominantly loamy to a more clay-rich or rocky soil (Toomey, Reference Toomey1993). Although changes in soil texture may affect the burrowing ability of Ambystoma, these salamanders are also known to utilize the burrows of other animals, including those of Thomomys (Kolbe et al., Reference Kolbe, Smith and Browing2002; Cook et al., Reference Cook, Trenham and Northen2006). In other regions, modern Ambystoma are known to utilize the burrows of species of mammals that are found throughout the Hall’s Cave sequence as well as on the Edwards Plateau today (Cook et al., Reference Cook, Trenham and Northen2006). If suitable subterranean habitat was available to Ambystoma throughout the Holocene, then it stands to reason that factors other than soil depth, changes in soil moisture, or changes in soil texture contributed to their eventual extirpation. In fact, our models suggest that other environmental variables such as MAT and AP played a role in the disappearance of Ambystoma.
Wetland habitat, perhaps in the form of shallow depressions, was previously hypothesized to be present on the landscape around Hall’s Cave, as indicated by the presence of fossil remains of taxa such as waterfowl and shorebirds (Toomey, Reference Toomey1993). During the Middle Holocene, AP values exhibit some of their lowest values in the last 20,000 years. Increased temperature during this time would mean that moisture on the landscape was likely limited, with shorter hydroperiods of semi-permanent water features. This environmental interpretation is concordant with paleoenvironmental reconstructions based on pollen and faunal data from Hall’s Cave, which indicate a landscape dominated by shortgrass or desert grassland (Toomey, Reference Toomey1993; Cordova and Johnson, Reference Cordova and Johnson2019). The δ13C values during this time support the presence of C4-dominated vegetation cover during the Early to Middle Holocene. Our FLPR models predict decreased probability of presence of Ambystoma under C3-dominated vegetation regimes, although with high uncertainty (Supplementary Fig. 3). Similarly, our lasso and ridge regression recovers decreased probability of presence of Ambystoma with increased AP (Fig. 4a and b). These predictions are likely because Ambystoma are absent in Late Holocene intervals when there was a return to a wetter C3-dominated landscape, yet Ambystoma are present during late Pleistocene intervals characterized by high AP and C3-dominated vegetation. A possible explanation for this pattern includes extirpation of Ambystoma when the landscape was more arid and dominated by C4 plants during the Middle Holocene, with subsequent failure to recolonize the area despite a return to wetter conditions in the Late Holocene. This explanation is consistent with the decreased number of fossils of Ambystoma in the Holocene compared with the Pleistocene. Another possibility is that rapid vegetation shifts during the Early and Middle Holocene contributed to extirpation. In modern studies, vegetation cover was demonstrated to be an important variable for maintaining amphibian biodiversity (Venne et al., Reference Venne, Tsai, Cox, Smith and McMurry2012). In addition to providing habitat, protection, and food resources, vegetation may also help maintain longer hydroperiods in water sources, for example, by providing shade.
The availability of semi-permanent water features is important for the reproduction of species of Ambystoma that lay their eggs in water and require water for their aquatic larval development stage lasting up to several months. Modern experiments show that faster drying times for water features with larval Ambystoma were associated with increased mortality (Semlitsch, Reference Semlitsch1983), and increased desiccation was associated with warmer and more open environments (Rothermel and Luhring, Reference Rothermel and Luhring2005). In other dry areas with seasonal water sources, Ambystoma were found to have a high risk of mortality due to desiccation (Brocka, Reference Brocka2020). Although modern species of Ambystoma are known to disperse up to 900 m away from important breeding water sources, that distance on the arid landscape of southern Arizona was not sufficient for salamanders to reach other aquatic breeding areas, suggesting a highly fragmented population in this region (Brocka, Reference Brocka2020). Furthermore, increased travel distance from water sources was associated with increased risk of mortality (Brocka, Reference Brocka2020). If the landscape around Hall’s Cave was as dry, hot, and open in the Middle Holocene as paleoclimate records suggest, then it is likely that both larval and adult Ambystoma would have had high risks of mortality due to desiccation. Furthermore, other species from Hall’s Cave associated with relatively wetter conditions (e.g., the southern short-tailed shrew [Blarina carolinensis] and the tricolored bat [Perimyotis subflavus]) exhibit a decreased abundance in the fossil record in the Early to Middle Holocene similar to the pattern observed for Ambystoma (Toomey, Reference Toomey1993).
The hypothesis that water availability played a role in driving patterns of extirpation of Ambystoma is strengthened by the occurrence of fossil records of Ambystoma in relatively dry areas of northern Mexico where Ambystoma are not reported today. Jiménez Cave in Chihuahua, Mexico, contains fossil Ambystoma and also contains fauna (e.g., waterbirds and meadow vole [Microtus pennsylvanicus]) that suggest a previously more mesic environment (Messing, Reference Messing1986). Cave Without a Name, a fossil site in Kendall County, Texas, that is near Hall’s Cave, is likely contemporaneous with Hall’s Cave based on a reported radiocarbon date of around 10,980 ± 190 cal yr BP (Holman, Reference Holman1968). However, there are no Ambystoma reported from Cave Without a Name; instead, salamanders of the genus Plethodon are reported (Holman, Reference Holman1968). Species of Plethodon that inhabit the Edwards Plateau today do not have an aquatic larval stage and are therefore not as tied to the length of the hydroperiod in the region. The absence of Ambystoma from Cave Without a Name suggests that populations of Ambystoma were not ubiquitous on the landscape, consistent with the hypothesis that populations of Ambystoma were localized near water features that were important for breeding and larval development.
Our results suggest that landscape changes, including decreased soil depth and shifting vegetation cover, likely contributed to the extirpation of Ambystoma from the region. These findings are in agreement with modern studies that show that the presence of suitable habitat is important for maintaining amphibian biodiversity (Venne et al., Reference Venne, Tsai, Cox, Smith and McMurry2012). Although our models support the importance of changes in soil depth in driving extirpation, we argue that climatic variables, including MAT and AP, likely also played a substantial role. Continued investigation into causes for the extirpation of Ambystoma will be aided by additional well-dated records of fossil Ambystoma across Texas and northern Mexico. On the Edwards Plateau, Hall’s Cave is the only well-dated Holocene deposit that contains fossil Ambystoma, and additional Holocene localities could help more precisely determine the timing and pattern of the disappearance of Ambystoma in the region.
Body-size changes
In addition to exploring patterns of extirpation, we also examined the potential for environmental changes to elicit morphological changes in Ambystoma through time. An increase in temperature was hypothesized to drive decreased body size in organisms (Gardner et al., Reference Gardner, Peters, Kearney, Joseph and Heinsohn2011), and decreased size with increased temperature during hatching was observed for modern Ambystoma (Voss, Reference Voss1993). We wanted to test whether we could reconstruct changes in body size for Ambystoma in the face of increasing temperatures from the late Pleistocene into the Holocene. We found some evidence for a slight decrease in body size for Ambystoma from Hall’s Cave, with increased temperature based on measurements taken on fossil humeri. Increased confidence for the role of temperature driving body-size change can be found in the fact that our Bayesian change point analyses independently identified that a decrease in body size occurred during the rapid warming associated with the Bølling–Allerød interstadial. Decreased hydroperiod for water features hosting larval Ambystoma was also shown to result in smaller-sized individuals (McMenamin and Hadly, Reference McMenamin and Hadly2010); however, the Bølling–Allerød interstadial is reconstructed as a relatively wet period around Hall’s Cave (Fig. 3d), so decreased size during that time caused by rapid drying of water features is unlikely. In relatively drier times when we would expect a decreased hydroperiod, we do not see a shift toward smaller-sized individuals.
Interestingly, body-size reconstructions based on fossil femora did not show a significant relationship between size and temperature. There were relatively fewer fossil femora that could be measured compared with humeri, but subsampling of the humeri to the same sample size as the femora did not affect the reconstructed trend, nor did using bootstrap resampling of the femur dataset. This suggests that differences in the reconstructed trends based on the elements are likely not solely a factor of sample size differences. Although the humerus and the femur are both limb elements, their different shapes may have biased taphonomic processes altering their preservation potential (Moore and Norman, Reference Moore and Norman2009). Another source of bias for differential preservation of these elements could be in the feeding habits of the predators driving accumulation of fossil Ambystoma. Differential preservation of skeletal elements is known to occur for the remains of the prey of common predators contributing to cave deposits (Andrews, Reference Andrews1990). Owls are known to swallow their prey whole, resulting in equal preservation potential for the humerus and femur; however, other predators that actively chew or tear apart prey items have been observed to cause biased preservation of the humerus and femur (Andrews, Reference Andrews1990).
Another reason that reconstructed body-size trends differ between the humerus and femur is the possibility that there were changes in the length of forelimbs or the hindlimbs independent of body size. Similar to Bergmann’s rule, Allen’s rule predicts that there is a reduction in the relative length of body extremities with cooler temperature in order to decrease surface area relative to volume, thereby reducing heat loss (Ray, Reference Ray1960). This means that at higher temperatures there would be an expectation for longer limb length, but we do not observe that in our dataset. It is also possible that different ecological pressures on limb element morphology may drive different magnitudes of morphological change. Ambystoma are known to use both their forelimbs and hindlimbs for digging burrows; however, forelimbs were observed to be used more in the digging process, while hindlimbs were used for moving excavated soil posteriorly (Semlitsch, Reference Semlitsch1983). We chose to examine the humerus and femur due to their highly linear correlation with body size and because of their relatively high abundance in the Hall’s Cave fossil record. Future research on trends in size for other skeletal elements may further illuminate patterns of changing body size in Ambystoma. Similarly, the reconstruction of body size using fossil Ambystoma from nearby fossil deposits may help to support or reject a relationship between decreased body size and increased temperature.
Conclusions
Here we used the fossil record of Ambystoma from Hall’s Cave and other fossil localities across the southwestern United States and northern Mexico to highlight changes in the biogeographic distribution of Ambystoma since the Pleistocene. Our results from Hall’s Cave suggest that the extirpation of Ambystoma from the Edwards Plateau was driven by landscape changes, including progressive soil erosion, shifts in vegetation cover, and a transition to relatively hotter and drier climatic conditions during the Middle Holocene. Despite the continuous occurrence of burrowing mammals in the Hall’s Cave sequence that would have produced suitable burrows for Ambystoma to inhabit, decreased soil thickness would likely have resulted in overall decreased suitable habitat for these fossorial salamanders. Today, habitat loss due to land-use change, such as increased agricultural land conversion, threatens the persistence of populations (Venne et al., Reference Venne, Tsai, Cox, Smith and McMurry2012). Agriculture can also negatively impact hydroperiods of water features, and when combined with rising temperatures, is likely to deplete critical habitats required for breeding and larval development of Ambystoma. We provide long-term evidence supporting the dire situation of modern populations of Ambystoma in regions of the southwestern United States and northern Mexico projected to experience warming and drying (Sinervo et al., Reference Sinervo, Lara Reséndiz, Miles, Lovich, Rosen, Gadsden and Gaytán2024). The continued persistence of these populations will likely be tied to the availability of water features with a sufficient hydroperiod, and conservation efforts focusing on maintaining these types of water features will likely benefit populations of Ambystoma in this region. Furthermore, in modern Ambystoma, the distance between available water features was suggested as an important factor for maintaining connectivity between populations due to relatively limited migration potential (Brocka, Reference Brocka2020). The lack of fossil Ambystoma at nearby contemporaneous cave deposits despite the presence of other salamanders with direct development is consistent with the interpretation that Ambystoma on the Edwards Plateau had relatively limited ranges that were likely tied to the location of important water features. Efforts to maintain population genetic connectivity will need to consider distance between water features used for breeding and larval development.
Although we find mixed results for body-size change related to temperature change, there is some indication that increased temperatures are associated with a slight decrease in body size. Future research on additional fossil elements of Ambystoma from Hall’s Cave and additional fossil localities may provide additional support for this relationship between size and temperature. At the very least, it appears that body-size changes may be an important morphological feature to monitor in modern populations of Ambystoma as salamanders are subjected to hotter and hotter temperatures in the coming decades.
Supplementary material
The supplementary material for this article can be found at https://doi.org/10.1017/qua.2025.10029
Acknowledgments
We thank UT Planet Texas 2050 for providing funding support for this research. We thank Chris Sagebiel and Matt Brown for their help accessing fossil specimens and Vicky Zhuang and Carl Lieb for their help accessing modern specimens. We thank Veda Velamuri for help with data collection. We thank Stacie Skwarcan and John Moretti for allowing us to examine fossil salamander material from sites currently under their study. We thank Alexandra Boville, John Moretti, Chris Bell, David Hillis, Justin Havird, and Travis LaDuc for providing feedback on an earlier version of our article. We thank Chris Jass, Rick Toomey, and Tyler Faith for reviewing our article and providing helpful feedback and suggestions.


 Open access