


Introduction
Diabetes mellitus (DM) encompasses a group of metabolic disorders characterized by elevated hepatic glucose production, beta-cell dysfunction, and insulin insufficiency (Schleicher et al., Reference Schleicher, Gerdes, Petersmann, Müller-Wieland, Müller, Freckmann, Heinemann, Nauck and Landgraf2022). Among its severe complications, infertility in women stands out, driven by disruptions in ovarian histophysiology, dysregulation of the hypothalamus-pituitary-ovary axis, and hormonal imbalances that impair reproductive capacity (Wei et al., Reference Wei, Tang, Chen, Xiong, Xue, Dai, Guo, Wu, Dai and Wu2024). Diabetes is associated with reduced ovarian mass, altered counts and sizes of primary and secondary follicles, increased apoptosis in granulosa and follicular cells, and a higher prevalence of atretic follicles (Li et al., Reference Li, Jing, Dong, Fan, Li, Wang, Hou, Schatten, Zhang and Sun2020). A prevailing theory attributes these effects to an increase in tissue free radicals, leading to oxidative stress and subsequent cellular damage, particularly in reproductive tissues like the ovaries (Akpoveso et al., Reference Akpoveso, Ubah and Obasanmi2023). This oxidative stress disrupts follicular development and ovulation, contributing to subfertility and diminished reproductive potential in diabetic individuals (Andlib et al., Reference Andlib, Sajad and Thakur2024).
Individuals with diabetes are particularly susceptible to oxidative stress due to elevated blood glucose levels, which enhance the production of reactive oxygen species (ROS) and exacerbate lipid peroxidation (Bhatti et al., Reference Bhatti, Sehrawat, Mishra, Sidhu, Navik, Khullar, Kumar, Bhatti and Reddy2022). This is compounded by reduced activity of intracellular antioxidant enzymes, such as superoxide dismutase and catalase, which further amplifies oxidative damage and cellular dysfunction (Dutta et al., Reference Dutta, Sengupta, Izuka, Menuba and Nwagha2024). These changes disrupt hormonal signalling, including gonadotropin secretion, leading to impaired follicular growth and reduced fertility (Ojo et al., Reference Ojo, Nwafor-Ezeh, Rotimi, Iyobhebhe, Ogunlakin and Ojo2023). Consequently, managing oxidative stress is critical for mitigating diabetes-related reproductive complications (Chen et al., Reference Chen, Xie, Feng, Huang, Wu, Zhu, Tang and Zhang2025).
The primary goal of diabetes therapy is to mitigate and delay complications. Pioglitazone, a thiazolidinedione, is widely recognized for enhancing insulin sensitivity and plays a pivotal role in managing type II diabetes by regulating blood glucose levels (Alhowail et al., Reference Alhowail, Alsikhan, Alsaud, Aldubayan and Rabbani2022). By activating peroxisome proliferator-activated receptors (PPARs), pioglitazone improves insulin sensitivity in skeletal muscle, adipose tissue, and the liver, reduces postprandial glucose levels, and supports pancreatic β-cell function (Hashimoto and Hirano, Reference Hashimoto and Hirano2024). The expression of PPARs in the female reproductive tract suggests a potential role in regulating processes like ovulation and gametogenesis, which are critical for fertility (Mączka et al., Reference Mączka, Stasiak, Przybysz, Grymowicz and Smolarczyk2024). Conversely, artichoke extract, derived from Cynara scolymus L., a Mediterranean perennial plant, exhibits potent antioxidant properties, reducing lipid peroxidation and ROS production (Masci et al., Reference Masci, Valentina, Alicandri, Tomassi, Paolacci, Covino, Vinciguerra, Catalani, Cervia and Ciaffi2025).
Studies indicate that Cynara extract enhances insulin production and sensitivity, improves glucose homeostasis in diabetic rats, and mitigates oxidative damage to reproductive tissues (Amini et al., Reference Amini, Sheikhhossein, Talebyan, Bazshahi, Djafari and Hekmatdoost2022). Cynarin, the primary active component of Cynara, possesses choleretic and cholagogue properties, which may further contribute to its metabolic and protective effects (Porro et al., Reference Porro, Benameur, Cianciulli, Vacca, Chiarini, De Angelis and Panaro2024).
Despite these promising findings, a significant research gap exists regarding the combined effects of pioglitazone and Cynara extract on ovarian health in diabetic models. Previous studies have focused on Cynara’s antioxidative properties, which reduce lipid peroxidation and ROS in diabetic tissues (Amini et al., Reference Amini, Sheikhhossein, Talebyan, Bazshahi, Djafari and Hekmatdoost2022; Masci et al., Reference Masci, Valentina, Alicandri, Tomassi, Paolacci, Covino, Vinciguerra, Catalani, Cervia and Ciaffi2025), or pioglitazone’s insulin-sensitizing effects, which enhance glucose homeostasis and reduce hyperglycaemia-induced inflammation (Alhowail et al., Reference Alhowail, Alsikhan, Alsaud, Aldubayan and Rabbani2022). However, the synergistic potential of these treatments in preserving ovarian structure and function, such as maintaining follicular counts or mitigating oxidative damage, remains largely unexplored. This gap is critical, as combining Cynara’s antioxidant capabilities with pioglitazone’s metabolic regulation could offer a comprehensive approach to addressing diabetes-related ovarian dysfunction, potentially improving follicular health and reproductive outcomes.
This study aims to investigate the therapeutic potential of hydroethanolic C. scolymus extract and pioglitazone, individually and in combination, on ovarian tissue in a diabetic rat model. Using stereological techniques, including the Cavalieri principle, optical fractionator counting, and unbiased cell count methods, we assess parameters such as follicle counts, ovarian volumes, and blood vessel/connective tissue integrity (Mirabile et al., Reference Mirabile, Boyce and Gundersen2020). By addressing this research gap, our study seeks to elucidate how the synergistic effects of Cynara and pioglitazone may counteract diabetes-induced ovarian toxicity, preserve follicular development, and enhance reproductive function, contributing to novel therapeutic strategies for diabetes-related infertility.
Materials and methods
Extraction procedure of Cynara scolymus leaf extract
C. scolymus leaves (accession number 286604) were collected from the university garden of Shiraz, Iran (29°36′28.08′′N, 52°31′59.52′′E). The plant was identified by the Plant Biology Department at the Faculty of Biological Sciences, Shiraz University. The leaves were thoroughly washed with distilled water and dried at room temperature and light for two weeks. After drying, the leaves were finely powdered, and extraction was performed using a 70:30 (v/v) ethanol-water mixture as a solvent at room temperature for two days. The hydroalcoholic extract was filtered through Whatman No. 1 filter paper. After solvent removal under vacuum, the extract was stored at 4°C. A single dose of 400 mg/kg of the Cynara extract was administered to the animals according to the dose recommended by Heidarian (Heidarian et al., Reference Heidarian, Soofiniya and Hajihosseini2012).
Experimental design and grouping
Thirty-five healthy adult female Sprague–Dawley rats, weighing between 100 and 200 g, were purchased and acclimatized for one week prior to the experiments. The animals were housed in standard environmental conditions (temperature 22 ± 2°C, relative humidity 50 ± 5%, and a 12-hour light/dark cycle), with ad libitum access to pelleted food and water. After acclimation, the rats were randomly assigned to five groups (n = 7 per group) as follows:
-
Group I (Control): Non-diabetic rats receiving 0.2 mL of normal saline via oral gavage.
-
Group II (Diabetic): Diabetic rats receiving 0.2 mL of normal saline via oral gavage.
-
Group III (DM + Piog): Diabetic rats treated with 30 mg/kg pioglitazone orally (Peng et al., Reference Peng, Liang, Ou and Zu2014).
-
Group IV (DM + Cynara): Diabetic rats treated with 400 mg/kg hydroalcoholic extract of C. scolymus orally (Mahboubi, Reference Mahboubi2018).
-
Group V (DM + Piog + Cynara): Diabetic rats treated with both 30 mg/kg pioglitazone and 400 mg/kg C. scolymus extract orally.
All treatments were administered once daily via oral gavage for 30 consecutive days, corresponding to 6–7 oestrous cycles in rats (Cora et al., Reference Cora, Kooistra and Travlos2015).
Diabetes induction and treatment protocol
Diabetes was induced in Groups II–V by a single intraperitoneal injection of streptozotocin (STZ; Sigma–Aldrich) at a dose of 60 mg/kg body weight. STZ was freshly dissolved in cold 100 mM sodium citrate buffer (pH 4.5) containing 0.9% sodium chloride immediately before administration. Seventy-two hours after injection, fasting blood glucose (FBG) levels were measured using a glucometer (EASYGLUCO, Korea). Only rats exhibiting FBG ≥ 300 mg/dL were classified as diabetic and included in the diabetic groups. All animals that received STZ reached this glycaemic threshold within 72 h, confirming 100% successful induction, and no animals were excluded from the study. The single high-dose (60 mg/kg) STZ model employed in the present study is widely recognized and extensively used as a reliable experimental model of type II diabetes in rodents. It produces severe insulin deficiency, marked hyperglycaemia, glucose intolerance, and insulin resistance—features that closely resemble advanced human type II DM (Furman, Reference Furman2021; Ghasemi and Jeddi, Reference Ghasemi and Jeddi2023).
Sample collection, sample size calculation and ethical considerations
Twenty-four hours after the last treatment, all rats were deeply anesthetized by intraperitoneal injection of ketamine (80 mg/kg) and xylazine (10 mg/kg) and then euthanized by cervical dislocation. Both ovaries were immediately removed, cleared of adhering fat and connective tissue, and weighed. The left ovary was fixed in 10% neutral buffered formalin for 48 h for subsequent stereological and histological analyses, whereas the right ovary was snap-frozen in liquid nitrogen and stored at –80°C until used for biochemical assays, oxidative stress evaluation, and gene expression analyses. Sample size was determined a priori using G*Power 3.1.10 software. Based on data from our pilot experiments and previously published studies with similar designs, we anticipated a large effect size (Cohen’s d ≈ 1.3–1.5) for the primary outcomes (number of primordial follicles and ovarian MDA concentration) between diabetic and treated groups. Using α = 0.05 and desired power (1−β) = 0.80, a minimum of six animals per group was required. To compensate for possible animal loss or technical issues during the 30-day experimental period, seven rats were allocated to each of the five groups (total n = 35) (Neisy et al., Reference Neisy, Koohpeyma, Khorchani, Karimi and Zal2023).
All planned analyses were successfully performed on every animal, with no exclusions. All experimental procedures were conducted in accordance with the National Institutes of Health Guide for the Care and Use of Laboratory Animals and were approved by the Animal Ethics Committee of Abadan University of Medical Sciences (Approval ID: IR.ABADANUMS.AEC.1403.006).
Serum biochemical parameter analysis
Serum glucose levels were determined using a glucometer (EASYGLUCO, Korea) according to the manufacturer’s specifications. The glucose metre strips from the same batch were used for all experiments. Serum levels of follicle-stimulating hormone (FSH), luteinizing hormone (LH), progesterone, and 17 β oestradiol were quantified using ELISA kits (SE120089, Sigma, St. Louis, MO, USA) following the manufacturer’s instructions.
Catalase activity assessment
Catalase activity in ovarian tissue was measured using the method presented by (Koroliuk et al., Reference Koroliuk, Ivanova, Maĭorova and Tokarev1988). Tissue homogenate (5 µL) was incubated with Tris-HCl buffer (pH 7) containing 100 µmol/mL H2O2 for 10 min. The reaction was stopped by adding 4% ammonium molybdate solution, and the optical density was measured at 410 nm. Catalase activity was calculated as the amount of enzyme required to decompose one micromole of H2O2 per minute.
Total antioxidant capacity measurement
Total antioxidant capacity (TAC) in ovarian tissue was assessed using a modified chemiluminescence method based on (Kolettis et al., Reference Kolettis, Ross, Kay and Thomas1999). ABTS (2, 2’-azinobis (3-ethylbenzothiazoline-6-sulphonic acid)) was incubated with peroxidase, generating a detectable cationic radical at 600 nm. The inhibition of pigment production by antioxidants in ovarian tissue was measured to determine TAC in millimoles per litre.
Glutathione levels determination
Glutathione (GSH) levels in ovarian tissue homogenate were measured using the Ellman method (Ellman, Reference Ellman1959). The tissue was homogenized in cold phosphate-buffered saline (PBS) at a ratio of 1:10. The homogenate (15 µL) was mixed with 260 µL of assay buffer (0.1 M sodium phosphate, pH 8, and 1 mM EDTA) and 5 µL of 0.01 M Ellman’s reagent. After a 15-minute incubation, the concentration of TNB was measured at 412 nm. The GSH content was calculated from the OD values using a standard curve.
Malondialdehyde levels determination
Malondialdehyde (MDA), as a marker of lipid peroxidation, was measured using (Ohkawa et al., Reference Ohkawa, Ohishi and Yagi1979). A working solution containing 0.25 N hydrochloric acid, 0.375% thiobarbituric acid, and 15% trichloroacetic acid was prepared. Ovarian tissue homogenate (200 µL) was mixed with 500 µL of this solution and heated for 30 min. After cooling, the supernatant was centrifuged at 5000 rpm for 10 min, and the optical density at 535 nm was measured. The MDA content was expressed in nanomoles per milligram of protein.
Histological characteristics and histopathological and histometric evaluation
Ovarian samples were fixed in 10% saline formalin, embedded in paraffin, and sectioned at 5–6 µm thickness. The sections were stained with haematoxylin-eosin for structural and histological examination. Micrographs were captured using a diamond optical microscope with a Dino-Lite camera at 4×, 10×, and 40× magnifications. Types of follicles (antral, atretic, primary, secondary) were counted. Three sections from each animal were analyzed to assess the histopathological changes.
Stereological measurement
The entire ovary volume was estimated using the Cavalieri technique. Eight to thirteen randomly selected sections were made from each ovary. By placing the counting probe randomly on the images, the total number of points crossing the segment was counted. The ovary’s total volume was estimated using the following formula: $ {\rm V}{\rm \ TOTAL\ OVARY}={\sum }_{{\rm i}=1}^{{\rm n}}{\rm p}\times {\rm a}\left({\rm p}\right)\times {\rm t} $
Here, “n” is the total number of points superimposed on the image, “a(p)” is the area associated with each point, and “t” is the distance between the sample sections.
The volume density of the targeted structures (cortex, medulla, and corpus luteum) was estimated on 5 µm thick sections using the point-counting method and Delesse’s formula: ${\rm V\;v\;structure\;} = \sum\nolimits_{\rm i = 1}^{\rm n} {{{\rm p\;structure} \over {\sum\nolimits_{\rm i = 1}^{\rm n} {\rm p\;reference} }}} $
Here, “p structure” is the number of test points falling on the targeted structure, and “p reference” is the total points hitting the ovary sections. The absolute targeted structure volume was estimated using the formula: ${\rm V}{{\rm \ structure}} = {\rm V}{{\rm \ ovary}} \times {\rm V}\,{{\rm v}\,{\rm \ structure}}$
The number of follicles was determined on 20 µm thickness sections using the optical Disector method and the following formula: ${\rm{N}}{\mkern 1mu} {\rm{v}} = {{\sum _{{\rm{i}} = 1}^{\rm{n}}{\rm{Q}}} \over {\sum _{{\rm{i}} = 1}^{\rm{n}}{\rm{p}} \times {\rm{h}} \times \left( {{{{\rm{BA}}} \over {{\rm{af}}}}} \right){\rm{t}}}}$
Here, “Q” is the number of follicles counted in all of the Disector, “h” is the height of the optical Disector, “af” is the area of the counting frame, “P” is the total number of counted frames, “BA” or block advance is the setting of the microtome to cut the paraffin block, and “t” is the mean final section thickness. To estimate the total number of follicles, the following formula was used (Neisy et al., Reference Neisy, Koohpeyma, Khorchani, Karimi and Zal2023): ${\rm N}{{\rm \ follicles}} = {\rm N}\,{\rm v} \times {\rm V}{{\rm \ ovary}}$
Real-time PCR assay for caspase 9 and Bcl2 genes in ovarian tissues
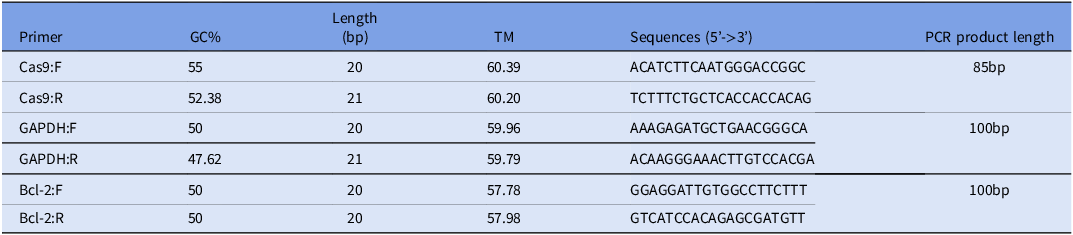
Total RNA was extracted from ovarian tissues using the EZ RNA reagent, according to the manufacturer’s instructions. RNA concentration and purity were assessed using a spectrophotometer. For reverse transcription, 1 µg of purified RNA was converted to complementary DNA (cDNA) using the Revert Aid First Strand cDNA Synthesis Kit (Fermentase) following the manufacturer’s protocol. Real-time PCR was performed on an Applied Biosystems 7500 System with SYBR Green dye. Primer sequences for Caspase 9, Bcl2, and the internal control gene (GAPDH) are listed in Table 1. GAPDH mRNA was used for normalization. PCR conditions included an initial denaturation at 95°C for 10 min, followed by 40 cycles of 95°C for 15 s and 60°C for 1 min. The 2–∆∆Ct method was used for relative quantification of gene expression. Each sample was run in triplicate.
Gene specific-forward and reverse primer sequences

Table 1. Long description
The table presents gene-specific forward and reverse primer sequences for Caspase 9, GAPDH, and Bcl-2. It includes columns for primer names, GC percentage, length in base pairs, melting temperature, sequences in 5’ to 3’ direction, and PCR product length. The table has six rows and six columns, providing detailed information for each primer pair. For instance, the Cas9:F primer has a GC percentage of 55, a length of 20 base pairs, a melting temperature of 60.39 degrees Celsius, and a sequence of ACATCTTCAATGGGACCGGC, resulting in a PCR product length of 85 base pairs. Similarly, the GAPDH:F primer has a GC percentage of 50, a length of 20 base pairs, a melting temperature of 59.96 degrees Celsius, and a sequence of AAAGAGATGCTGAACGGGCA, resulting in a PCR product length of 100 base pairs. The Bcl-2:F primer has a GC percentage of 50, a length of 20 base pairs, a melting temperature of 57.78 degrees Celsius, and a sequence of GGAGGATTGTGGCCTTCTTT, resulting in a PCR product length of 100 base pairs.
Statistical data analysis
Data analysis was conducted using SPSS software (version 22.0, Chicago, IL, USA). Intergroup differences were evaluated using one-way analysis of variance (ANOVA), followed by Tukey’s post hoc test for multiple comparisons. Additional statistical tests, such as Kruskal–Wallis test, were applied to validate the robustness of the results. A P-value of 0.05 or less was considered statistically significant.
Results
Evaluation of pioglitazone, Cynara, and their combination on blood glucose levels in diabetic rats
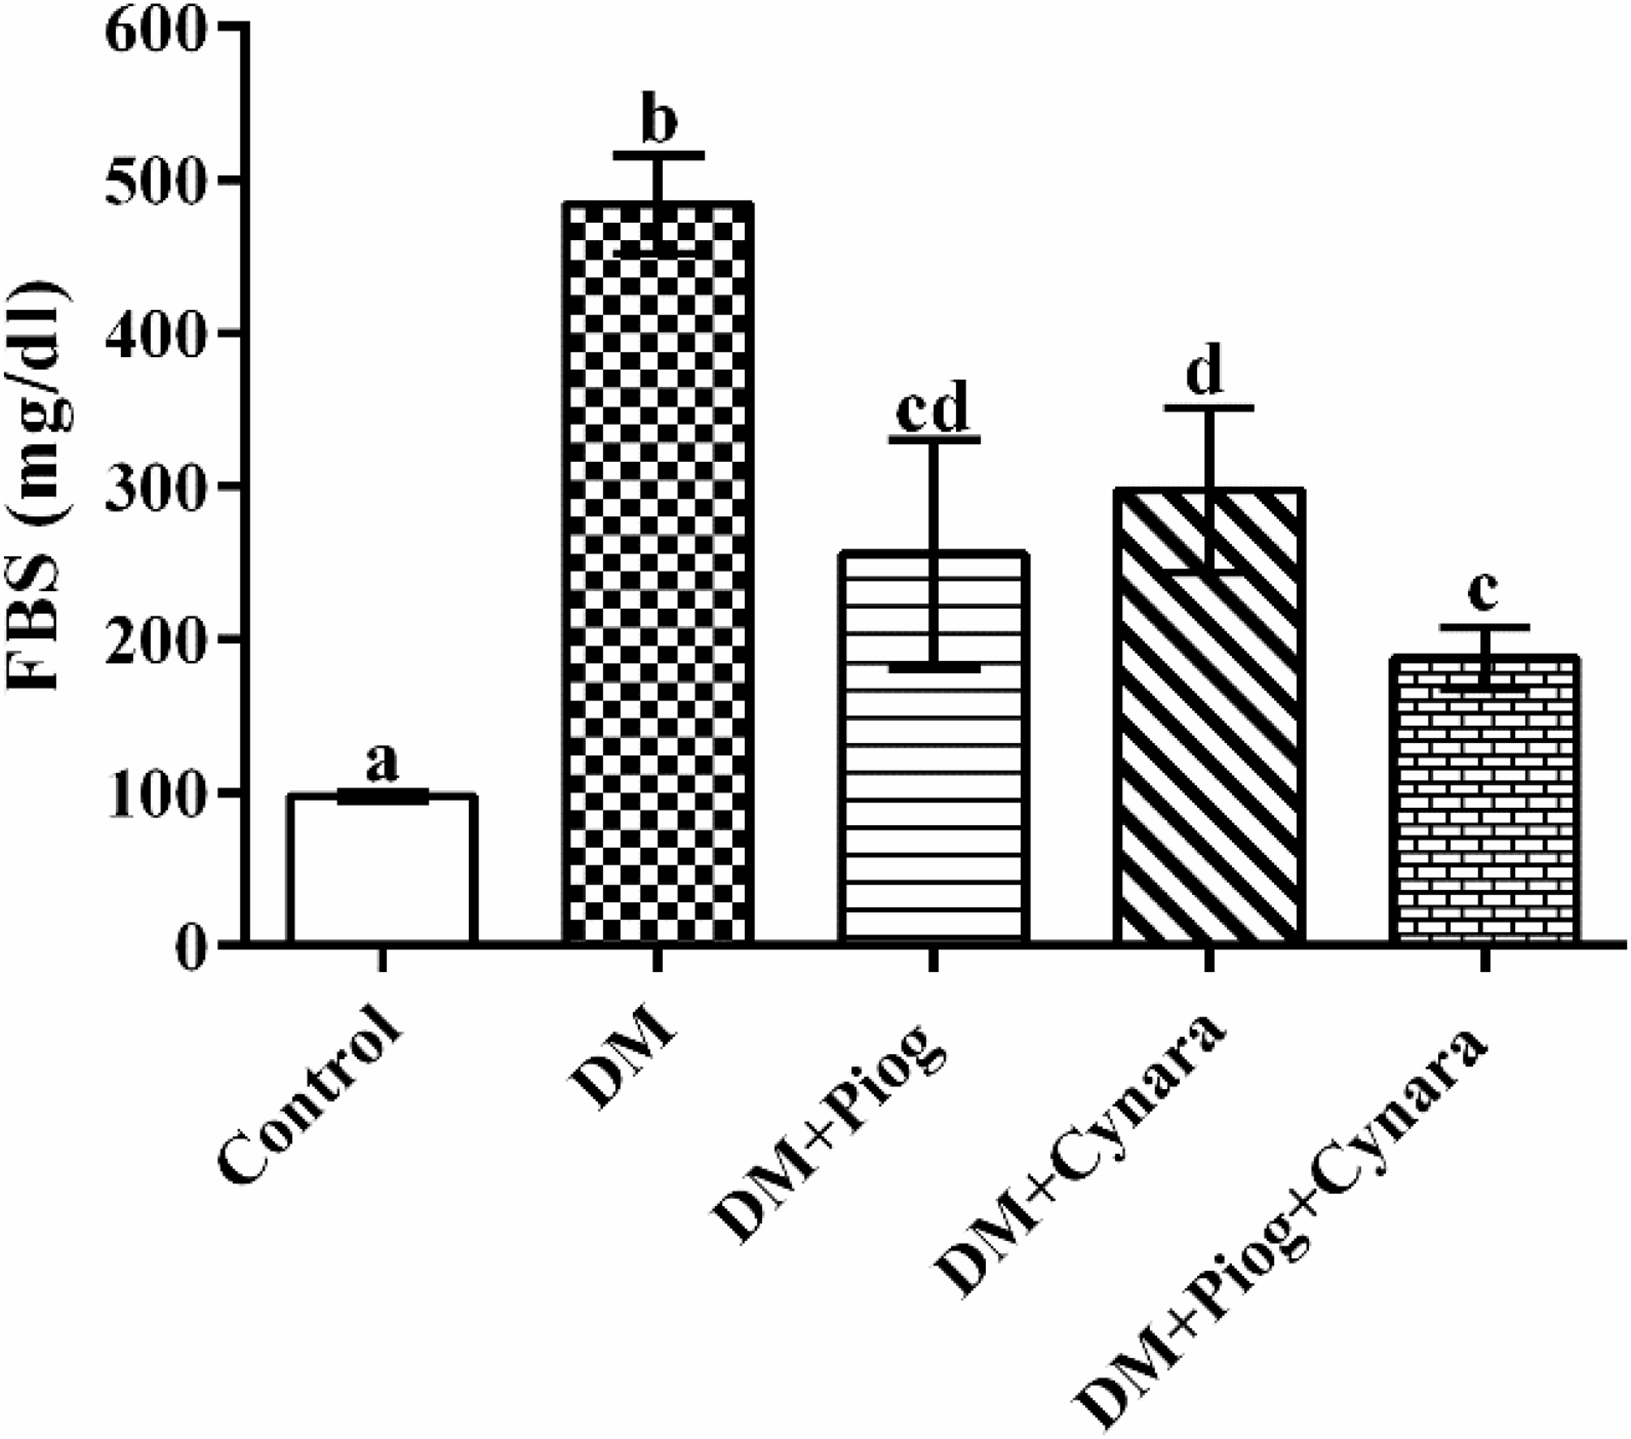
The fasting blood sugar (FBS) levels for each experimental group are illustrated in Figure 1. A significant elevation in FBS was observed in the diabetic (DM) group compared to the control group, confirming the successful induction of diabetes (P < 0.05). Treatment with Pioglitazone (DM + Piog), C. scolymus (DM + Cynara), and their combination (DM + Piog+Cynara) resulted in significant reductions in FBS levels compared to the untreated diabetic group (DM) (P < 0.05). Specifically, the DM + Piog group exhibited a marked decrease in FBS, with levels significantly lower than those in the DM group. Similarly, the DM + Cynara group showed a significant reduction in FBS, although the decrease was slightly less pronounced than in the DM + Piog group. Notably, the combination treatment group (DM + Piog + Cynara) demonstrated the most substantial reduction in FBS levels, indicating a potential synergistic effect. However, the FBS levels in the DM + Piog + Cynara group were not significantly different from those in the DM + Piog group, suggesting that the combination therapy did not provide a statistically significant advantage over Pioglitazone alone in reducing blood glucose levels.
Effect of Pioglitazone, Cynara scolymus, and their combination on fasting blood sugar (FBS) levels in STZ-diabetic rats. Values are expressed as mean ± SD (n = 7). Columns with similar letters are not significantly different (P > 0.05); columns with different letters indicate a significant difference (P < 0.05).

Figure 1. Long description
The bar graph compares fasting blood sugar levels in STZ-diabetic rats under different treatments. The x-axis lists five categories: Control, DM, DM+Piog, DM+Cynara, and DM+Piog+Cynara. The y-axis measures FBS levels in milligrams per deciliter, ranging from 0 to 600. The Control group shows the lowest FBS levels, while the DM group shows the highest. The DM+Piog, DM+Cynara, and DM+Piog+Cynara groups show intermediate levels, with DM+Piog+Cynara having the lowest among the treatment groups. Each bar represents the mean value with error bars indicating standard deviation. The bars are labeled with letters indicating statistical significance: ‘a’ for Control, ‘b’ for DM, ‘cd’ for DM+Piog, ‘d’ for DM+Cynara, and ‘c’ for DM+Piog+Cynara. The graph uses different patterns to distinguish between the groups. All values are approximated.
Evaluation of biochemical parameters in serum samples
The analysis of serum hormone levels, including LH, FSH, oestradiol, and progesterone, as shown in Figure 2, revealed significant differences between the diabetic (DM) and control groups. Specifically, LH, FSH, oestradiol, and progesterone levels were markedly lower in the DM group compared to the control group. In the DM + Piog + Cynara group, LH levels exhibited a significant increase compared to the DM group. However, no significant differences were observed between the DM + Piog and DM + Cynara groups in relation to the DM and DM + Piog + Cynara groups. FSH levels were significantly elevated in the DM + Piog + Cynara group compared to the DM, DM + Piog, and DM + Cynara groups. No significant differences were observed between the DM + Piog and DM + Cynara groups relative to the DM group.
(a–d) Effect of Pioglitazone, Cynara scolymus, and their combination on LH, FSH, oestradiol, and progesterone levels in STZ-diabetic rats. Values are expressed as mean ± SD (n = 7). Columns with at least one common letter are not significantly different (P > 0.05); columns with different letters indicate significant differences (P < 0.05).

Figure 2. Long description
The bar graph compares the effects of Pioglitazone, Cynara scolymus, and their combination on LH, FSH, estradiol, and progesterone levels in STZ-diabetic rats. The graph consists of four separate panels labeled A, B, C, and D, each representing different hormone levels. Each panel contains five vertical bars representing different treatment groups: Control, DM, DM plus Pioglitazone, DM plus Cynara, and DM plus Pioglitazone and Cynara. The x-axis labels the treatment groups, and the y-axis measures hormone levels in milliliters per milliliter (mL per mL) for LH and FSH and picograms per milliliter (pg per mL) for estradiol and progesterone. The bars are color-coded and patterned differently to represent each treatment group. The Control group consistently shows the highest hormone levels across all panels. The DM group shows significantly lower hormone levels compared to the Control group. The treatment groups (DM plus Pioglitazone, DM plus Cynara, and DM plus Pioglitazone and Cynara) show varying levels of hormone restoration, with some groups showing significant improvement over the DM group. The data points indicate mean values with standard deviations. Columns with at least one common letter are not significantly different (P greater than 0.05), while columns with different letters indicate significant differences (P less than 0.05). All values are approximated.
Oestradiol levels were significantly higher in the DM + Piog + Cynara group compared to the DM, DM + Piog, and DM + Cynara groups. Nonetheless, there was no significant difference between the DM + Piog + Cynara group and the control group. Regarding progesterone levels, the DM + Piog + Cynara group showed a significant increase compared to the DM group. However, no significant differences were noted between the DM + Piog and DM + Cynara groups when compared to the DM + Piog + Cynara group.
In all diagrams, groups sharing at least one common letter did not exhibit significant differences. Conversely, groups without a common letter showed significant differences (P < 0.05).
Evaluation of oxidative stress indices
Figure 3 illustrates the impact of diabetes and the administration of Pioglitazone, Cynara alone, or their combination on the activities of CAT, GPX, TAC, and MDA in diabetic animals. Compared to the control group, activities of CAT, GPX, and TAC were significantly reduced in the DM group. However, treatment with Pioglitazone (DM + Piog), C. scolymus extract (DM + Cynara), and their combination (DM + Piog + Cynara) notably increased CAT, TAC, and GPX activities compared to the DM group.
(a–d) Effect of Pioglitazone, Cynara scolymus, and their combination treatment on oxidative stress-related enzyme production in ovary tissue of diabetic rats. (a) Catalase level; (b) GPX level; (c) TAC level; and (d) MDA content. Data are expressed as mean ± standard deviation (SD; n = 7). Columns with at least one common letter are not significantly different (P > 0.05); columns with different letters indicate significant differences (P < 0.05).

Figure 3. Long description
The bar graph compares the levels of catalase, GPX, TAC, and MDA in ovary tissue of diabetic rats under different treatments. The x-axis represents the treatment groups: Control, DM, DM+Piog, DM+Cynara, and DM+Piog+Cynara. The y-axis measures the enzyme levels in IU per milliliter or nmol per milliliter. Each treatment group is represented by a vertical bar with different patterns. The catalase level graph shows that the DM group has significantly lower catalase levels compared to the control group, while the other treatment groups show varying levels of recovery. The GPX level graph indicates that the DM group has lower GPX levels, with the other treatment groups showing higher levels, particularly the DM+Piog+Cynara group. The TAC level graph shows a similar trend, with the DM group having the lowest TAC levels and the other treatment groups showing higher levels. The MDA content graph shows that the DM group has the highest MDA levels, indicating higher oxidative stress, while the other treatment groups show reduced MDA levels, with the DM+Piog+Cynara group having the lowest. All values are approximated.
Additionally, STZ-induced diabetes in the animal model resulted in elevated levels of MDA in ovarian tissue compared to the control group. Treatment with Pioglitazone (DM + Piog), C. scolymus extract (DM + Cynara), and their combination (DM + Piog + Cynara) significantly reduced these elevated MDA levels.
Stereological analysis of ovarian weight and volume parameters
Figure 4 illustrate the impact of Pioglitazone, C. scolymus, and their combination on stereological parameters in STZ-diabetic rats. In the DM group, the ovarian weight, as well as the volume of the ovary, cortex, and medulla, were significantly increased (P < 0.05) compared to the control group, whereas the volume of the corpus luteum was notably decreased (P < 0.05).
(a–e) Effect of Pioglitazone, Cynara scolymus, and their combination on ovarian weight and volume, as well as the volume of the cortex, medulla, corpus luteum, and ovarian cysts in diabetic rats. The volume density of the targeted structures (cortex, medulla, corpus luteum, and ovarian cysts) was estimated on 5 µm thick sections using the point-counting method and Delesse’s formula. Results are expressed as mean ± SD (n = 7) and analyzed by one-way analysis of variance (ANOVA) followed by Tukey’s post hoc test. Columns with different letters indicate significant differences (P < 0.05).

Figure 4. Long description
The bar graph presents data on the effects of Pioglitazone, Cynara scolymus, and their combination on ovarian weight and volume, as well as the volume of the cortex, medulla, corpus luteum, and ovarian cysts in diabetic rats. The x-axis represents different treatment groups: Control, DM, DM with Pioglitazone, DM with Cynara scolymus, and DM with Pioglitazone and Cynara scolymus. The y-axis measures ovarian weight in milligrams and volume in cubic millimeters. Each bar represents the mean value with standard deviation for each group. The graph shows significant differences indicated by different letters above the bars. The data points are approximated.
In the DM + Piog, DM + Cynara, and DM + Piog + Cynara groups, the ovarian weight and cortex volume were restored to levels that did not significantly differ from those in the control group. However, the medulla volume in these treatment groups did not show any significant difference compared to either the DM or control groups (P ≥ 0.05).
The corpus luteum volume was significantly reduced in the DM group compared to the control, DM + Piog, and DM + Piog + Cynara groups (P < 0.01). Although there was no significant difference between the DM + Piog and DM + Cynara groups (P ≥ 0.05), the corpus luteum volume in the DM + Piog + Cynara group was significantly higher than in the control group (P < 0.05).
Total number of ovarian follicles
As shown in Figure 5, the number of primordial, unilaminar, multilaminar, antral, and Graafian follicles significantly decreased (P < 0.05), while the number of atretic follicles significantly increased (P < 0.05) in the DM group compared to the control group. The number of primordial follicles in the control group was significantly higher than in all other groups (P < 0.05).
Effect of Pioglitazone, Cynara scolymus, and their combination on the number of ovarian follicles in diabetic rats. The number of follicles was determined on 20 µm thick sections using the optical Disector method. Results are expressed as mean ± SD (n = 7) and analyzed by one-way analysis of variance (ANOVA) followed by Tukey’s post hoc test. Columns with different letters indicate significant differences (P < 0.05).

Figure 5. Long description
The bar graph compares the number of primordial, unilaminar, multilaminar, antral, Graafian, and atretic follicles in diabetic rats under different treatments. The x-axis lists the treatment groups: Control, DM, DM plus Pioglitazone, DM plus Cynara scolymus, and DM plus Pioglitazone and Cynara scolymus. The y-axis represents the number of follicles. Each treatment group has multiple bars representing different types of follicles. The bars are color-coded and patterned differently to distinguish between the types of follicles. The graph shows significant differences in the number of follicles across the treatment groups, with annotations indicating statistical significance. All values are approximated.
The number of unilaminar, multilaminar, and antral follicles significantly increased in the DM + Piog, DM + Cynara, and DM + Piog + Cynara groups compared to the DM group (P < 0.05), which was accompanied by a significant decrease in the number of atretic follicles (P < 0.05). Additionally, the number of Graafian follicles significantly increased in the DM + Piog + Cynara group compared to the DM group (P < 0.05), but no significant difference was observed between the DM + Piog and DM + Cynara groups in comparison to the DM and DM + Piog + Cynara groups. Figure 6 (A–E) illustrates different developmental stages of folliculogenesis in the Control, DM, DM + Piog, DM + Cynara, and DM + Piog + Cynara groups. The DM group showed a significant increase in the number of atretic follicles. In contrast, the DM + Piog + Cynara group demonstrated a significant reduction in the number of atretic follicles, along with a higher volume of corpus luteum and healthy follicles.
Comparison of ovarian photomicrographs at different stages of treatment. (A1, A2, A3) control group; (B1, B2, B3) diabetic group (DM); (C1, C2, C3) DM + Pioglitazone group (DM + Piog); (D1, D2, D3) DM + Cynara scolymus group (DM + Cynara); (E1, E2, E3) DM + Pioglitazone + Cynara scolymus group (DM + Piog + Cynara). Arrows indicate: unilaminar follicles (pick arrow), multilaminar follicles (arrow), secondary follicles (S.F; antral follicles), corpus luteum (C.L), atretic follicles (A.F). Haematoxylin and eosin staining with magnifications of ×4, ×10, and ×40.

Figure 6. Long description
The image presents a comparative analysis of ovarian photomicrographs at different stages of treatment. Each row represents a different treatment group: control, diabetic, diabetic with Pioglitazone, diabetic with Cynara scolymus, and diabetic with both Pioglitazone and Cynara scolymus. The images are labeled as A1, A2, A3 for the control group; B1, B2, B3 for the diabetic group; C1, C2, C3 for the diabetic with Pioglitazone group; D1, D2, D3 for the diabetic with Cynara scolymus group; and E1, E2, E3 for the diabetic with both Pioglitazone and Cynara scolymus group. Key features include unilaminar follicles indicated by a pick arrow, multilaminar follicles marked by an arrow, secondary follicles labeled as S.F, antral follicles, and corpus luteum labeled as C.L. Atretic follicles are labeled as A.F. The images are stained with haematoxylin and eosin and magnified at different levels: 4 times, 10 times, and 40 times.
H&E staining was used to determine the types of ovarian follicles in the ovarian tissue of the control and STZ-induced diabetic rat groups. Micrographs of primordial, primary, secondary, and Graafian follicles, as well as corpus luteum, are presented collectively in Figure 6. Follicles were classified as primordial if they contained an oocyte surrounded by a partial or complete layer of squamous granulosa cells. Primary follicles were identified by the presence of a single layer of cuboidal granulosa cells. Secondary (antral) follicles were characterized by the presence of more than one layer of granulosa cells with a visible antrum. Graafian (mature) follicles were identified by a rim of cumulus cells surrounding the primary oocyte (Myers et al., Reference Myers, Britt, Wreford, Ebling and Kerr2004).
Gene expression analysis using RT-PCR
Gene expression analysis was conducted for apoptosis-related genes across the Control, DM, DM + Piog, DM + Cynara, and DM + Piog + Cynara groups to assess the induction of apoptosis and its impact on folliculogenesis. As shown in Figure 7, the DM group exhibited a downregulation of Bcl-2 expression, which is associated with increased apoptosis and decreased follicle survival. Conversely, the DM + Piog + Cynara group showed an upregulation of Bcl-2 expression to levels comparable to the control group, indicating a protective effect against follicular apoptosis. This upregulation was significantly different when compared with the other groups. The DM + Cynara group also exhibited a significant increase in Bcl-2 expression compared to the other groups, but it was not significantly different from the DM group.
Gene expression analysis of caspase 9 and Bcl-2 in response to Pioglitazone, Cynara scolymus, and their combination in both control and treated samples. Caspase 9 is a pro-apoptotic gene, while Bcl-2 is an anti-apoptotic gene. GAPDH was used as a housekeeping gene for normalization. Columns with at least one common letter are not significantly different (P > 0.05); columns with different letters indicate significant differences (P < 0.05).

Figure 7. Long description
The bar graph consists of two panels labeled A and B. Panel A shows the expression levels of Bcl-2, an anti-apoptotic gene, while Panel B shows the expression levels of Caspase-9, a pro-apoptotic gene. Each panel contains five vertical bars representing different groups: Control, DM, DM+Piog, DM+Cynara, and DM+Piog+Cynara. The x-axis labels the treatment groups, and the y-axis measures the expression levels. In Panel A, the Control group has the highest expression level of Bcl-2, followed by DM+Piog+Cynara, DM+Cynara, DM+Piog, and DM. In Panel B, the DM group has the highest expression level of Caspase-9, followed by DM+Piog+Cynara, DM+Cynara, DM+Piog, and Control. Columns with at least one common letter are not significantly different (P \gt 0.05); columns with different letters indicate significant differences (P \it 0.05). All values are approximated.
Regarding caspase-9, expression levels were significantly upregulated by 4.8-fold in the DM group, 2.34-fold in the DM + Piog group, and 2.36-fold in the DM + Cynara group, indicating increased apoptosis in these groups. In contrast, the DM + Piog + Cynara group displayed caspase-9 expression levels similar to those of the control group, suggesting reduced apoptosis. Significant differences in caspase-9 expression were observed between the DM + Piog + Cynara group and the DM, DM + Piog, and DM + Cynara groups. However, no significant differences were noted between the DM, DM + Piog, and DM + Cynara groups when treated individually. These findings suggest that the combination of Pioglitazone and Cynara is more effective in reducing apoptosis and promoting folliculogenesis in diabetic ovaries compared to the treatments administered alone.
Discussion
This study demonstrated significant improvements in histopathological and stereological parameters in the DM + Piog + Cynara group, which exhibited increased counts of preantral, antral, and Graafian follicles, enhanced corpus luteum volume, and reduced atretic follicles and FBS compared to the DM group. Induction of diabetes via STZ caused detrimental effects, including increased ovarian weight and volume, enlarged cortex and medulla, reduced activities of antioxidant enzymes GPx, TAC, CAT, and elevated MDA levels in ovarian tissue, indicative of oxidative stress (Olawale et al., Reference Olawale, II, UI and Sarah2020). Notably, the combined C. scolymus and pioglitazone treatment showed more pronounced therapeutic effects than either treatment alone, suggesting synergistic mechanisms that enhance ovarian function and reproductive capacity.
Importantly, the absence of a non-diabetic control group receiving only C. scolymus extract may be considered a limitation. However, several previous studies have already evaluated the reproductive safety of C. scolymus leaf extract in healthy rodents at doses of 200–1000 mg/kg and consistently reported no adverse effects on ovarian histology, follicle populations, oestrous cyclicity, hormonal profile, or fertility parameters (Salem et al., Reference Salem, Affes, Ksouda, Dhouibi, Sahnoun, Hammami and Zeghal2015; Sharma et al., Reference Sharma, Verma, Pankaj and Agarwal2021; Nasef et al., Reference Nasef, Yousef, Ghareeb, Augustyniak, Aboul-Soud and Wakil2023). These data support the favourable safety profile of the extract in non-diabetic conditions and further validate the therapeutic findings observed in the diabetic model.
Our findings revealed a significant reduction in FBS in the DM + Cynara, DM + Piog, and combined DM + Piog + Cynara treatment groups compared to the untreated DM group, with the combined treatment showing the most substantial decrease. Although the FBS reduction in the DM + Piog + Cynara group was not statistically different from the DM + Piog group, the combined treatment’s superior effects on folliculogenesis, hormonal restoration, and anti-apoptotic gene expression indicate synergistic benefits that extend beyond glycaemic control, particularly in improving ovarian health and fertility outcomes (Chen et al., Reference Chen, Yang and Zhang2023). Pioglitazone activates peroxisome proliferator-activated receptor gamma (PPAR-γ), enhancing insulin sensitivity in adipocytes and skeletal muscle, thereby promoting glucose uptake through increased glucose transporter type 4 (GLUT4) expression (Moinaldini et al., Reference Moinaldini, Allahyari, Shahouzehi and Fallah2021). Cynara, rich in bioactive compounds such as caffeoylquinic acids and luteolin glucosides, exerts hypoglycaemic effects by inhibiting intestinal α-amylase and α-glucosidase, reducing postprandial hyperglycaemia (Ilgün, Reference Ilgün2022). These complementary mechanisms – pioglitazone’s cellular insulin sensitization and Cynara’s inhibition of carbohydrate digestion – create a robust glucose-lowering effect, reducing glucotoxicity that contributes to ovarian dysfunction. This synergy stabilizes glucose homeostasis, supports insulin signalling in granulosa and theca cells, and mitigates diabetes-induced damage to follicular development, fostering a favourable ovarian microenvironment (Wang et al., Reference Wang, Zhang and Zhou2024). These findings align with studies demonstrating that combined therapies targeting multiple glycaemic pathways yield enhanced metabolic and reproductive outcomes in diabetic models (Pelusi, Reference Pelusi2022).
Uncontrolled diabetes drives oxidative stress and lipid peroxidation, contributing to reproductive complications (Singh et al., Reference Singh, Singh, Singh, Singh, Singh, Kaur and Singh2024). In our study, the DM group exhibited elevated MDA levels, indicating lipid peroxidation, and decreased TAC, CAT, and GPx activities, which impaired gonadotropin levels and follicular health. The DM + Piog + Cynara group significantly reduced MDA and restored antioxidant enzyme activities, with gene expression analysis revealing upregulated Bcl-2 and normalized caspase-9 levels compared to the DM group (4.8-fold caspase-9 increase in DM vs. control-like levels in DM + Piog + Cynara), indicating a pronounced reduction in follicular apoptosis (Imelda et al., Reference Imelda, Chibuisi, Lemwi, Katchy, Bond and Neba2022). Cynara’s bioactive compounds, including luteolin and chlorogenic acid, scavenge ROS and activate nuclear factor erythroid 2-related factor 2 (Nrf2) pathways, upregulating CAT and GPx expression (Acquaviva et al., Reference Acquaviva, Malfa, Santangelo, Bianchi, Pappalardo, Taviano, Miceli, Di Giacomo and Tomasello2023). Simultaneously, pioglitazone reduces hyperglycaemia-induced ROS production and downregulates pro-inflammatory cytokines (e.g., TNF-α) via PPAR-γ, further alleviating oxidative damage (Hamouda et al., Reference Hamouda, Mansour and Elyamany2022). The synergistic antioxidant effects of Cynara and pioglitazone, evidenced by restored antioxidant defences and a significant reduction in caspase-9 expression, protect ovarian cells from apoptosis, preserving follicular integrity and enhancing fertility potential in diabetic conditions. This dual action mitigates mitochondrial dysfunction and caspase activation, which are critical drivers of follicular degeneration (Chen et al., Reference Chen, Zhao, Miao, Yang, Wang, Chen and Zhang2022).
Diabetes disrupts the hypothalamus-pituitary-gonad (HPG) axis, reducing FSH, LH, oestradiol, and progesterone levels, as observed in the DM group (Gharanjik et al., Reference Gharanjik, Shojaeifard, Karbalaei and Nemati2022). The DM + Piog + Cynara group significantly increased FSH, oestradiol, and progesterone levels compared to the DM, DM + Piog, and DM + Cynara groups, with LH showing moderate improvement, suggesting enhanced endocrine function. The pronounced restoration of FSH, oestradiol, and progesterone in the combined treatment group likely stems from pioglitazone’s PPAR-γ-mediated improvement in insulin signalling within granulosa and theca cells, coupled with Cynara’s antioxidant protection of the HPG axis, which stabilizes gonadotropin-releasing hormone (GnRH) secretion (Olawale et al., Reference Olawale, II, UI and Sarah2020). The limited LH response may reflect differential sensitivity of the HPG axis to insulin and oxidative stress, suggesting a need for further investigation into LH-specific pathways (Casarini et al., Reference Casarini, Santi, Brigante and Simoni2018). These hormonal improvements support follicular maturation and ovulation, critical for reproductive capacity in diabetic conditions.
Stereological assessments revealed that diabetes reduced primordial, unilaminar, multilaminar, antral, and Graafian follicle counts while increasing atretic follicles, predisposing to premature ovarian failure (Mehrabianfar et al., Reference Mehrabianfar, Dehghani, Karbalaei and Mesbah2020). The DM + Piog + Cynara group restored ovarian weight and cortex volume to control levels and significantly increased corpus luteum volume, indicating enhanced luteal function. The combined treatment significantly increased unilaminar, multilaminar, antral, and Graafian follicle counts while reducing atretic follicles, driven by Cynara’s Nrf2-mediated antioxidant protection and pioglitazone’s PPAR-γ-driven insulin sensitization, which collectively improve the ovarian microenvironment (Ballav et al., Reference Ballav, Biswas, Sahu, Ranjan and Basu2022; Gao et al., Reference Gao, Wang, Huang, Wu, Li, Li, Zhu and Wu2023). Histopathological evaluations confirmed preserved ovarian structures (connective tissue, blood vessels, theca folliculi, zona pellucida) in the DM + Piog+Cynara group, with normal corpus luteum morphology supporting ovulation. Improved vascularization, likely due to pioglitazone’s PPAR-γ-mediated upregulation of nitric oxide production, enhances blood flow, delivering oxygen, nutrients, and hormones essential for follicular growth and luteal function (Li et al., Reference Li, Guan, Chen, Tian, Xie and Yang2025).
The synergistic mechanisms of Cynara and pioglitazone can be attributed to their complementary actions across multiple pathways. Pioglitazone’s PPAR-γ activation enhances insulin sensitivity, reduces inflammatory and oxidative stress, and promotes vascular health, while Cynara’s bioactive compounds bolster antioxidant defences and inhibit glucose absorption. These combined effects address diabetes-induced glucotoxicity, oxidative stress, and hormonal dysregulation, as evidenced by restored follicular counts, reduced apoptosis (via Bcl-2 upregulation and caspase-9 normalization), and improved vascular integrity. This multifaceted approach underscores the potential of combined therapies to mitigate diabetes-related reproductive dysfunction.
Limitations
One limitation of the current study is the lack of a non-diabetic group receiving only C. scolymus extract and the absence of long-term fertility outcome data (e.g., mating trials and offspring health). Additionally, although the combined treatment significantly improved most parameters, LH restoration remained partial restoration observed, suggesting possible differential sensitivity of certain HPG axis components. Future studies with larger cohorts and longer follow-up periods are warranted to further confirm the translational potential of this combined therapy.
Conclusion
This study demonstrates that combined C. scolymus and pioglitazone treatment effectively mitigates diabetes-induced ovarian dysfunction through synergistic mechanisms. By reducing FBG, oxidative stress (decreased MDA, restored CAT, GPx, TAC), and follicular apoptosis (upregulated Bcl-2, normalized caspase-9), this therapy restores ovarian health. Enhanced preantral, antral, and Graafian follicle counts, increased corpus luteum volume, and improved vascularization, driven by Cynara’s Nrf2-mediated antioxidant effects and pioglitazone’s PPAR-γ-dependent insulin sensitization, highlight its efficacy in promoting folliculogenesis. These findings position this combination as a promising strategy to enhance fertility in diabetic women. Future studies should explore long-term reproductive outcomes and clinical translation to validate its therapeutic potential.
Acknowledgements
Samaneh Karimi and Farhad Koohpeyma: conceptualization, methodology, writing – original draft, formal analysis. Alireza Jahangiri: methodology.
Competing interests
The authors declare that they have no known competing financial interests.
Funding
The authors gratefully acknowledge the financial support from the Abadan University of Medical Sciences (grant no. 1403t-1871) to Alireza Jahangiri and the Endocrine and Metabolism Research Center of Shiraz University of Medical Sciences.
Ethical standards
The authors assert that all procedures contributing to this work complied with the ethical standards of the relevant national and institutional guides on the care and use of laboratory animals.