


1. Introduction
The success of designing innovative products and systems is largely dependent on the timely identification and integration of breakthrough technologies, particularly in today’s rapidly evolving environment (Jiang & Luo Reference Jiang and Luo2022; Liu et al. Reference Liu, Zhou, He, Liu and Dong2025). Companies like SpaceX, Nvidia (Vendrell-Herrero, Vaillant & Bustinza Reference Vendrell-Herrero, Vaillant and Bustinza2025) and Tesla, for instance, have leveraged technological advancements in their products to secure strong positions among market leaders.
Nevertheless, common systems engineering and product design methodologies tend to view new technologies primarily as potential risks to the products rather than opportunities for performance improvements. For instance, the NASA Systems Engineering Handbook emphasizes managing emerging technologies through formal risk-mitigation processes and warns against “overreliance on immature technology” (Hirshorn, Voss & Bromley Reference Hirshorn, Voss and Bromley2017), ensuring that system designs are based only on proven solutions. While risk minimization is essential, excessive caution can reduce a company’s innovative potential. For instance, as documented for NASA, its risk-averse culture prioritized conservative projects over ambitious ones, which in turn limited the agency’s ability to sustain integration competencies (National Research Council 2012).
At the same time, developing and integrating new technologies is a resource-intensive process, associated with uncertainties and requiring careful selection and integration of technologies. For this purpose, system architects must assess technology infusion concepts with varying levels of maturity, scale and application, weighing trade-offs between potential opportunities and associated risks. For example, in aerospace, this may involve deciding between adopting a new wing design or an innovative autopilot system – design options that are difficult to compare directly. This highlights a critical gap: a lack of structured methodologies that balance the potential benefits of a technology against its inherent risks, preventing organizations from making informed product design decisions.
Leading state of the art technology infusion evaluation methods, such as multi-objective Pareto-frontier analysis (Smaling & de Weck Reference Smaling and de Weck2007), model-based approaches like game-theoretic modeling (Yuskevich et al. Reference Yuskevich, Smirnova, Vingerhoeds and Golkar2021) or advanced tradespace exploration methods (e.g., Rüede et al. Reference Rüede, Chavy-Macdonald, Rinalducci, de la Osa, de Weck, Huang and Kneib2025), have greatly advanced the field. However, their applicability can be constrained by limited data availability. This limitation often occurs in early technology development phases, when detailed performance and financial models are unavailable due to technology immaturity. Additionally, notable approaches like Suh et al.’s (Reference Suh, Furst, Mihalyov and de Weck2010) Technology Infusion Analysis, which focuses primarily on incremental innovations, may be less applicable for assessing disruptive technologies whose growing impact remains underexplored in engineering design. Indeed, technologies like artificial intelligence or 3D printing not only enhance existing functions but also introduce entirely new features, shifting market dynamics (Majumdar, Banerji & Chakrabarti Reference Majumdar, Banerji and Chakrabarti2018). Traditional evaluation methods may fail to capture new usage scenarios, highlighting the need for an approach that not only measures technical performance improvements but also directly assesses the technology’s value to the customer. Moreover, existing approaches do not provide clear guidance on how to compare the value of technologies that greatly enhance a single product with the value of technologies that have a more moderate impact across multiple product families. This highlights the need for a metric that directly assesses the customer value of technology infusion while accounting for its varying impact on different products.
In an effort to address this, Stelvaga & Fortin (Reference Stelvaga and Fortin2022) introduced a preliminary version of the evaluation methodology combining expert assessments with the Delphi technique. While the methodology applied in the aerospace industry generated valuable insights, it relied heavily on subjective expert judgments, which can be influenced by inherent bias and uncertainty in scoring. This underscores a persistent limitation in early-stage evaluation – expert-based approaches suffer from possible subjectivity and bias, whereas data-driven methods depend on information typically unavailable at the time of critical strategic choices.
To address these challenges, our research investigates how designers can make informed, early-stage decisions about technology integration under data-limited conditions. The research question of this study asks: “Which essential factors should be considered for technology evaluation, and how can they be systematically quantified to support balanced decision-making in product development?” In response, we introduce PoLaRis, a comprehensive evaluation approach that formalizes and quantifies key trade-offs at stake in technology infusion decisions based on three major criteria: Leap Potential, Learning and Risk. Numerical measures for these three parameters are introduced, combining DSM (Design Structure Matrix) analysis, system complexity evaluation and a new author-developed metric that reflects a technology’s contribution to product value as perceived by the user (Technology Leap Potential).
The article is structured as follows. Section 2 reviews prior work on technology infusion evaluation frameworks. Section 3 describes the research methodology and the PoLaRis framework development process. Section 4 introduces the PoLaRis framework and specifies the numerical measures used to quantify the three evaluation criteria (Leap Potential, Learning and Risk). Section 5 applies PoLaRis to three smartwatch concepts and compares the numerical indicators with experts’ assessments. Section 6 concludes the article with a summary of contributions, implications for systems engineering practice, the framework limitations and directions for future research.
2. Literature review
2.1. Technology infusion decisions
Selecting and integrating emerging technologies early in development can substantially enhance product attributes and competitiveness (Wang et al. Reference Wang, Sha, Huang, Contractor, Fu and Chen2018). However, such decisions require considerable investment under uncertainty. To mitigate risks, companies often adopt a phased development path – progressing from laboratory experiments to technology demonstrations and eventually to full-scale implementation, with key decisions made at each stage (Fevolden et al. Reference Fevolden, Coenen, Hansen and Klitkou2017). Deciding whether to continue or halt technology development and infusion carries major financial and strategic implications.
The demonstration phase, typically corresponding to TRL 4–7 (Technology Readiness Level (Mankins Reference Mankins2009)), is particularly pivotal: it bridges exploratory research and market-ready product development and often determines whether a technology concept advances further (Phaal et al. Reference Phaal, O’Sullivan, Routley, Ford and Probert2011; Moultrie Reference Moultrie2015; Bobbe et al. Reference Bobbe, Opeskin, Lüneburg, Wanta, Pohlmann and Krzywinski2023). A demonstrator is a tangible artifact designed to prove the technical feasibility of a technology in a relevant environment (Montagna & Cantamessa Reference Montagna and Cantamessa2019). In practice, critical technology decisions are made with limited quantitative evidence, forcing firms to rely on unstructured judgment and risking both missed opportunities and misallocated resources.
Being inherently experimental and grounded in empirical activities, the demonstration phase also aligns closely with the concept of organizational learning as defined by Dutton & Thomas (Reference Dutton and Thomas1984). Owing to the physical nature of tests conducted during this phase, it also entails a substantial increase in both cost and organizational commitment. Nevertheless, few studies have sought to quantify the learning potential embedded in different technology demonstration concepts.
The literature review therefore covers existing approaches that support technology infusion assessment and complement demonstration activities, highlighting not only risk and benefit evaluation but also methods that capture the learning dimension.
2.2. Technology-infusion assessment methods
A common approach in assessing the impact of technology infusion in modern complex systems is to represent the system with abstract models that reflect both the original and modified product architectures. Design structure matrix (Eppinger & Browning Reference Eppinger and Browning2012) is a particularly popular tool for this purpose.
Many researchers focus on risk and uncertainty quantification when it comes to the technology infusion or product modernization. To mention a few, Riondet et al. (Reference Riondet, Rio, Bernardet and Zwolinski2024) applied Technology Readiness Levels and Manufacturing Readiness Levels (MRL) as indicators to assess risks associated with emerging technology deployment (Office of the Secretary of Defense Manufacturing Technology Program 2022). They proposed archetypes for technology upscaling and offered methodological advice on supporting each archetype. Wichmann, Gericke & Eisenbart (Reference Wichmann, Gericke and Eisenbart2021) proposed a method to support the adaptation of existing systems by offering an approach to advance risk assessment into earlier design stages. Alonso Fernández, Panarotto and Isaksson (Fernández, Iñigo & Isaksson Reference Fernández, Iñigo and Isaksson2024) investigated the risks associated with higher order effects and architectural impact of infusing new technology within a DSM-based method.
Garg et al. (Reference Garg, Eppinger, Joglekar and Olechowski2017) proposed a risk calculation approach based on the popular concept of risk as the product of likelihood and impact. In Equation (1), L 𝑖 denotes the likelihood of a component technology performing its function as intended, estimated through TRLs, whereas I 𝑖 measures system impact severity, assessed by analyzing architecture and component interfaces to estimate change propagation.
 $$ {\mathrm{Risk}}_i={L}_i\times {I}_i $$
Another system parameter that needs to be carefully investigated during technology infusion is complexity (Chullen & Nilchiani Reference Chullen and Nilchiani2021). Complexity has different perspectives, with three main categories in complex-system design: (1) structural, (2) functional or dynamic and (3) organizational complexity (Sinha Reference Sinha2014). Jung, Sinha & Suh (Reference Jung, Sinha and Suh2020) introduced a new metric based on the degree of relationship between the system requirements and elements to quantify the perceived design complexity. This study focuses on structural complexity, representing the system’s overall architecture.
Sinha & de Weck (Reference Sinha and de Weck2013) proposed the graph energy-based structural complexity index, which was selected to be integrated into the framework proposed by us. This system complexity index includes component, interface and architectural complexity components as shown in Figure 1.
Parts of structural complexity metric. Adapted from Sinha & de Weck (Reference Sinha and de Weck2013).

Component complexities (αi) are evaluated by TRL levels. Each interface complexity (β) depends on the connection type (energy, material, data flow, etc.) and component maturity. The coefficient β is set within the [0,1] range depending on these parameters. The architectural complexity parameter reflects system structure, distinguishing simple centralized and complex distributed architectures. It is calculated via DSM graph energy E(A) with γ as a normalization factor, typically 1/n, where n is the component count. More information and simple examples of computing complexity can be found in the original study (Sinha & de Weck Reference Sinha and de Weck2013). Min, Suh & Hölttä-Otto (Reference Min, Suh and Hölttä-Otto2016) later proposed an advanced method based on this metric, specifically adapted for analyzing the impact of technology infusion. Sinha & de Weck (Reference Sinha and de Weck2016) conducted an empirical validation of their proposed structural complexity metric using ball-and-stick model experiments and demonstrated that development effort increases superlinearly with increasing structural complexity.
While risks of technology infusion are well studied, its benefits remain underexplored in engineering design. Mankins (Reference Mankins2009) introduced the Technology Need Value metric to assess the significance of a technology effort for a program’s success. However, it does not evaluate the commercial potential or broader benefits of technology development, focusing instead on estimating chances of program failure without the targeted technology. Another conventional approach involves using utility functions (Smaling & de Weck Reference Smaling and de Weck2007), which are usually effective in scenarios where trade-offs between well-understood variables need to be optimized. However, they often require precise data inputs and are constrained by the need for clear definitions of utility for each attribute. This can be limiting in early-stage technology evaluation, where data are scarce or uncertain.
If technology infusion benefits are viewed as part of a broader concept of system value, the assessment should extend beyond technical and economic outcomes to include stakeholder and lifecycle effects. Recent work characterizes system value as a holistic, multidomain construct with characteristics such as context dependence, the gap between expected and experienced value, emergence and bias (Lavi & Reich Reference Lavi and Reich2024a). Relatedly, Lavi and Reich propose a multidomain system value model (SVM) as a structured aid for value-oriented decision making and comparison of alternatives (Lavi & Reich Reference Lavi and Reich2024b).
2.3. Comprehensive technology infusion evaluation frameworks
In the search for a structured approach to assess the pros and cons of introducing new technologies, methods from different knowledge domains were explored.
Roadmapping, commonly used in technology management (Phaal, Clare & Probert Reference Phaal, Clare and Probert2004; de & De Reference de and De2022), often involves intensive workshops with multidisciplinary experts. However, the outcomes of such workshops can be affected by personal biases and dominant voices. To minimize these effects, structured techniques like Delphi (Brown Reference Brown1968), Analytic Hierarchy Process (AHP) (Saaty Reference Saaty2008) or other Multi-Criteria Decision Analysis (MCDA) tools are employed.
Among these, the Delphi approach is well suited to early design stages, where data are limited and expert judgment is the primary information source. It systematically aggregates expert opinions from different domains while minimizing group pressure and bias. The process involves several iterative rounds: a facilitator gathers anonymous expert ratings and brief explanations, summarizes the results and invites participants to revise their assessments. Iterations continue until responses converge – typically when score variability falls below a predefined threshold or after a fixed number of rounds. By combining anonymity, controlled feedback and iteration, Delphi enables balanced consensus on complex issues, making it particularly effective for assessing emerging technologies under uncertainty. However, such workshops still require significant time and access to multiple qualified experts, which can limit their applicability when resources or schedules are constrained.
In addition to these general approaches, several quantitative, domain-specific frameworks have been proposed to formalize expert reasoning within predefined parameters. One notable example is NASA’s “X-factor,” which quantifies program difficulty by multiplying three parameters: Discovery, Complexity and National Benefit. However, it is tailored to aircraft programs and the needs of a specific government organization (National Research Council 2012), leaving a need for a method suitable for commercial application across different industries.
Moreno & Fortin (Reference Moreno and Fortin2020) combined the NTCP (Novelty, Technology, Complexity and Pace) approach from project management with quantitative architectural measures. However, this approach compared technology infusion concepts only against a baseline system and was not suitable for directly comparing different concepts with one another. Additionally, it lacked a quantitative measure of the benefits of technology infusion.
Smaling & de Weck (Reference Smaling and de Weck2007) proposed a notable methodology to assess the impact of introducing novel technology into existing systems. They used a fuzzy Pareto-frontier analysis to identify top product concepts and quantify performance gains. The Technology Invasiveness (TI) index, derived from a ΔDSM (delta DSM), estimated the cost of technology infusion. Finally, the authors assessed risks and opportunities by analyzing utility curves for the system’s technical performance. Later the methodology was adapted for financial analysis, using probabilistic marginal net present value (ΔNPV), calculated via Monte Carlo simulation, to replace the utility function for value assessment (Suh et al. Reference Suh, Furst, Mihalyov and de Weck2010). Recently, Moon & Suh (Reference Moon and Suh2023) expanded these studies for the assessment of the infusion of multiple technologies into a parent system.
While the last methodologies provide rigorous assessments, they require extensive data and simulations, which are often unavailable in early technology development stages. Moreover, they primarily address incremental innovations. However, with rapid advancements, disruptive technologies, for instance, LLMs, are increasingly redefining competition by introducing new performance dimensions (Arias-Oliva et al. Reference Arias-Oliva, Pelegrín-Borondo, Murata and Gauttier2021). This shift indicates a need for an approach that directly evaluates the impact on customer-centric metrics, beyond existing technical performance measures.
2.4. Learning and its measures in product development
Integrating a novel technology often requires the development of new models, methods or operational knowledge, thereby increasing the engineering team’s learning. Argote & Miron-Spektor (Reference Argote and Miron-Spektor2011) describe how in organizations people gain experience, turn it into knowledge, change how they work and share it with others – so performance improves over time and shows up as a learning curve (Dutton & Thomas Reference Dutton and Thomas1984). This study’s definition of learning aligns with Verstappen, Alblas & Etman (Reference Verstappen, Alblas and Etman2023): an increase in performance due to prior gained experience. From a systems view, learning occurs when teams adapt architectures, interfaces and processes in response to new technology.
Empirically, learning shows up as steeper learning curves, reduced rework/defects or growth in codified assets (e.g., patents, interface control documents, simulation models). The use of learning curves has proven to be an effective tool to quantify relationship between performance and experience. A learning curve is a model describing how performance (e.g., cycle time or unit cost) improves with experience across repeated iterations. In simple terms, a learning curve shows that as people repeat a task, they do it faster and with fewer mistakes, so the early losses from inexperience shrink (Argote Reference Argote2013).
Recent studies in product design have shown that complexity of architectural change can be used as a measure of learning. In particular, Dooper, Etman & Alblas (Reference Dooper, Etman and Alblas2022) empirically demonstrated the correlation between the magnitude of the product change and learning curve parameters. They ran an experiment where participants repeatedly assembled two variants of a Lego device – one simpler and one more complex – and then switched variants so the authors could measure how the complexity of change affects assembly time and successive learning curves. They observed that more novel (complex) change is associated with a bigger immediate dip and a worse asymptote in the next learning curve (assembly time vs. units). To quantify architectural change between two product versions, they calculated the complexity metric of so-called ΔDSM (delta DSM). Originally introduced by Smaling & de Weck (Reference Smaling and de Weck2007), the ΔDSM is a matrix that highlights architectural changes after product modifications, capturing only the new, removed or modified components and interfaces. Dooper et al. (Reference Dooper, Etman and Alblas2022) then quantified the structural complexity of the ΔDSM using the Sinha & de Weck (Reference Sinha and de Weck2013) metric, showing that the measured change in architecture empirically correlates with shifts in the learning curve. Interestingly, authors observed that adding components and interfaces made coordination slower and reduced performance, while removing parts had little immediate effect on performance.
Verstappen et al. (Reference Verstappen, Alblas and Etman2023) elaborated this with a virtual experiment design to statistically test how product commonality (of two product versions) predicts learning curve parameters (dip size, asymptote, slope). They also quantified product commonality via complexity of ΔDSM. These findings establish ΔDSM complexity as an empirical proxy for organizational learning, linking architectural change directly to observed learning outcomes.
However, it should be noted that learning curves, originally developed to describe productivity on the shop floor, capture only a part of organizational learning that occurs during technology infusion. They overlook other forms of knowledge accumulation – such as the creation of simulation models and trade-off curves – which often become a company’s most enduring technological assets. Nonetheless, learning curve indicators provide a practical baseline for quantifying experience effects and motivate research toward broader, numerically grounded measures of learning that encompass both production and design activities.
2.5. Literature review conclusions
In summary, the current methodologies for technology infusion assessment have notable limitations, particularly in supporting early-stage disruptive innovations. Existing approaches often underemphasize the learning gained through integrating new technologies, cross-product impacts and customer-centric value. Our study addresses these gaps by formulating a step-by-step methodology for multifaceted infusion assessment. Our framework integrates established risk (Garg et al. Reference Garg, Eppinger, Joglekar and Olechowski2017) and complexity (Sinha & de Weck Reference Sinha and de Weck2013) metrics while introducing a new metric to quantify technology potential.
3. Research methodology and PoLaRis framework development process
The research presented in this article followed the Design Research Methodology (DRM) proposed by Blessing & Chakrabarti (Reference Blessing and Chakrabarti2009). The development of the PoLaRis framework was carried out iteratively over 7 years and structured into two main development cycles, each encompassing the classical DRM stages – Research Clarification, Descriptive Study I, Prescriptive Study and Descriptive Study II – thereby ensuring both scientific rigor and practical relevance. Figure 2 summarizes the overall research process and its alignment with the classical DRM stages, illustrating how the two development cycles collectively contributed to the evolution of the PoLaRis framework.
PoLaRis framework development process mapped to design research methodology stages. *Described in detail in Stelvaga & Fortin (Reference Stelvaga and Fortin2022).

The first development cycle was carried out in collaboration with a leading aerospace corporation, resulting in the initial draft of the PoLaRis framework. During the Research Clarification stage, an extensive literature review examined existing methods for technology evaluation and prioritization in complex systems, focusing on aerospace and other high-tech industries. This stage was complemented by a series of informal discussions with industry experts to identify gaps in current decision-making processes, specifically the lack of structured approaches to integrate expert judgment with traceable, system-level reasoning.
Three on-site workshops at the aerospace corporation were organized during the subsequent stages, involving five senior and midlevel managers – four experts in demonstrator projects and one budget decision maker – each with over 15 years of industry experience. Two of the workshops spanned two full days each, while the third lasted one full day. In the Descriptive Study I stage, Workshop 1 examined the industrial context and project scope in depth. During the Prescriptive Study stage, Workshop 2 was held to test and compare several opinion-elicitation techniques (e.g., AHP, Delphi) and identify the most suitable one for capturing expert judgment in a given industrial setting. During the Descriptive Study II stage, Workshop 3 focused on the preliminary validation of the proposed approach through its application to the real demonstrator case – the BLADE project (“Breakthrough Laminar Aircraft Demonstrator in Europe”). Participants noted that beyond methodological outcomes, applying the framework encouraged valuable interdisciplinary dialog and promoted shared understanding across departments. More details on this first development cycle are provided in Stelvaga & Fortin (Reference Stelvaga and Fortin2022).
While the methodology demonstrated its usefulness and gained generally positive feedback from industry, it also faced several limitations, most notably its heavy reliance on expert scoring. Moreover, averaging multidisciplinary expert inputs offered a broad perspective (e.g., from mechanical, propulsion and financial domains) but could unintentionally underweight the systems architect’s viewpoint – central to technology infusion decisions. To address these shortcomings, the second development cycle focused on creating a complementary numerical approach within PoLaRis, aimed at balancing subjective expert judgment with more objective, model-based indicators from system architecture analysis.
We began by revising the Research Clarification stage, conducting an extensive review of quantifiable methods for technology infusion, complemented by insights gathered during previous workshops at the aerospace company. In the Prescriptive Study stage, a new quantitative version of the framework – Numerical PoLaRis – was developed to measure Leap Potential, Learning and Risk using DSM-based metrics.
The Descriptive Study II stage focused on two case studies conducted within a new industrial context – the wearable electronics industry – thereby testing the framework’s applicability to a broader range of products. Eleven experts with 5–15 years of experience participated in Case Study 1, which assessed three technology infusion concepts for next-generation smartwatch design using the earlier expert-opinion version of the PoLaRis approach. Case Study 2 applied the newly developed Numerical PoLaRis to the same three wearable technology concepts, enabling a direct comparison between the two approaches. This comparison validated the internal consistency of PoLaRis and offered insights into how expert-opinion and numerical assessments can jointly support early-stage technology infusion decisions.
4. Proposed PoLaRis framework
This research presents the PoLaRis framework for evaluating technology infusion concepts, named after the key evaluation criteria: Leap Potential (or Potential to Leap), Learning and Risk. The framework includes two complementary components: E-PoLaRis and N-PoLaRis. Both approaches eventually produce concept evaluations based on the same three parameters – Leap Potential, Learning and Risk – though they achieve this through fundamentally different methodologies.
E-PoLaRis is based on feedback from a group of experts, using the Delphi opinion elicitation technique, and N-PoLaRis represents a significant evolution by introducing DSM-based quantitative methods for more precise and objective evaluation (Figure 3). To quantify Leap Potential in the N-PoLaRis approach, a novel Technology Leap Potential (TLP) metric is proposed.
The PoLaRis framework.

In practice, both approaches can be combined if resources allow, or a single method can be chosen depending on the availability of skilled experts and architectural data.
Both approaches use three key criteria to assess the impact of a technology infusion on a product:
-
• Leap Potential encapsulates the ambitions of infused technology to deliver substantial enhancements to the product and unlock future commercial opportunities, including synergetic effects across multiple products.
-
• The Learning criterion specifies how much knowledge the organization potentially accumulates from infusing a technology. It depends on the scale and complexity of necessary system model upgrades. Unlike Risk, which is inherently negative and should be minimized, or Leap Potential, which is inherently positive and should be maximized, Learning has a double-sided nature: on one hand, it demands effort and investment in R&D to master new methods and architectures, while on the other hand it generates valuable long-term assets – such as digital models, patents and codified know-how – that can be leveraged across future projects.
-
• Risk represents the aggregated risk of technology infusion into a certain product. Risk rises with technology components’ immaturity.
4.1. E-PoLaRis
In E-PoLaRis (expert-opinion PoLaRis), a multidisciplinary group of experts evaluates technology infusion concepts based on the three key parameters.
To elicit experts’ opinions, a methodology proposed by Stelvaga & Fortin (Reference Stelvaga and Fortin2022) was modified and employed. The original approach evaluated a comprehensive set of parameters, like environmental impact and manufacturing readiness, before focusing on three key criteria. In this study, changes included bypassing this comprehensive stage and expanding the scoring scale from 1–3 to 1–5 for precision. Updated instructions are provided in Table 1.
Detailed E-PoLaRis scoring instructions for experts.

4.2. N-PoLaRis
In N-PoLaRis (numerical PoLaRis) (Figure 4), the same three criteria – Leap Potential, Learning and Risk – are numerically evaluated by a system architect. To quantify Leap Potential, we introduce the TLP metric. Risk and Learning are measured through DSM analysis, leveraging existing methods for structural complexity and system integration risk, with adaptations detailed in the following sections.
-
• To quantify Leap Potential, we introduce a novel metric, the Technology Leap Potential (TLP). Detailed TLP calculation instructions are provided in Section 4.2.1.
-
• Learning is defined from an engineering standpoint, as the magnitude of the architectural change caused by a technology infusion. We build a ΔDSM that lists only what changed – added, removed or modified components and interfaces – and then compute its structural complexity with a topology-based metric. In this approach, higher ΔDSM complexity implies greater Learning.
-
• We propose evaluating Risk based on changes in system integration risk. For the sake of data consistency, we present the risk assessment results on an inverted scale, where a higher score corresponds to lower risk.
Overview of the Numerical PoLaRis (N-PoLaRis) approach.

To obtain a technology infusion profile as illustrated in Figure 4, we propose a step-by-step process shown in Figure 5. If a technology has the potential to be inserted into several products, then the whole process has to be replicated for each product type.
-
• Step 1: First, the baseline system and technology infusion system concepts are identified.
-
• Step 2: Second, potential performance benefits from technology infusion are estimated by Technology Leap Potential (TLP) index calculation. More details on TLP equations and simple examples are provided in Section 4.2.1.
-
• Step 3: Then a baseline system should be decomposed in logical components (subsystems and elements) to constitute the original DSM. The level of granularity should be chosen to ensure relevance across all technologies considered for infusion. Relationships between components and their types must also be identified.
-
• Step 4: As the next step, different technology infusion concepts are to be defined. Then the system architect has to construct DSM representations of these concepts.
-
• Step 5: Once system models have been created, Risk values associated with both: the baseline system and the system with the integrated technology are calculated. We employ the technology integration risk metric introduced by Garg et al. (Reference Garg, Eppinger, Joglekar and Olechowski2017), which is rooted in TRL assessment and system architecture analysis (Equation (1)). In the considered study, the authors provided instructions only for element risk measurement not specifying calculations of the total system risk. We suggest calculating total system risk as the sum of elements’ risks.
-
• Step 6: Then delta ΔRisk is calculated as the difference between values for baseline system and technology-infused system according to Equation (2). Notably, the Risk of the baseline system is nonzero and serves as calibration factor.
 $$ {\varDelta Risk}_{\mathrm{tech}}={Risk}_{tech-infused\ system}-{Risk}_{baseline}\hskip2.759999em $$
-
• Step 7: Learning is then quantified as the complexity of the architectural change. For each technology infusion concept, a ΔDSM (delta DSM) is constructed by comparing the baseline and technology-infused DSM so that all added, removed and modified components and interfaces are captured. We then calculate the structural complexity of this ΔDSM using the energy-based complexity index of Sinha and de Weck. This complexity is used as the Learning measure: higher complexity means greater Learning (Equation (3)). The detailed equations for structural complexity are provided in Section 2.2.
 $$ {Learning}_{tech}={Complexity}_{Delta\hskip0.32em DSM\_ tech}\hskip2.52em $$
N-PoLaRis process of technology infusion concept evaluation.

ΔDSM is a matrix that captures structural differences between a baseline system and its modified version. To construct it, all off-diagonal marks are cleared from the baseline DSM. Then, only the changed elements are added back: new, removed or modified components and interfaces. Unchanged interfaces are left blank, so the ΔDSM directly shows only what has changed. In this article, we use a simple visual coding: green for new components and interfaces, red for removed ones, orange for modified ones and blue for unchanged. Figure 6 illustrates an example ΔDSM construction. Building on Dooper et al. (Reference Dooper, Etman and Alblas2022), who found that adding new components affects system performance more than removing them, different interface weights are assigned in the ΔDSM to reflect the effort of each change – higher for added components, moderate for redesigned ones and lower for removed components.
-
• Step 8: Finally, Learning is estimated as a structural complexity of ΔDSM which is calculated based on the energy-based index introduced by Sinha & de Weck (Reference Sinha and de Weck2013). The detailed equations are provided in Section 2.2.
-
• Step 9: In this step, the final technology infusion profiles are generated. We recommend inverting the risk scale so that higher values consistently represent a more favorable technology infusion concept across all three parameters: Leap Potential, Learning and Risk.
-
• *Step 10: Optional. The Leap Potential, Risk and Learning values obtained previously can be used to compare product concepts as is. By default, all results are relative, reflecting the impact of technology infusion compared to the baseline system, with Leap Potential, Learning and Risk measured on different unbounded scales. While these results can already be used for concept selection, normalizing them can simplify analysis. Section 5.2 provides an example with normalization to a 1 to 5 scale.
Construction of ΔDSM (delta DSM). Panel (a) shows baseline system. Panel (b) reflects changed system including redesigned component B, removed component C and added component E. Panel (c) shows ΔDSM.

4.2.1. Quantifying leap potential
To numerically assess the Leap Potential criterion within the Numerical PoLaRis approach, we introduce the Technology Leap Potential (TLP) metric. This novel measure quantifies the overall positive impact of a technology on product performance and design, capturing its aggregated benefits across multiple functions and product types.
 $$ \hskip0.48em TLP={\sum}_{i=1}^n{Impact}_{CNi}\times {Value}_{CNi} $$
The Technology Leap Potential on a single product (Equation 4) is calculated by summing the individual impacts of the infused technology on each customer need i (Impact CNi) multiplied by the value of customer need i (Value CNi) for the product user, across all customer needs from i = 1 to n, where n is the total number of customer needs.
We define a customer need (CN) as any product function or attribute desired by the customer, prioritizing their perspective over engineering specifications when developing the needs list. This ensures a focus on customer priorities without prematurely constraining how technologies might meet those needs. Our approach is particularly suited to disruptive technologies, which can impact not only technical parameters but also introduce entirely new product features. To accommodate this, customer needs are expressed at a higher level of abstraction. Enterprise needs, such as manufacturing cost, may also be included if affected by the technology. Typically, the needs list includes 5–10 dimensions which should be selected to differentiate among the compared concepts.
Once the needs list is compiled, the team assigns importance weights (Value CNi) to each customer need. Various schemes, such as assigning values from 1 to 5 or distributing 100 percentage points, can be used. Different methods exist for deriving weights from customer data, such as those based on quality function deployment (Li, Du & Chin Reference Li, Du and Chin2018). Other authors applied the Fuzzy KANO model and Coefficient of Variation method to weigh evaluation criteria, assisting designers in objectively understanding user requirements (Qu, Ren & Wu Reference Qu, Ren and Wu2024). However, for the purpose of concept selection, the Value CNi parameters can be determined subjectively by team consensus.
Then the individual impacts of technology on each customer need (Impact CNi) are defined. Our framework categorizes the impact levels into three distinct tiers depending on how strongly technology affects a certain function of the target system (Figure 7).
-
1. Stepwise improvement (low tech novelty / low product–market novelty): This tier refers to small improvements that address user needs, optimizing product capabilities with valuable, nondisruptive upgrades to enhance user experience. An example is the Autoland system on the Cirrus Vision Jet, which enables autonomous landings during emergencies, resulting in a moderate improvement in the aircraft’s operational safety.
-
2. Second tier is represented by two distinct subgroups:
-
2.1. Frontier push (high tech novelty / low product–market novelty): This tier reflects a significant enhancement in the performance of existing product functions, indicating a higher level of technological advancement and integration. An example is the adoption of 5G in smartphones, which significantly improves connectivity speeds, enhancing mobile Internet and enabling faster data transfers crucial for streaming and gaming.
-
2.2. Leverage point (low tech novelty / high product–market novelty) impact: This tier captures cases where subtle technological refinements deliver substantial market gains. An illustration is the adoption of blended winglets on commercial aircraft – a simple wingtip redesign that reduced drag and fuel consumption, extending range and cutting costs. This small aerodynamic improvement led to major fuel savings, extended range and lower emissions, transforming airline economics.
-
-
3. Capability leap (high tech novelty / high product–market novelty): The third and most impactful tier represents the ability to unlock entirely new functionalities or open up new market segments. It highlights the potential of technology infusion to drive market disruption and foster innovation. An example is SpaceX’s Starlink project, which deployed a large constellation of small satellites to provide global high-speed Internet coverage, disrupting traditional satellite services and opening new markets for broadband connectivity.
Proposed three-level scale for scoring technology impact.

If a number of products are affected by the considered technology, our approach is extended as proposed in the Equation (5).
 $$ {\displaystyle \begin{array}{c} TLP={\sum}_{j=1}^m{TLP}_{product\;j}\times {W}_{product\;j}\;\\ {}\hskip5.52em ={\sum}_{j=1}^m{\sum}_{i=1}^n\left({Impact}_{CNij}\times {Value}_{\mathrm{C} Nij}\;\right)\times {W}_{product\;j}\end{array}} $$
The cumulative TLP is derived by aggregating the Technology Leap Potential of each individual product j (TLP productj), multiplied by the product-specific weight W productj. W productj reflects the product’s importance, which can be quantified through metrics such as revenue contribution or alignment with company strategic goals.
4.2.2 Illustrative example of Technology Leap Potential (TLP) calculation
Let us calculate TLP for a simplified example of an emerging technology infused into two products (Table 2). Product #1 and Product #2 may represent any two product types benefiting from the same technology infusion – for example, a smartwatch and a smart ring enhanced with new battery technology under evaluation. Relevant user needs may include battery performance, durability, comfort or other attributes influencing overall user experience.
Illustrative example of Technology Leap Potential calculation for technology infused into two products and affecting only one customer need – Need #6

First, let us consider that this technology has a slight impact on only one customer need: Need #6. In other words, it falls under the first tier, providing a small technological improvement, e.g., a moderate battery-life improvement in a smart ring and a smartwatch ( $ {Impact}_{TechnologyPerformance\_ product1} $
=
$ {Impact}_{TechnologyPerformance\_ product1} $
= $ {Impact}_{TechnologyPerformance\_ product2} $
= 1). Second, let us take into account that this need #6 is more critical in the design of a Product #2 compared to a Product #1 due to the unique use case scenarios. For example, improving battery performance is more important in smart ring design than in smartwatch design because of the smaller form factor. Therefore, let us assign
$ {Impact}_{TechnologyPerformance\_ product2} $
= 1). Second, let us take into account that this need #6 is more critical in the design of a Product #2 compared to a Product #1 due to the unique use case scenarios. For example, improving battery performance is more important in smart ring design than in smartwatch design because of the smaller form factor. Therefore, let us assign $ {Value}_{TechnologyPerformance\_ product1} $
= 0.1 (smartwatch) and
$ {Value}_{TechnologyPerformance\_ product1} $
= 0.1 (smartwatch) and $ {Value}_{TechnologyPerformance\_ product2} $
= 0.2 (smart ring). Finally, assuming the simplest case where both types of products are equally important to the company (
$ {Value}_{TechnologyPerformance\_ product2} $
= 0.2 (smart ring). Finally, assuming the simplest case where both types of products are equally important to the company ( $ {\mathrm{W}}_{Product1} $
=
$ {\mathrm{W}}_{Product1} $
= $ {\mathrm{W}}_{Product2} $
= 1), we would get:
$ {\mathrm{W}}_{Product2} $
= 1), we would get:
 $$ {\displaystyle \begin{array}{c}TLP={Impact}_{TechnologyPerformance\_product1}\times {Value}_{TechnologyPerformance\_product1}\\ {}\hskip-4.2pc \times {W}_{Product1}+{Impact}_{TechnologyPerformance\_product2}\\ {}\hskip-4.7pc \times {Value}_{TechnologyPerformance\_product2}\times {W}_{Product2}\\ {}\hskip-9.2pc =(1\times 0.1)\times 1+(1\times 0.2)\times 1=0.3\end{array}} $$
A more detailed industrial example and guidance on interpreting the results is provided in Section 5.
5. PoLaRis application to smartwatch concepts evaluation
The proposed PoLaRis framework was applied to evaluate three smartwatch design concepts infused with next-generation technologies. Three real, cutting edge technologies were examined in detail. Table 3 summarizes information about the companies developing these technologies and the data collection methods. For confidentiality, the names of two companies and the corresponding technology titles have been anonymized, while Philips Biosensing technology is presented under its real name. Thus, SensorProcessingUnit, IndirectSkinSensor, XYZtech and WellbeingSmartwatch are pseudonyms; however, all technical performance details have been retained as accurately as possible. The three participating companies represent different scales – from small- and medium-sized start-ups to a large international corporation. Each company holds patents on its respective invention, demonstrating a clear high-technology focus. Philips Biosensing technology has a substantial body of publicly available information, including scientific publications, white papers and technical documentation. For the other two companies, technological data were obtained from one-on-one interviews, as well as from patents, white papers and official company websites.
List of technologies and characteristics of companies developing those

Technologies under evaluation aim to overcome some of the most critical technological obstacles, including improving power consumption in wearables, enhancing the accuracy of sensor data processing, and introducing new types of sensors with algorithms for human stress recognition. A short summary of considered technologies is represented in the Table 4. Figure 8 provides visual illustrations of one of the considered technologies.
Summary of three compared technology infusion concepts

Illustrations of one of the evaluated technology infusion concepts – Biosensing. (a) Active and reference wet electrodes placed on the palm and forearm. (b) Dry electrodes integrated into a wristband positioned behind the ulna. Adapted from van der Mee et al. (Reference van der Mee, Gevonden, Westerink and de Geus2021).

Three emerging technology infusion concepts were evaluated from the perspective of a product development company looking to integrate these innovations into their next-generation smartwatches. This case study focused on implementing these technologies within a single device – a smartwatch – while deliberately excluding their potential applications in other types of devices, such as electronic rings.
The following input data were collected from the companies:
-
- Detailed technology descriptions and TRL assessments
-
- Unified smartwatch decomposition into 8 subsystems and 26 components
-
- Interfaces between components in baseline and upgraded systems
-
- System architectural changes with each of the three technologies infused
Despite the rapid growth of the wearable devices market (Liao, Tanner & MacDonald Reference Liao, Tanner and MacDonald2020), the widespread adoption of wearables, such as fitness trackers or rings, is still limited by key issues like the need for efficient energy management, enhanced data accuracy and reliability in health monitoring, which must be addressed for the industry to meet its expected scale (Stelvaga & Fortin Reference Stelvaga and Fortin2017; Loncar-Turukalo et al. Reference Loncar-Turukalo, Zdravevski, da Silva, Chouvarda and Trajkovik2019). These challenges make wearables an ideal test case for this methodology.
The PoLaRis framework was applied in two case studies (Figure 9). The first case study employed the E-PoLaRis approach and involved 11 multidisciplinary industrial experts evaluating three smartwatch technology infusion concepts. The second one used N-PoLaRis, where a single system architect utilized a DSM analysis and the TLP metric to assess the same concepts. The results of E-PoLaRis and N-PoLaRis were then analyzed and compared for internal consistency.
Case studies summary.

5.1. Industrial Case Study 1: E-PoLaRis approach
In the first case study, a multidisciplinary panel of 11 experts evaluated three technology infusion concepts for a smartwatch: SensorProcessingUnit, Biosensing and IndirectSkinSensor. The panel possessed 5 to 15 years of experience in fields including Electrical Engineering, Data Science, Biotechnology and Systems Engineering. A full-day online workshop was conducted where experts evaluated the concepts using the E-PoLaRis (expert-opinion PoLaRis) framework. Data were collected anonymously through an online platform. Experts were given descriptions of smartwatch design options and detailed scoring instructions (Table 1).
The Delphi technique was applied to find consensus between participants. We used the coefficient of variation (CV) as the termination criterion (Equation (7)), with a CV = 0.5 indicating agreement. In other words, CV of scores higher than 0.5 for certain criteria indicated disagreement and the need for additional rounds.
The distribution of scores from the first round of technology infusion concepts evaluations is represented as a boxplot in Figure 10.
Distribution of the first-round evaluation results by the expert panel in Case Study 1. Black diagonal stripes indicate criteria without consensus among the experts after the first evaluation round.

Each of the three plots summarizes the expert evaluation for one technology infusion concept, assessing three parameters: Leap, Learning and Risk, each scored from 1 (low) to 5 (high). The solid black bar represents the distribution of the scores – specifically, the interquartile range (IQR) containing the middle 50% of the responses (marked with “x”). The box plots reveal the initial spread of expert opinions for each criterion (Leap, Learning, Risk) across the three concepts. A key observation from Figure 10 is the significant initial disagreement on several criteria. For the SensorProcessingUnit and IndirectSkinSensor concepts, experts showed strong divergence in their assessment of their Leap Potential. For the Biosensing concept, a high level of disagreement was focused on the Risk. These parameters of disagreement are highlighted with black diagonal stripes.
To achieve convergence, we shared these results with the experts followed by an anonymous exchange of comments where experts could explain their scoring rationales. A second Delphi round was then conducted and experts were allowed to revise their opinions. This resulted in consensus on all criteria, indicating that two rounds were sufficient. The final scores are presented in Table 5.
Results of E-PoLaRis

Note: Each E-PoLaRis value represents the mean score of 11 experts’ opinions.
The results show that SensorProcessingUnit has the highest Leap Potential, owing to its applicability across multiple devices – from earbuds to neurointerfaces – and the lowest integration risk due to its compact chip design replacing several older components. IndirectSkinSensor exhibits the highest Learning, as it relies on fundamentally new physical principles and will generate substantial integration know-how. Biosensing holds intermediate values across all criteria, being less disruptive than IndirectSkinSensor, but more specialized than SensorProcessingUnit. More details on the interpretation of the results are presented in Section 5.3.
5.2. Industrial Case Study 2: N-PoLaRis approach
In the second Case Study, the system architect applied N-PoLaRis (Numerical PoLaRis), with its step-by-step implementation detailed in the following sections.
Step 1. Identify baseline system and technology infusion concepts
The technologies considered are designed for their potential integration into various smartwatches and fitness trackers by major electronics manufacturers. For this case study, we used a generalized smartwatch architecture as the baseline system, rather than focusing on any specific model, to ensure broader applicability. An exploded view of an Apple Watch is shown in Figure 11 as an illustrative example, though the study was based on an abstracted design.
Apple watch exploded view (IHS Technology 2015).

Step 2. Calculate Technology Leap Potential
To evaluate the commercial potential and positive impact of the three considered concepts, the Technology Leap Potential (TLP) metric has been calculated for each. First, a comprehensive list of customer needs for the smartwatch was compiled, covering 10 dimensions with sufficient granularity to distinguish between the evaluated technologies. Next, weights were assigned to all customer needs, with the weights normalized to a sum of 1. Attributes representing basic user needs, generally assumed by customers, were assigned smaller weights. In contrast, advanced needs, translating into unique features and more likely to impact customer choices among competing smartwatches, received higher weights (Table 6).
Results of TLP calculation for the three compared technology infusion smartwatch concepts

As shown, both the SensorProcessingUnit and IndirectSkinSensor concepts received a TLP score of 0.4, while the Biosensing concept scored slightly lower at 0.3. This difference can be attributed to the broader functional impact of the first two technologies. The SensorProcessingUnit concept slightly contributes to three key user needs – health monitoring, wellness and battery performance – delivering strong overall value in areas highly prioritized by smartwatch users. In contrast, the IndirectSkinSensor concept strongly enhances the wellness and comfort dimensions by enabling advanced stress detection, including for underserved user groups with elevated skin sensitivity, such as those who have reported discomfort and irritation when using standard skin-conductance sensing devices. Thus, IndirectSkinSensor offers a noticeable leap in functionality. Meanwhile, the Biosensing concept, while improving the precision of stress detection, is more narrowly focused and does not contribute to other major user needs such as comfort or battery life – resulting in a modestly lower TLP score.
Step 3. Construct baseline system DSM
Then the DSM representation of the baseline smartwatch system was constructed, consisting of 8 subsystems and 26 components, as shown in Figure 12. We used the IR/FAD DSM convention, with inputs in rows and outputs in columns. As most component connections are of the same nature (information flow, energy flow and spatial arrangement), a binary DSM was chosen.
DSM representation of smartwatch baseline system.

Step 4. Construct DSMs of technology infusion system concepts
Three binary DSMs for the product upgraded with the considered technologies were constructed. Each infused technology has been represented as a number of components. For example, Biosensing technology was represented as two components: EDA sensor itself and Analog Front End (AFE) module (Figure 13). Due to space limitations, only one of the three technology infusion DSMs is presented.
DSM representation of the Biosensing concept. Novel components added due to the technology infusion are highlighted in green color.

Step 5. Calculate Risk of baseline system and technology infusion system
The baseline system components are assumed to have the highest possible TRL of 9, reflecting that the smartwatch is already in production. TRL levels for components representing infused technologies were determined using data from industrial partners. In some cases, baseline components require redesign, lowering their TRL. For example, in the Biosensing concept (Figure 13), the aluminum housing must be redesigned to accommodate new EDA sensor electrodes, reducing its TRL to 7. The main components with a TRL below 9 are listed in Table 7.
Components with the lowest TRL levels across the three compared concepts

In the next step, components’ TRL levels and nodal degrees were converted into Likelihood and Impact via normalization on 1–10 scale (Figure 13). Lower TRL values corresponded to higher Likelihood, while higher nodal degrees indicated greater Impact. To ensure comparability across all three technologies, the min and max TRL levels and nodal degrees from all four DSMs were set as boundaries for the 1–10 scale. For example, the “Capacity EDA layout” component in the IndirectSkinSensor technology, with TRL 3, was assigned the highest risk value of 10. Each component Risk was calculated as the product of its Likelihood and Impact (Equation (1)). Total system Risk for each concept was determined by summing the components Risks.
Step 6. Calculate Risk (ΔRisk)
To calculate the delta ΔRisk, the baseline system Risk values were subtracted from the values of technology infusion concepts (Equation (2)).
Steps 7 and 8. Construct the ΔDSM and compute its structural complexity
For each concept, a ΔDSM was constructed as the difference between the baseline and technology infusion DSMs. Using a Python-based computational script developed by the authors, the eigenvalues of the ΔDSM adjacency matrix were calculated to derive the graph energy and the total structural complexity based on established mathematical measures. Component complexities were determined from TRL values mapped to a 1–10 scale consistent with the risk calculation, where lower TRL values indicate higher complexity. To capture the varying effort and learning potential, interface complexities in the ΔDSM were assigned different weights. Adding a new component demands the greatest effort and yields more knowledge; therefore, its interfaces were assigned the highest weight of 1.0. Interfaces involving a redesigned component were weighted 0.6, and those with removed components 0.3, as removal is easier and provides less learning. The resulting complexity of change and risk values for all smartwatch concepts are reported in Table 9.
Steps 9 and 10. Results normalization and representation
The resulting Leap Potential (TLP), Risk (ΔRisk) and Learning (Structural Complexity of ΔDSM) values are presented in Table 9.
An important objective of these case studies was to compare the results of the E-PoLaRis and N-PoLaRis approaches. A key challenge in this comparison lies in their differing scoring systems: experts’ scores in E-PoLaRis are limited to a 1–5 range, while N-PoLaRis scores are unbounded (Table 9). Essentially, results of N-PoLaRis represent relative scoring within the analyzed set of concepts, whereas the E-PoLaRis outputs the absolute values, comparing product concepts to a global maximum and minimum baseline.
To address this issue, we decided to normalize the N-PoLaRis approach output to align with the E-PoLaRis 1 to 5 scale. For this purpose, we introduced a benchmark wearable technology concept that would score a 5 in Leap Potential, Learning and Risk according to the scoring instructions in Table 1. We then calculated the N-PoLaRis values for this benchmark concept and treated these as the maximum possible scores, rescaling the numerical values accordingly. While simpler alternatives like min–max or percentile normalization based on the evaluated concepts were considered, they risked compressing the scale and distorting score interpretation. The benchmark, by contrast, ensures consistency, interpretability and conceptual alignment with expert scoring definitions.
We have introduced Flexible Battery technology as a benchmark concept. This technology offers a notable advancement for smartwatches by improving energy density while optimizing the ergonomic design of wearable devices. Through the use of advanced materials and innovative electrolyte compositions, these batteries can bend and conform to the wrist without sacrificing performance or safety. However, it also introduces substantial integration challenges and risks related to power management, durability under physical stress and compatibility with existing PCB architectures.
The N-PoLaRis related Leap, Learning and Risk were calculated for this concept. From the TLP calculations in Table 8, we conclude that the TLP value for this technology is 1.0. This value serves as the theoretical maximum.
TLP calculation for benchmark “maximum impact” concept – Flexible Battery technology

Note: Resulting TLP score of 1.0 serves as the theoretical maximum for rescaling the TLP values of the other three concepts.
We assumed that the infusion of Flexible Battery technology would reduce the TRL of three DSM components (Battery, Wireless Battery Charger and PMIC (Power Management Integrated Circuit)) to TRL 3. Additionally, the Aluminum housing, Watch strap and Side buttons components would drop to TRL 4 due to the significant redesign required to accommodate a flexible battery presumably located around the wrist. Both PCBs are assumed to drop to TRL 7. Given these adjustments, the RiskMAX was calculated to be 224.5, and the LearningMAX to be 83.2 (Table 9). These benchmark values were considered to be equal to 5 in E-PoLaRis and used as constants to rescale scores for the main three considered technological concepts. Final normalized results are presented in Table 9.
Final results of the N-PoLaRis approach for the smartwatch concept selection

Note: The use of benchmark technology infusion concept and the normalization process are detailed in Section 5.2.
5.3. Results analysis
In this section, we present and analyze the final results of the two approaches: E-PoLaRis and N-PoLaRis. First, we provide a general comparison of the results obtained from both methods. Then, we independently analyze Leap Potential, Risk and Learning to assess how well the mathematical methods in N-PoLaRis match expert opinions on the same criteria. Finally, we assess the concept profiles generated by the both approaches and offer practical guidance on selecting the most appropriate product concept for industrial application.
5.3.1. Comparison of the two approaches results
The final results are presented in Table 10. The N-PoLaRis represents values of the numerical approach calculated by a single product architect, normalized to the 1 to 5 range. The E-PoLaRis presents the results of the Delphi-based approach, where each value represents the mean score of the 11 participating experts’ ratings. The same results are also represented in the form of spider diagrams for better visualization in Figures 14 and 15.
Comparison of results of E-PoLaRis and N-PoLaRis approaches

Note: Each E-PoLaRis value represents the mean score of eleven experts’ opinions.
Technology infusion concepts profiles based on E-PoLaRis (expert-opinion PoLaRis) approach.

Technology infusion concepts profiles based on N-PoLaRis (numerical PoLaRis) approach.

Overall, the results of N-PoLaRis introduced in this article demonstrated a strong alignment with the E-PoLaRis results, as indicated by a Pearson’s correlation coefficient of 0.72 and a p value of 0.029. This confirms that the N-PoLaRis approach accurately reflects the expert evaluations. Although based on a limited sample size (9 pairs of values), the findings provide important insights and promising evidence for the internal consistency of the proposed N-PoLaRis and E-PoLaRis approaches.
5.3.2. Discussing N-PoLaRis effectiveness in capturing Leap Potential, Risk, and Learning
Since each criterion (Leap Potential, Learning, Risk) in N-PoLaRis was assessed using a different mathematical method, we will next analyze how well each metric aligns with expert opinions.
Concerning the Leap Potential parameter, the TLP metric introduced in the N-PoLaRis approach has proven to be an effective numerical method for its assessment. The most significant difference appeared in the Leap Potential rating for SensorProcessingUnit, which scored 3.9 in E-PoLaRis but only 2 in N-PoLaRis (Table 10). After discussing these results with the experts involved in the Delphi evaluation, it became clear that the difference was due to our study focusing solely on smartwatch integration. SensorProcessingUnit, however, can also be integrated into electronic rings, earbuds and other devices, unlike Biosensing and IndirectSkinSensor technologies, which are limited to smartwatches. Consequently, experts using the E-PoLaRis method rated SensorProcessingUnit Leap Potential higher, considering its broader integration possibilities. Including smart rings and other devices in the analysis would most likely bring TLP results even closer to experts’ evaluations.
With respect to the Risk criterion, calculated based on the architecture and TRL of integrated components, it aligns well with expert opinions. Therefore, we assume that overall Risk can be effectively estimated by measuring changes in system integration risk between the baseline and infused systems.
Utilizing the structural complexity metric as a quantitative indicator of Learning shows a general correlation with expert assessments, where greater complexity of ΔDSM aligns with higher Learning values. The greatest discrepancy between the results was observed for SensorProcessingUnit (1.8 in N-PoLaRis versus 1.4 in E-PoLaRis). This may be explained by the fact that SensorProcessingUnit replaces up to four older components, whereas the Biosensing and IndirectSkinSensor concepts only add new ones. As a result, the ΔDSM for SensorProcessingUnit is substantially larger, with most of the affected components being removed rather than added. According to Dooper et al. (Reference Dooper, Etman and Alblas2022), component removal contributes less to performance improvement than component addition. In an attempt to reflect this, we assigned a smaller interface weight for removed components (0.3 vs. 1.0 for added ones), though these values may require refinement. Overall, using ΔDSM-based structural complexity as an estimate of Learning appears promising, as it captures both the addition and removal of components during technology infusion and provides a preliminary quantitative measure of Learning.
We recommend two complementary directions for future work. First, a sensitivity analysis could be conducted to examine how variations in key model parameters – such as interface weights or component values – affect the Learning score. This would help identify which assumptions most strongly influence results and evaluate the model’s robustness. Second, a larger scale empirical study, similar to that of Sinha & de Weck (Reference Sinha and de Weck2016) or proposed by Verstappen et al. (Reference Verstappen, Alblas and Etman2023), could be used to calibrate interface weights and validate whether the Learning metric aligns with actual or perceived development effort. Together, these two directions could iteratively refine key assumptions and improve the robustness and interpretability of the framework.
5.3.3. Recommendations for smartwatch concept selection in industrial practice
The analysis of the resulting concept profiles identifies several promising candidates for selection. Notably, the SensorProcessingUnit concept is particularly favorable, which is especially evident in Figure 14, reflecting its potential for integration into smartwatches, smart rings, and other devices. SensorProcessingUnit stands out due to its low Risk (with an inverted scale, where a higher score indicates lower risk) and relatively high Leap Potential, making it a strong choice. Although its Learning score is relatively low, the combination of significant Leap Potential and minimal Risk makes it an attractive option. On the other hand, the IndirectSkinSensor concept contributes most significantly to Learning, but is associated with higher Risk due to low technology maturity and high uncertainty. Importantly, the double-sided nature of the Learning parameter implies that high Learning both brings more unique intangible assets to the company and requires greater integration effort.
Ultimately, the choice between these concepts depends on the company’s strategic objectives and product portfolio. If the company seeks a major breakthrough and is willing to take on more risk, the IndirectSkinSensor concept would be the better option. However, if the focus is on steady, incremental progress with lower risk, the SensorProcessingUnit concept would be the more appropriate choice.
In summary, the PoLaRis framework proves to be a valuable tool for the concept design phase of system development, especially if numerical and qualitative opinion-based approaches are used alongside as complementary methods. Each approach offers unique perspectives, and when combined, they provide a more comprehensive understanding of the potential benefits and risks associated with each technology infusion option.
6. Conclusions
6.1. Summary of contributions
This study proposes the PoLaRis framework designed to help systems architects evaluate technology infusion product concepts. By focusing on three critical criteria – Leap Potential, Learning and Risk – the methodology ensures that technology integration maximizes product value while minimizing associated risks. The resulting concept evaluation profiles, visualized as spider diagrams, are simple yet informative. They support strategic decision making and bridge the gap between detailed engineering analysis and broader strategic goals.
To assess three major criteria, the PoLaRis framework proposes two complementary approaches: E-PoLaRis, based on expert feedback, and N-PoLaRis, which represents a significant evolution through the use of DSM-based methods and a new Technology Leap Potential (TLP) metric. The TLP explicitly measures a technology’s impact across user needs and products, directly evaluating its contribution to product value from the end user’s perspective without constraining how these needs are addressed. This flexibility extends the approach to a broader range of scenarios, including disruptive innovations, compared to methods focused solely on assessing technology impact on technical specifications.
While E-PoLaRis offers a broad view from a multidisciplinary expert panel, N-PoLaRis provides deeper analysis from a product architecture standpoint. E-PoLaRis captures contextual factors like regulatory risks, while N-PoLaRis helps system architects communicate decisions through structured, calculation based outputs, bridging a critical gap between highly quantitative methods like Pareto-frontier analysis and qualitative expert-driven approaches such as Delphi.
When both expert input and system data are available, combining the methods offers a more comprehensive evaluation; otherwise, each can be applied independently, depending on the availability of skilled experts and architectural data. The proposed approaches account for both technical and organizational aspects of decision making, similar to the perspective of other researchers, such as Tang, Otto & Seering (Reference Tang, Otto and Seering2018), who integrate technological and organizational factors in their executive decision-making framework.
6.2. Case studies summary and results
Two industrial case studies were conducted, applying the E-PoLaRis and N-PoLaRis approaches. Both case studies evaluated three smartwatch design options and spanned roughly a year.
First, 11 industrial experts assessed the three smartwatch concepts using the E-PoLaRis approach. Experts received detailed scoring instructions, and the Delphi technique was used to ensure consensus.
Second, the N-PoLaRis framework was employed by a system architect, resulting in the assessment of the same three parameters but through a different process. Five DSM models, ranging from 23 × 23 to 28 × 28, were constructed to represent the baseline and technology infusion systems, requiring about 120 hours of work. As a result, recommendations for selecting the most suitable smartwatch concepts were provided for industrial practice.
Finally, we compared the results of the E-PoLaRis and N-PoLaRis approaches and found strong alignment, indicating internal consistency between the two methods.
6.3. Feedback from the industry
Overall, the PoLaRis framework was applied in two industries: in three workshops with a major aerospace corporation and in two case studies with experts from the wearable electronics sector. Taken together, the PoLaRis framework received very positive feedback from the participating experts and industrial partners.
Several experts emphasized that the PoLaRis process itself was extremely insightful and noted that they would consider repeating such structured evaluations in their future work. They described it as “especially valuable for the analytical thinking and cross-disciplinary dialog it stimulated.” For example, a venture capital analyst who participated in the Delphi assessment later shared that their biotechnology-focused firm had adopted the core principles of PoLaRis, using the Leap–Learning–Risk logic to structure internal discussions and guide investment decisions over the following year. He noted that the Learning criterion, in particular, introduced a novel perspective to their evaluation process. Similarly, the system architect who performed the ΔDSM structural complexity and risk analysis noted that the numerical PoLaRis process gave her a much deeper understanding of how technological changes introduced by each concept affect system architecture. It became clear to her that the SensorProcessingUnit would be comparatively easy to infuse. She also saw how extensive the redesign of the housing would need to be for the IndirectSkinSensor. She concluded that she would potentially use the method in future projects to better capture such trade-offs between system-level effort and innovation benefits.
To sum up, the case studies received positive feedback from industry and confirmed the usefulness of the PoLaRis framework.
6.4. From PoLaRis insights to economic and portfolio analysis
To support final decisions on technology infusion, PoLaRis results are best complemented by well-established economic and financial analysis methods to estimate (i) development and integration costs, (ii) expected revenues and (iii) risk–return trade-offs. For instance, design-change costs can be estimated by combining structural metrics (Technology Invasiveness, ΔDSM-based change–propagation indices, etc.) with expert estimates of the additional engineering hours and hourly rates needed to implement the changes (Smaling & de Weck Reference Smaling and de Weck2007; Suh et al. Reference Suh, Furst, Mihalyov and de Weck2010). Expected revenue increases can be assessed, for example, using Net Present Value (NPV) or other cash-flow models, with PoLaRis Leap scores providing a structured proxy for user-perceived value that informs the pricing and adoption assumptions used as inputs to these models. Monte Carlo simulation or similar techniques can then be used to propagate uncertainty in both costs and revenues into distributions of possible financial outcomes (Garvey Reference Garvey2000). Finally, trade-offs between potential benefits and risks can be examined using portfolio analysis. For example, methods such as risk–return charts and Pareto frontiers, widely used in finance and engineering, provide a structured way for managers to compare and select options under uncertainty.
In summary, PoLaRis clarifies early architectural trade-offs and, when complemented by NPV-based and portfolio analyses, helps connect technical insight with business outcomes and supports more informed decisions.
6.5. Implications for wearable device design
Beyond its methodological contributions to engineering design, our research advances the development of wearable devices by enhancing understanding of their design parameters and architecture. Insights from our case study extend to devices like smart rings, AR/VR glasses, hearables and medical BCI implants. However, applying the framework to these devices would require some adjustments, particularly in the DSM decomposition and in the weighting of user needs for accurate evaluations.
6.6. Limitations and future research
While the PoLaRis framework demonstrates considerable strengths, there remain opportunities for refinement. One area for improvement lies in testing the usefulness of the TLP metric in cases where a technology simultaneously introduces both positive and negative impacts on product performance. For instance, a high-resolution display may enhance visual quality while imposing higher energy demands. Future research could include a dedicated case study to evaluate the applicability of the TLP metric in such trade-off scenarios.
Future work could extend PoLaRis to concepts involving multiple emerging technologies infused simultaneously or in varying combinations. The framework should remain applicable (for both E-PoLaRis and N-PoLaRis) as it evaluates the concept holistically and integrates each technology’s contribution to Leap, Learning and Risk. However, interactions between immature technologies may introduce additional uncertainty and should be captured through adjusted interface weights in the risk and complexity assessments, which warrants validation in future case studies.
Future iterations of the PoLaRis framework could also benefit from integrating machine learning for automated technology assessment. Bertoni et al. (Reference Bertoni, Hallstedt, Dasari and Andersson2020) have shown how such techniques can streamline the evaluation of complex design solutions by embedding early simulation results as inputs for value and sustainability models.
Finally, this study focused on the system-design perspective as the core of its analysis. Future work could extend this foundation by incorporating organizational, economic and market dynamics perspectives, supported by portfolio evaluation and risk–return analysis tools such as those discussed in Section 6.4.
To make balanced decisions using the proposed methodology, available resources, development costs and the competitive landscape should also be considered.
In conclusion, the PoLaRis framework and TLP metric provide effective tools for evaluating technology infusion concepts, offering strategic guidance for system architects. With minimal data and analysis requirements, PoLaRis is particularly well suited for early-stage concept development when data and simulation models are limited. By facilitating quick, informed decision making, this methodology accelerates time to market, helping organizations navigate an era of rapid technological advancement.
Financial support
This research received no specific grant from any funding agency, commercial or not-for-profit sectors.
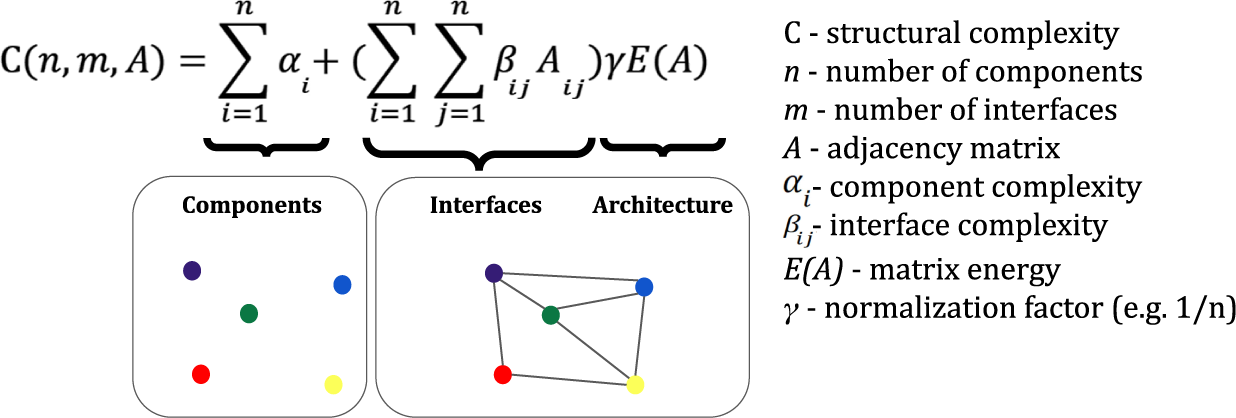

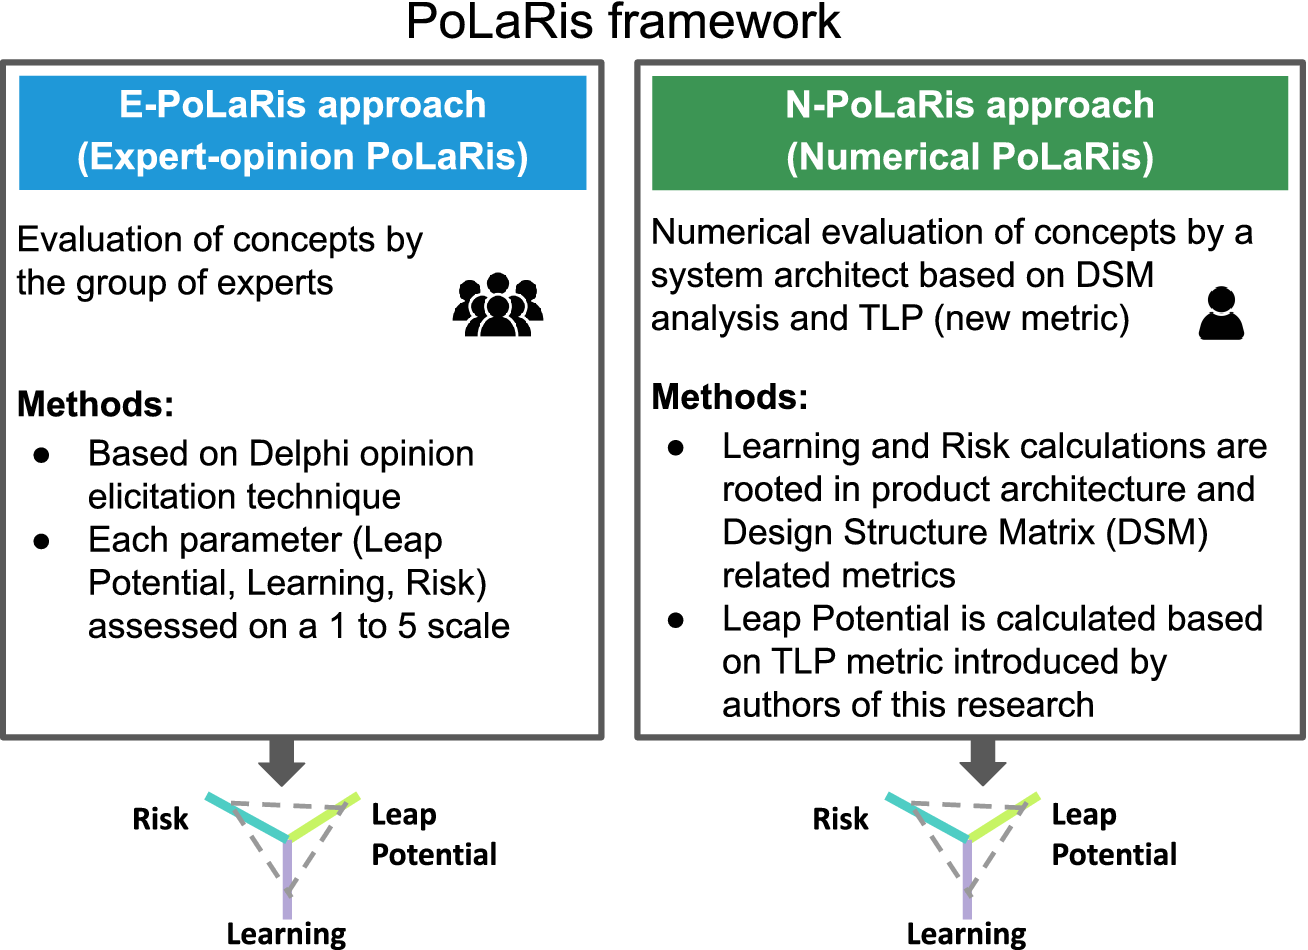

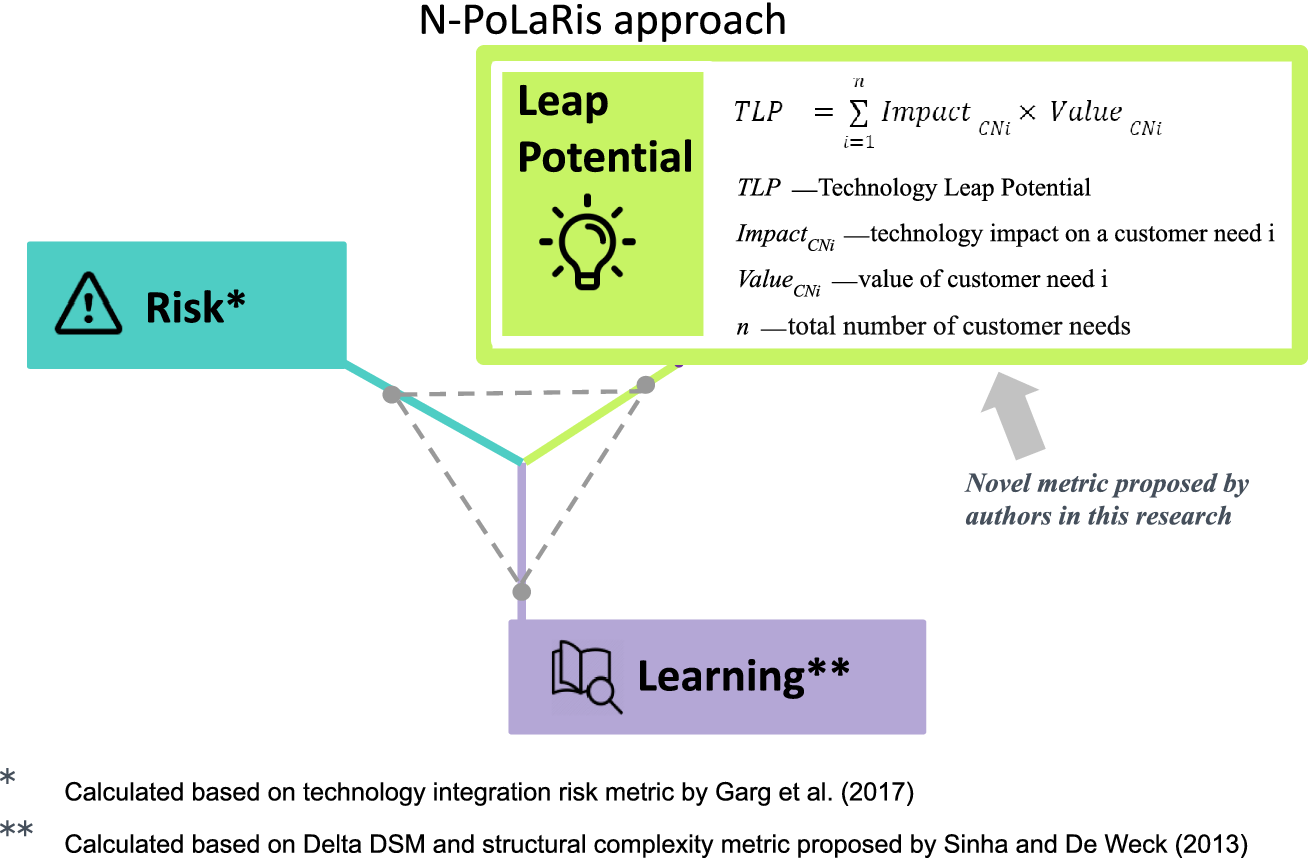
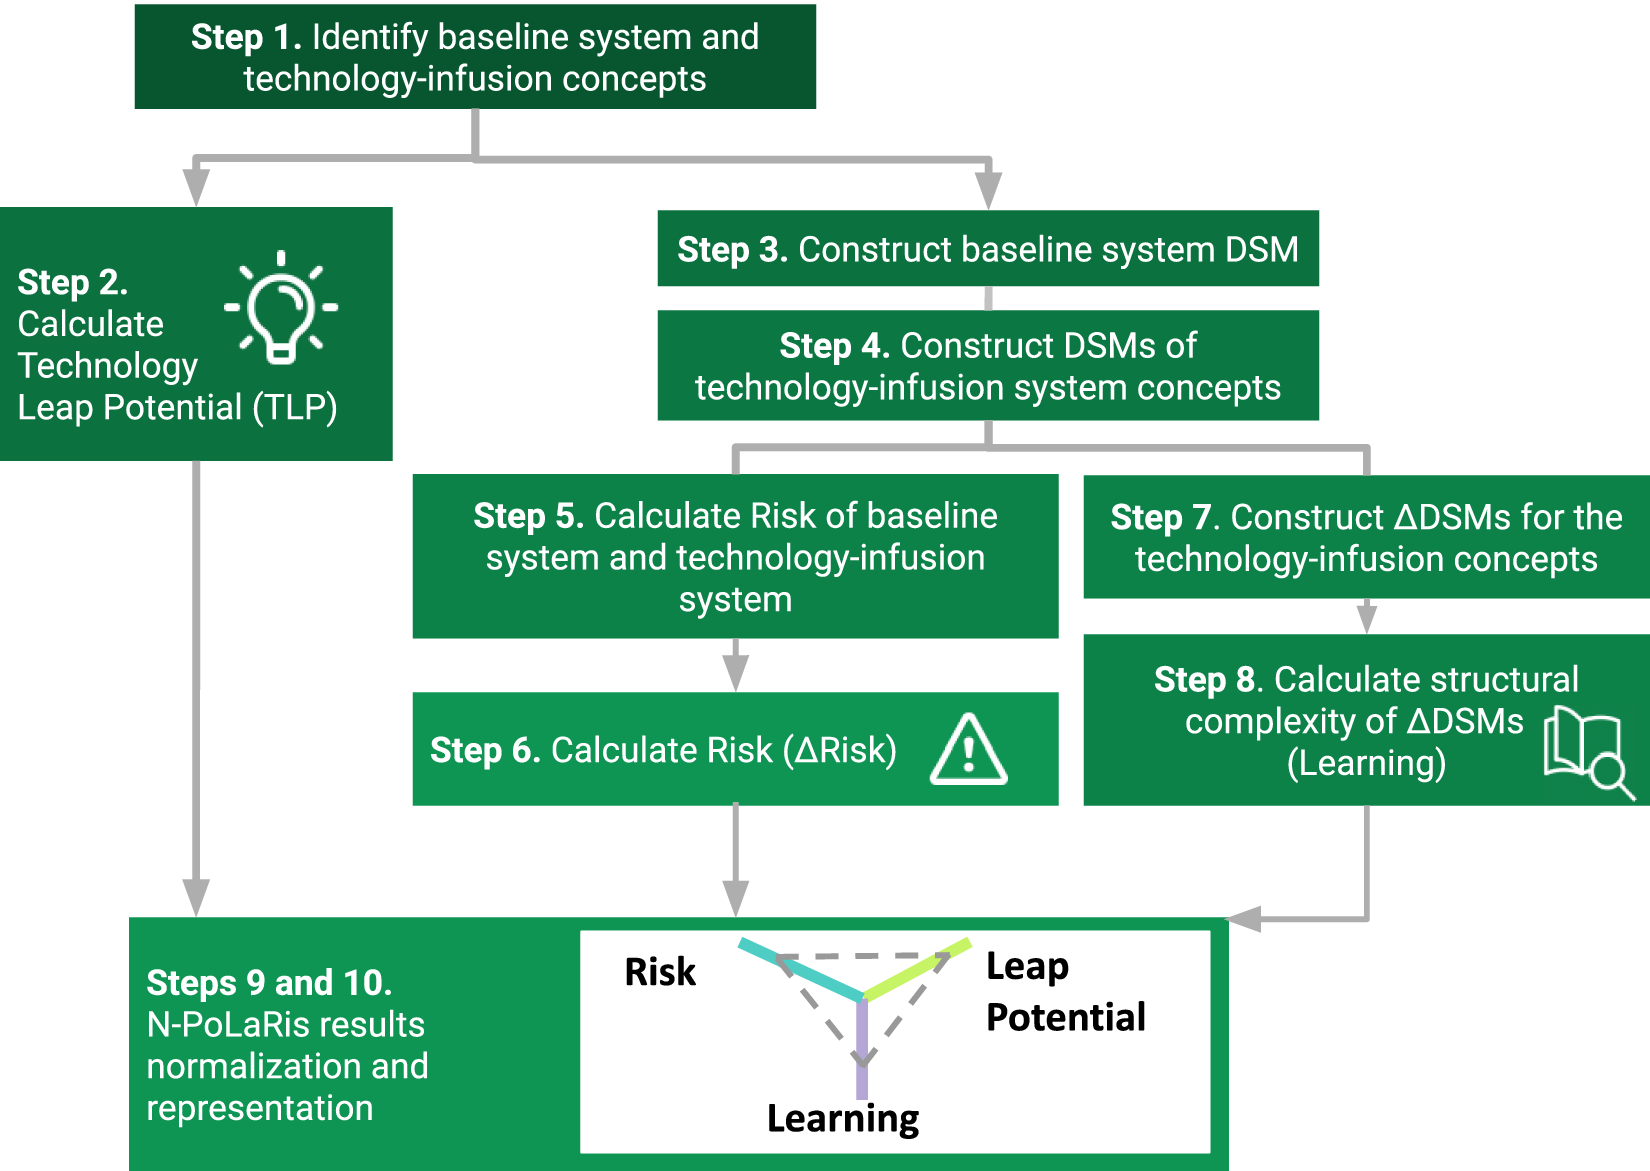
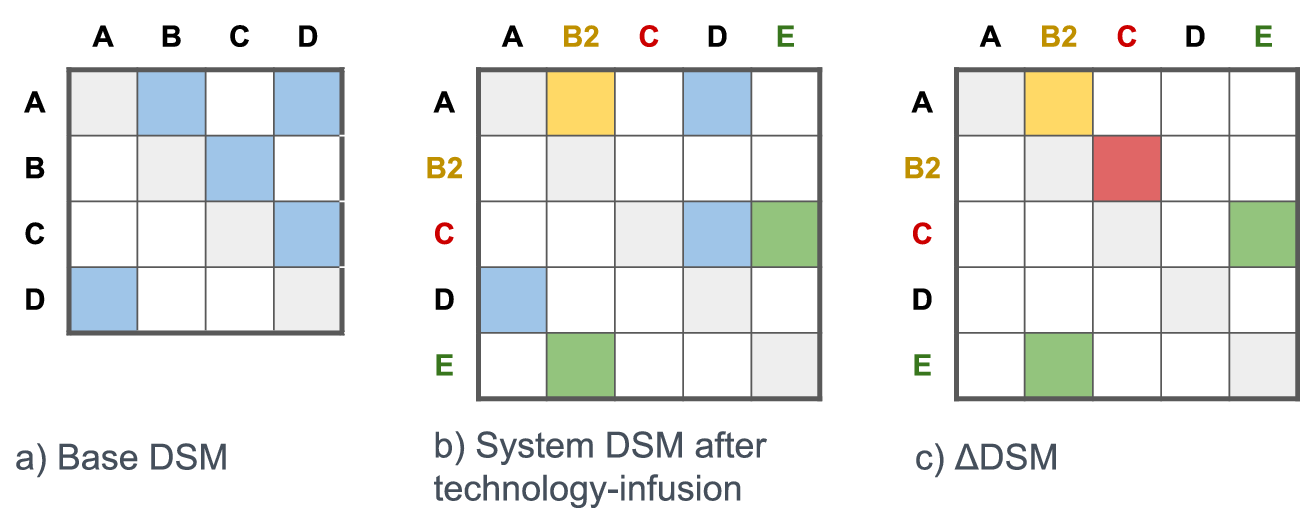
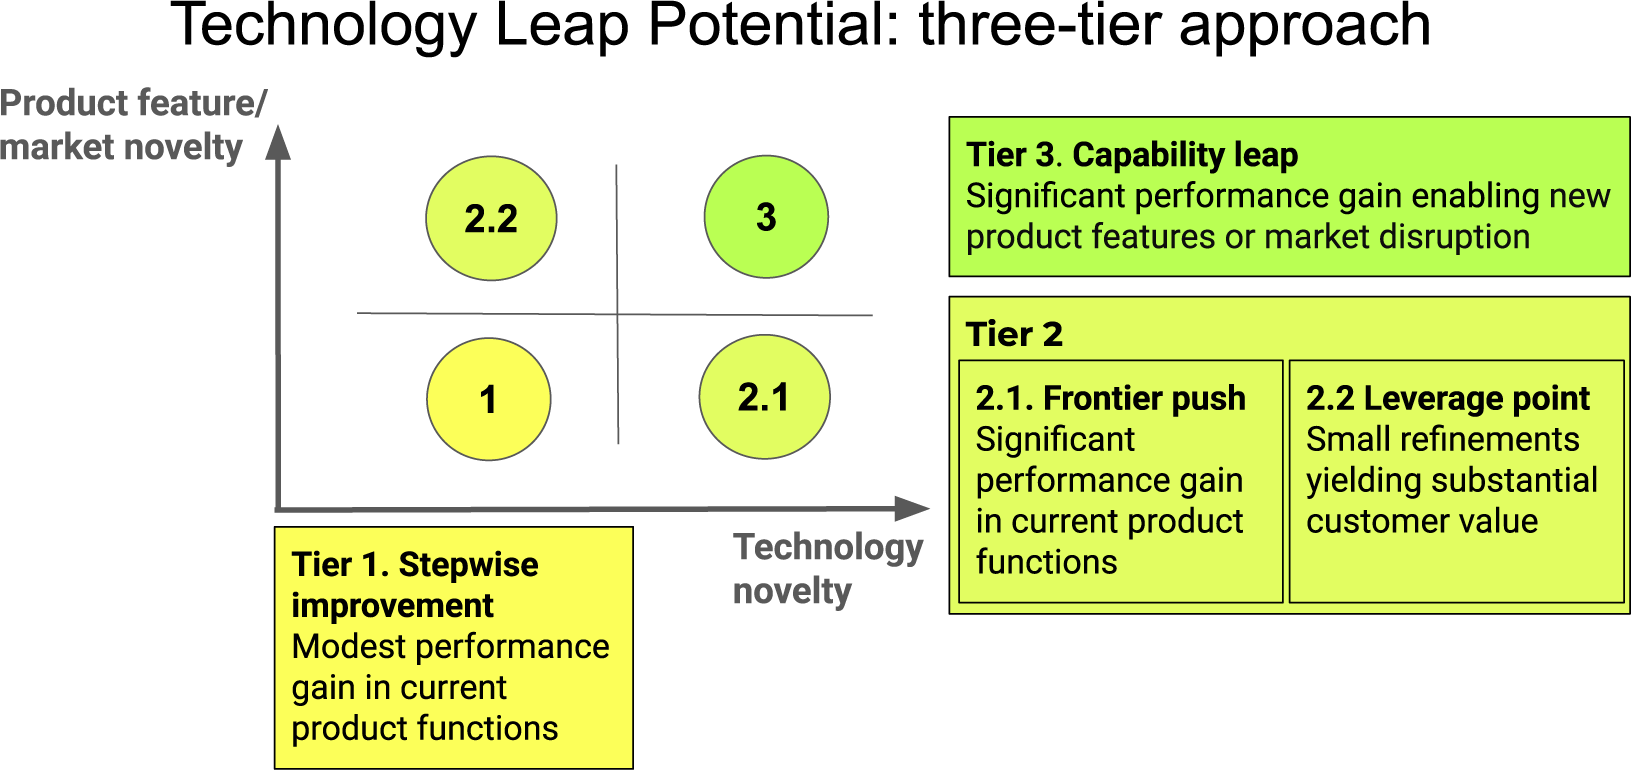


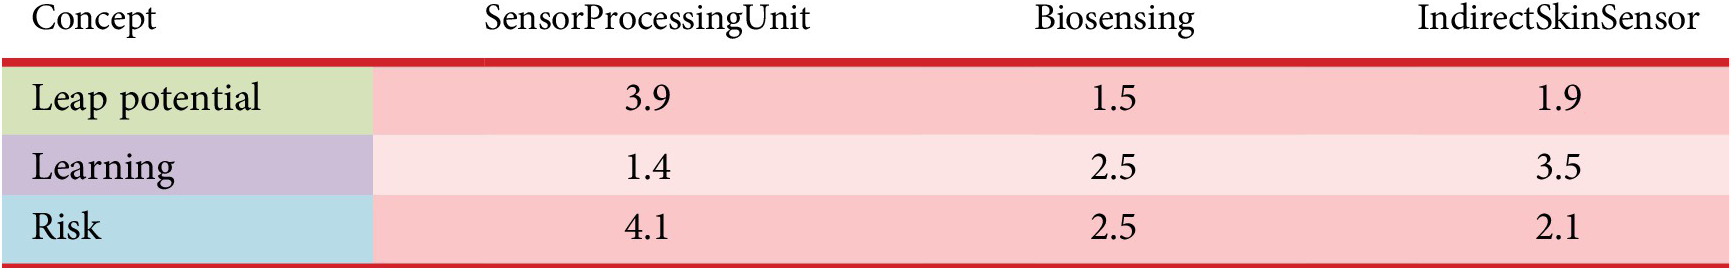


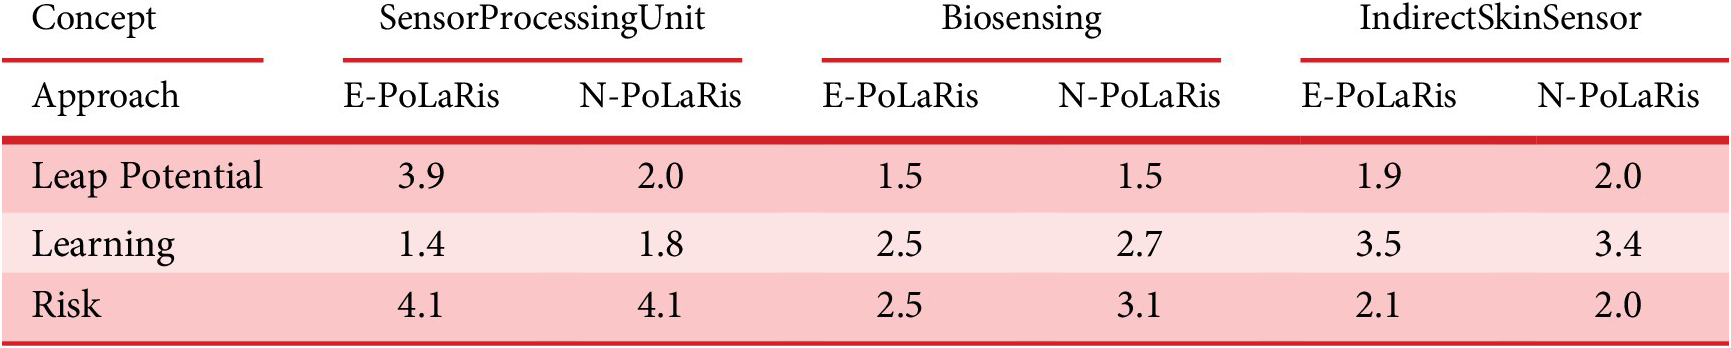
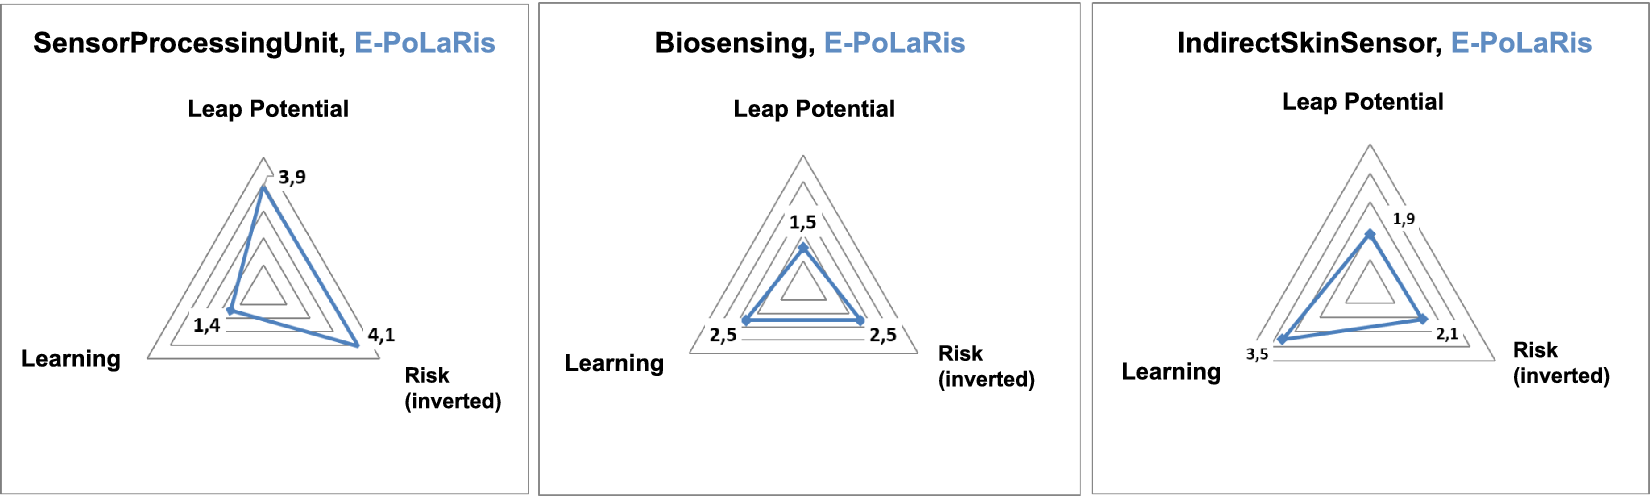
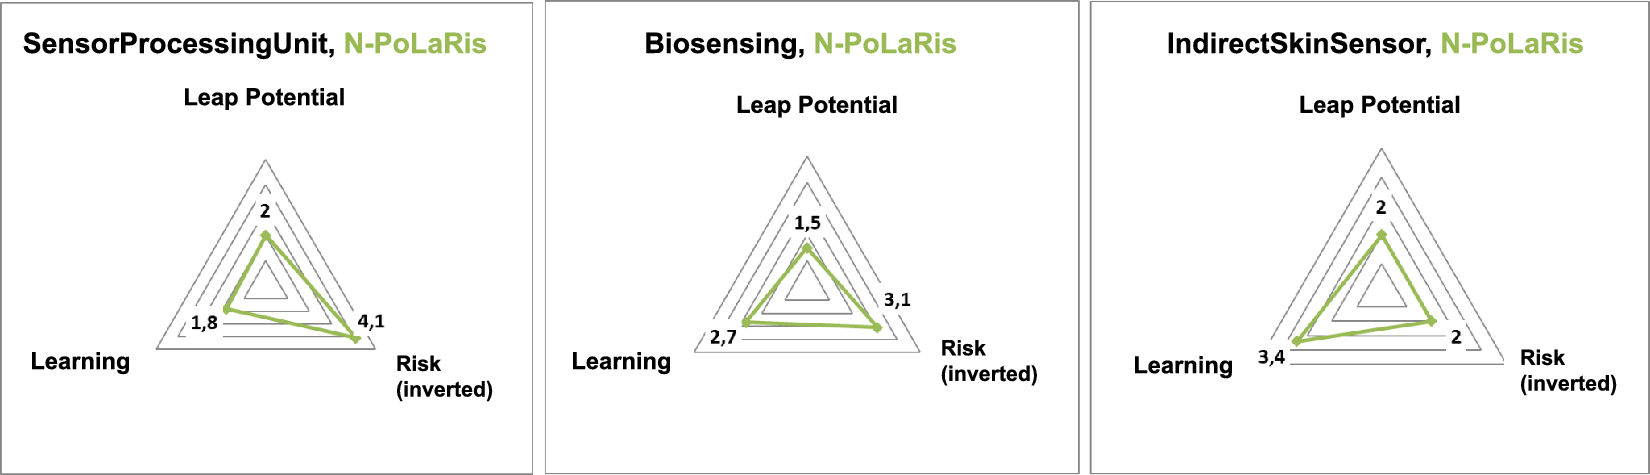

 Open access