

1. Introduction
It has been a long-held hypothesis that many flying and swimming animals can preserve energy and improve individual locomotion performance by travelling in highly organized groups (Lissaman & Shollenberger Reference Lissaman and Shollenberger1970; Weihs Reference Weihs1973; Fish Reference Fish1995; Weimerskirch et al. Reference Weimerskirch, Martin, Clerquin, Alexandre and Jiraskova2001; Liao et al. Reference Liao, Beal, Lauder and Triantafyllou2003a,Reference Liao, Beal, Lauder and Triantafylloub; Usherwood et al. Reference Usherwood, Stavrou, Lowe, Roskilly and Wilson2011; Portugal et al. Reference Portugal, Hubel, Fritz, Heese, Trobe, Voelkl, Hailes, Wilson and Usherwood2014). Most of the studies are focused on the animals moving in a single medium, either air or water. In these studies, the vortices in wakes were considered as the main reason for energy savings by group locomotion (Liao Reference Liao2007). Young waterfowl are commonly observed to swim in formation on the free water surface (as shown in figure 1a), which is the interface between the air and water. The energetic measurements by Fish (Reference Fish1994, Reference Fish1995) confirmed the ducklings could save up to 62.8 % in metabolic effort when swimming in the leader's wake. This inspires us to try to explain the formation swimming of ducklings from a new perspective – the unique wave interference phenomenon on the free water surface.
(a) A Canada goose with goslings swimming in a single-file formation, River Cherwell, Oxford, UK. Panels (b), (c) and (d) shows a sketch of a two-dimensional duckling on a free water surface: (b) stationary in calm water; (c,d) swimming in waves with the same wavelength but different phase. Green curves denote the water surface. Blue curves denote the pressure on ducklings’ immersed body surfaces and the arrows denote the direction of the force.
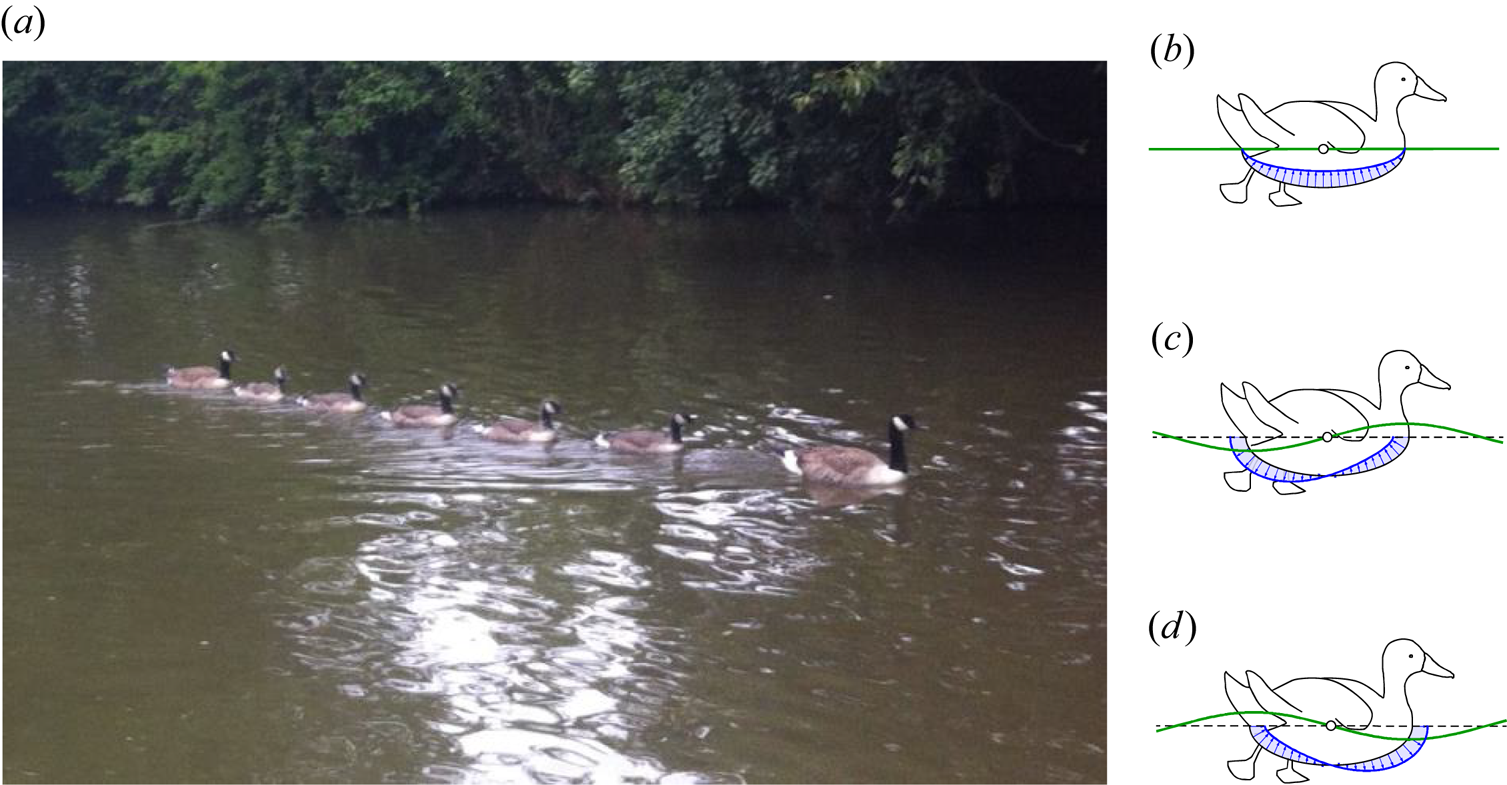
Figure 1(b–d) demonstrates a simplified two-dimensional mechanical model of a duckling on the free water surface under different conditions. In the calm water condition as shown in figure 1(b), the duckling is subject to the hydrostatic pressure force without a horizontal component. In figure 1(c), the duckling is sitting on a wave with its breast on a wave crest and its abdomen on a wave trough. As the wave height reflects the pressure distribution on the water surface, an extra resistance opposite to the movement direction is expected due to the pressure integral over the duckling's immersed body surface. In this case, the influence of wave interaction is negative, and more locomotion efforts are required compared with swimming solely in calm water. In figure 1(d), the duckling is riding the same wave 180 $^\circ$ out of phase with that shown in figure 1(c). With its breast on a wave trough and abdomen on a wave crest, the duckling will be propelled by the wave, thereby reducing its locomotion effort. It should be noted that the benefit received from the waves can only be sustained when the relative position of the duckling to the wave remains unchanged. It requires that the duckling's forward speed must be equal to the group velocity of the wave. In formation swimming, this condition of wave-riding can be easily satisfied as long as the trailing body maintains the same speed as the leading body, since the steady waves produced by the leader will not change the phase when observed from a coordinate system fixed on the leading body.
Let us define  $R_s$ as the wave drag of a duck/duckling(s) swimming solely in calm water. When they are swimming in formation, the wave drag is denoted as $R$. The drag reduction coefficient $C_{DR}$ can be defined as
 \begin{equation} C_{DR}=\left(1-\frac{R}{R_s}\right)\times 100\,\%.\end{equation}
 The drag reduction coefficient  $C_{DR}$ can be used to quantify the intensity of hydrodynamic interaction. $C_{DR} > 0$ indicates the wave drag is reduced in formation swimming due to the hydrodynamic interaction, while $C_{DR} < 0$ represents an increase of wave drag. No interaction is found at $C_{DR} = 0$, and the wave drag is the same as that of independent swimming. When $C_{DR} > 100\,\%$, the wave drag turns into a propulsive force. Obviously, it is desired by a duck/duckling to get a $C_{DR}$ as large as possible.
2. Methods and assumptions
To quantify the drag reduction in formation swimming, we make the following assumptions:
(i) The total drag of a surface-piercing moving body is composed of two primary components: wave drag and viscous drag. At speeds higher than $Fr=0.25$ ($Fr$ is the Froude number, which can be expressed as $Fr\equiv U/\sqrt {gL}$, where $U$ is moving speed, $g$ the gravitational acceleration and $L$ the body length), the wave drag becomes dominant (Schultz Reference Schultz2007). For a competition human swimmer, the wave drag could contribute up to 60 % of total drag when swimming at the surface (Vennell, Pease & Wilson Reference Vennell, Pease and Wilson2006). For ducklings, the Froude number is usually higher than 0.25 considering its small body length. Their hydrophobic feathers could further reduce the viscous drag. Therefore, we assume the wave drag is the major contribution to ducklings’ total drag.
(ii) The difference in viscous drag between a duckling swimming in formation and the same duckling swimming independently at the same speed is assumed to be small. The viscous drag is mainly determined by three factors: the swimming speed, the shape and the area of the immersed body surface. For the same ducklings swimming at the same speed, these three factors can be regarded as the same whether swimming independently or in formation. Therefore, the difference in total drag is mainly caused by the wave drag component. It is assumed that the wave drag reduction can be used to assess the intensity of the hydrodynamic interaction. No attempt is made here to analyse the drag component introduced by the viscosity of the fluid. This assumption coincides with the theory adopted by naval architects in catamaran design (Söding Reference Söding1997; Tuck & Lazauskas Reference Tuck and Lazauskas1998).
(iii) The waterfowl is assumed to be a rigid and smooth body. The hydrophobic feathers and the local movement of the paddling feet will affect the total drag. It is assumed this effect is consistent in the independent and formation swimming. Therefore, the geometry of the ducks is modelled by simple ellipsoids.
(iv) The waterfowl is moving on the water surface at a constant speed. The heading angle of the movement is zero. Neither sinkage nor trim will be considered in our calculations, since their influence on resistance is very small at low Froude numbers.
(v) It is assumed the waterfowl can instinctively find and stay in a position of minimum drag without considering the other group members’ locomotion performance.


Based on these assumptions, we can describe the fluid domain by using a velocity potential that satisfies the Laplace equation. The three-dimensional boundary element method used in Yuan et al. (Reference Yuan, Kellet, Incecik, Turan and Boulougouris2015) can then be applied to solve the Laplace equation and calculate the wave drag.
3. Results and discussion
3.1. A mother duck followed by a duckling ($M+1D$)

Let's firstly investigate the case that only one duckling follows the mother duck. Figure 2(a) shows the waves generated by a mother duck moving at 0.48 m s $^{-1}$. The wave pattern has two main features: diverging waves on each side of the fore and aft parts, and transverse waves with curved crests intersecting the centreline behind the duck. This wave pattern remains the same and moves with the mother duck's body. The energy of this wave system is maintained by doing work to overcome the wave drag. Figure 2(a) also shows that most of the wave energy is concentrated within the wedge region behind the mother duck's aft wave system.
(a) Wave pattern by a mother duck swimming at speed  $U = 0.48$ m s $^{-1}$ (or $Fr =0.244$). Ellipse $M$ on the plots represents the mother duck ( $L = 0.4$ m in length, $W = 0.15$ m in width and $H = 0.05$ m in depth). The colour map represents the wave height $\zeta$ non-dimensionalized by its body length. Here $X$ and $Y$ are the coordinates relative to the mother with its origin at the centre of the mother duck. The shadows represent half of the regions where the mother duck's wave energy is concentrated. Line PQ is the centre line behind the mother duck. (b) Distribution of drag reduction coefficient of the duckling ( $l = 0.1$ m in length, $w = 0.05$ m in width and $h = 0.017$ m in depth) when it swims around the mother duck with the same speed in the region between the two black dashed boxes in panel (a). The shadows represent half of the regions where the major hydrodynamic interaction occurs.

Now, put a duckling into the region between the inner and outer boxes shown in figure 2(a) and allow it to swim at the same speed with the mother duck. We calculate the wave drag at 1290 positions (half-domain) in this region and obtain a drag reduction contour, as shown in figure 2(b). It can be observed that there is a high coherence between the mother duck's wave pattern and the duckling's  $C_{DR}$ contour. There are three main $C_{DR}$ intensive regions in figure 2(b), corresponding to three wave energy concentrated regions in figure 2(a). The most intense hydrodynamic interaction occurs in the aft wedge region where the wave energy is concentrated. The maximum and minimum $C_{DR}$ (positions A and B) appear at the centre line behind the mother duck. Assuming the duckling has developed an instinctive sense to the resistance, it will remain in position A to achieve a minimum drag. In addition, there is no lateral force and yaw moment acting on the duckling when it swims behind the mother duck, since the flow encountered by the duckling is symmetric about the centre line. Therefore, it will be effortless for the duckling to achieve a steady wave-riding status, preserving its energy consumption, as long as it maintains the same speed as the mother duck.
An alternative selection for the duckling would be swimming in front of the mother duck (on her bow wave). As can be seen from figure 2(a), there is a wave crest in this region, which vanishes rapidly upstream. As a result, when the duckling is swimming in this region, it will continuously ride the wave and the drag reduction in this region is always positive (as shown in figure 2b). This indicates the mother duck could push the duckling to swim ahead of her. There is also no lateral force and yaw moment acting on the duckling when it swims at the centre line ahead of the mother duck. However, the side effects are obvious. Regardless of the social behaviour (e.g. protection against predators), the wave energy to be potentially utilized is relatively small. The duckling will only benefit from a small ‘pushing’ force when it gets very close to its mother's breast. The benefit vanishes rapidly as the duckling moves further upstream. Therefore, if there is more than one duckling in a formation, the other group members would hardly receive any benefits to assist their locomotion.
The hydrodynamic interactions are also observed when the duckling swims at either side of mother duck's fore divergent waves. However, these regions are less attractive to the duckling as the interaction force is small. Besides, the waves created by the mother duck will violate the bilateral symmetry of the duckling's flow field, hence creating a lateral force as well as a yaw moment. The duckling has to spend more effort to maintain its course and heading angle, in order to follow its mother.
It can be concluded from figure 2 that a duckling is most likely to swim on the centre line behind its mother. Now, put the duckling on the centre line and gradually change its positions from P to Q (as shown in figure 2a). The wave drag reduction of both the duckling and mother duck, and the wave patterns, are shown in figure 3. There are three main findings from the results in figure 3.
(i) The trailing duckling has equal probability to experience an increased drag (
$C_{DR} <0$) and reduced drag ($C_{DR} >0$) by following its mother's wake, depending on its relative position to the mother duck, as shown by the solid blue curve in figure 3(a). The duckling's $C_{DR}$ curve exhibits a periodical property, fluctuating around a neutral value. The oscillation amplitude decays as the duckling swims further downstream. The decay rate matches very well with that of the waves propagating to the far field downstream. The distance (d) between two consecutive crests on the $C_{DR}$ curve is exactly the same as a wavelength ($\lambda$). Since the wavelength on the centre line behind a moving body is speed dependent ($\lambda =2{\rm \pi} U^2/g$), the duckling could always adjust itself to a series of positions with less swimming effort, as long as it maintains the same speed with its mother. We placed the virtual duckling to the positions corresponding to each crest of the $C_{DR}$ curve. It can be observed that these are all wave-riding positions (with the duckling's breast on a wave trough and abdomen on a wave crest), which is consistent with the prediction from the simplified two-dimensional model shown in figure 1(d). The maximum wave drag reduction of 158 % is found at the first crest of the $C_{DR}$ curve, indicating the duckling's total wave drag at position A is positive (100 % is used to overcome its own wave drag, while the rest 58 % turns to be a thrust force, driving the duckling forward). A positive drag (drag pointing in the moving direction) has also been observed in tank tests (Vantorre, Verzhbitskaya & Laforce Reference Vantorre, Verzhbitskaya and Laforce2002) of multiple ships. It is also confirmed by experimental data in triathlon swimming (Bassett et al. Reference Bassett, Flohr, Duey, Howley and Pein1991; Janssen, Wilson & Toussaint Reference Janssen, Wilson and Toussaint2009) that the closer the drafter to the leader, the higher the benefit. The amplitude of the curve is subject to a decrease as the duck-to-duckling distance increases. At the 5th crest, where the duckling is $2.4L$ away from its mother (the flow accelerated by the mother duck's paddling stroke is likely to be dispersed), the duckling could still receive up to 87 % of wave drag reduction. The other side of the coin is that some regions exist where the drag increases. In particular, a $-$187 % drag reduction is observed at position B where the duckling is following its mother at very close proximity. This is similar to the wave-sitting position extrapolated by the simplified two-dimensional model shown in figure 1(c). This drag-increased phenomenon was observed by experimental measurement of the passive drag on human swimmers (Janssen et al. Reference Janssen, Wilson and Toussaint2009). However, it has not been observed by Fish's experiments on ducklings (Fish Reference Fish1994). One possible reason is that the ducklings determined their positions by instinct, ensuring they only swam in the drag-reduced region.(ii) It is not a surprise that the trailing duckling is subject to a strong hydrodynamic interaction when swimming in the leading duck's wake. However, would the mother duck receive a drag reduction due to the presence of the trailing duckling, leading to mutual benefit in formation swimming? The experimental studies on road cycling (Blocken et al. Reference Blocken, Defraeye, Koninckx, Carmeliet and Hespel2013) confirm this mutual benefit in drafting, while it has never been reported on waterfowl. Our calculations provide the evidence to support this hypothesis that the trailing duckling swimming close behind a leading duck will also assist the leader. It can be seen from the blue dashed curve in figure 3(a) that the wave drag of the mother duck can be reduced by 35 % when the duckling is swimming directly behind her. The pressure distributed over the rear part of the mother duck is increased due to the duckling's frontal waves. As a result, the mother duck receives benefit by riding the duckling's bow wave. However, at this position, the duckling is the loser. Its wave drag reduction becomes
$-$116 %, which indicates the duckling has to spend more than twice its efforts to overcome the wave drag, compared with that when solo swimming. A win-win situation is observed when the duckling is swimming at position A, where the mother duck saves 5 % and the duckling saves 158 % of its wave drag. As the separation increases, this benefit of the leader's drag reduction diminishes rapidly. There is nearly no interactive effect on the mother duck as the separation becomes larger than a duckling's body length.(iii) The duckling saves energy when it swims at position A, while it consumes more energy at position B. Why? The wave patterns in figures 3(b) and 3(c) help to reveal these reasons. When the duckling is riding the waves at position A, a destructive wave interference phenomenon is observed, as shown in figure 3(b). The wave cancellation mainly occurs in the mother duck's aft wedge region, which is consistent with the wave drag reduction shown in figure 2(b). The phase of the waves generated by the trailing duckling is different from that of mother duck's waves. By superposition, the downstream waves are partially cancelled. Taking the mother duck and duckling as a whole system (
$M+1D$), it requires less work done by the system to maintain the resultant wave energy. As the waves are confined downstream within a Kelvin wedge, the mother duck can only receive very limited benefit from wave cancellation. The major benefits are received by the trailing duckling to reduce its locomotor effort. Comparing the wave patterns in figures 3(b) and 2(a), we can also find that the waves generated by $M+1D$ is even less intense than those generated by a single mother duck. It explains why the wave drag acting on the duckling changes to thrust ($C_{DR}>100\,\%$) when it swims at position A. In contrast, when the duckling is swimming on the waves at position B, a constructive wave interference is observed. The extra energy carried by the amplified waves is mainly extracted from the duckling's energy expenditure due to the downstream propagation nature of the Kelvin waves. It coincides with the fact that drag increases at position B, as shown in figure 3(a).


(a) Evolution of the wave drag reduction with distance between ducklings and adult. Points A and B on the blue solid curve correspond to the same points in figure 2(b), representing the maximum and minimum wave drag reduction positions. Here  $d$ is the distance between two consecutive peaks on the $C_{DR}$ curve. The red solid curve is the wave profile on the centre line behind the mother duck, and $\lambda$ is the wavelength. (b) Wave pattern when the duckling is swimming at position A. (c) Wave pattern when the duckling is swimming at position B. Ellipse $D$ in panels (b) and (c) represents the duckling.

3.2. A mother duck followed by a group of ducklings ($M+nD$)

The results in figures 2 and 3 demonstrate why a duckling will follow a mother duck and where the duckling is most likely to stay. A series of energy-saving positions with a unified interval, equal to a wavelength, behind the mother duck have been identified, as shown in figure 3(a). These optimum positions are fully selectable for the first duckling ( $D1$). Assuming $D1$ stays at a position with maximum wave drag reduction (position A), let us put the second duckling ( $D2$) to follow $M+1D$. Obviously, the wave energy generated by the mother duck has been partly extracted by $D1$. The aft wedge region in figure 3(b) may not provide enough energy for $D2$ to achieve the same amount of drag reduction as $D1$. This leads to other interesting questions, if there is more than one duckling following a mother duck: (1) do they position themselves at each $C_{DR}$ crest, so that a single-file line shown in figure 3(a) will be formed? (2) how much wave drag can be saved by each individual in a formation? To answer these questions on $M+nD$, we performed large computations by repeating the above-mentioned process of $M + D1$, so that we can find the best position for each individual in sequence from $D1$ to $Dn$, and eventually an optimum formation can be obtained.
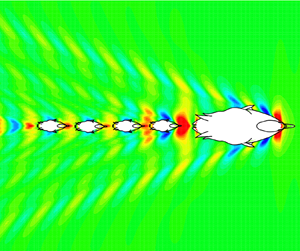
Figure 4 shows the optimum swimming formation of the  $M+nD$ system ( $n$ varies from 1 to 6), which coincides with the formation observed in nature (as shown in figure 1a). The separation between adjacent ducklings is nearly uniform. However, this optimum formation is different from the prediction of $M+1D$ in figure 3(a). The most exciting finding from the results in figure 4 is a wave-passing phenomenon. The leading duck generates the waves in the wake, leaving energy potentially available for the tailing ducklings to extract. As $D1$ is swimming directly behind the mother duck, its wave drag reduction is most pronounced ( $C_{DR}=158\,\%$). The remaining wave energy behind the $M+D1$ system is still sufficient for $D2$ to gain a propulsive force ( $C_{DR}=132\,\%$, in which 100 % is used to overcome its wave drag, and the remaining 32 % turns to a propulsive force). The wave energy to be utilized by $D3$ is further reduced. Eventually, a steady status of wave drag reduction is achieved by the ducklings behind $D3$. The wave drag reduction is sustained at approximately 100 %, indicating all the ducklings behind $D3$ receive the same amount of assistance to balance their wave drag. As the wave drag on $Dn$ ( $n>3$) is zero, these ducklings obtain a free ride and are not doing any work to generate additional wave energy. The role of these ducklings is to sustain the waves and pass them to the trailing ones. We call this delicate equilibrium state as wave-passing. This wave-passing phenomenon can also be observed in the wave patterns shown in figure 4(a), as well as the wave profile shown in figure 4(b). The waves behind $D3$ are passed by $D4$, and then the same waves are maintained behind $D4$. Repeating this process, the wave energy initiated from the mother duck will eventually reaches the $n$th duckling, regardless of the separation. Taking $M+nD$ as a whole system, the minimum total wave drag is achieved by $M+3D$. As the number of trailing ducklings increases, the total wave drag will be sustained at this minimum level. It should be noted that wave-passing is a delicate dynamic equilibrium established under a moving coordinate system fixed on the body. It is achievable only if individuals maintain the same speed as the mother duck and stay at the right positions on the centre line behind the mother duck in sequence. Any individuals that do not comply with the order will violate the sophisticated equilibrium.
Optimum swimming formation by a mother duck ( $M$) followed by duckling(s) in a clutch of $n$ (
$n$ ( $nD$). (a) Wave pattern by $M+6D$ in an optimum formation. Here $Dn$ represents the $n$th duckling in the formation. (b) Wave drag reduction of each individual (blue dash line and columns). The red solid curve is the wave profile on the centre line behind the mother duck. Here $d_{n,n+1}$ is the separation between two adjacent individuals, where the subscript $n=0$ represents the mother duck. The virtual ducklings are put in the positions of minimum wave drag. The error bar in panel (b) gives an indication of the errors induced by numerical discretization. Panels (c) and (d) show a decomposition of the wave patterns and wave profiles. (c) The background contour represents the wave pattern. Upper half: waves generated by a single duckling swimming independently at $D6$. Lower half: waves generated by $M+5D$. The curves are the wave profiles at the centre line behind ducklings. Red solid curve: wave profile behind the 5th duckling in an optimum $M+5D$ formation. Blue solid curve: wave profile behind a single duckling swimming independently at $D6$. Black dash curve: superposition of the red and blue solid curves. Solid black curve: wave profile behind the 6th duckling in an optimum $M+6D$ formation. (d) Lower half of the contour and the red solid curve are the same as those defined in panel (a). Upper half of the contour is the wave pattern of $M+6D$ shifted upstream by $d_{56}/L$. Shifting the black solid curve in panel (c) upstream by $d_{56}/L$, we can obtain the black curve in panel (d).

Wave-passing explains why the single-file formation is most commonly observed in waterfowl, as well as in human open water swimming competitions. Let us delve deeper to explore the most basic principles of wave-passing. Here, we select  $D6$ as a typical wave passer, which encounters the waves from $D5$ and then passes the same waves downstream. It is useful to decompose the wave patterns and wave profiles. Firstly, assuming $D6$ does not exist and it is an optimum $M+5D$ formation, we can obtain a wave pattern (as shown in the lower-half contour of figure 4c), as well as a wave profile behind $D5$ (as shown by the red solid curve in figure 4c). Now, let a single duckling swim independently at the position of $D6$. Its wave pattern and profile are shown in the upper-half contour and blue solid curve in figure 4(c), respectively. According to the discussions on the $M+1D$ formation, a wave cancellation occurs, and the waves generated by $M+5D$ and $D6$ are partially cancelled, leading to a drag reduction. However, the results in figure 4(c) indicate these two wave systems are not out of phase. The phase angle between them is so delicate that a resultant wave profile of nearly the same amplitude as $M+5D$ can be obtained behind $D6$. Let us shift the waves profile of $M+5D$ upstream by a phase of $d_{56}/L$, which is the non-dimensional separation between $D5$ and $D6$. We can see a very good agreement between the wave profiles behind $M+5D$ and $M+6D$, as shown in figure 4(d). It indicates the waves are successfully sustained and passed over by $D6$.
$D6$.
Based on the above results and discussions, we can spell out the principles of wave-passing. The waves by  $M+5D$ propagate to the far field in the form of divergent and transverse wave systems, reducing in wave height. The wave energy from $M+5D$ is mainly concentrated in the aft wedge region. Part of these waves are encountered by $D6$ swimming at an optimum position with its own wave pattern. Wave interference occurs, which does not only modify the wave height in the downstream, but also modifies the wave energy distribution. The waves behind $D6$ are enhanced and less wave energy is dissipated sideways. Therefore, the presence of $D6$ at the optimum position offers a free top-up to the wave energy downstream and does not contribute to an increase in the net energy. It acts as a wave energy compiler, converging the defuse wave energy into its aft wedge region, making more energy potentially available for the trailing individuals. From an energy point of view, when the dynamic equilibrium is achieved, the total wave drag of $M+nD$ remains a constant value. The wave power generated by the $n$th duckling is maintained by this constant total wave drag.
4. Conclusions
Our study reveals that ducklings apply a wave-riding and wave-passing principle to reduce the wave drag, improving their locomotion performance. They are most likely to swim in a single-file formation, by which the individual ducklings could receive harmonious benefits. Wave-passing is accompanied by a dynamic equilibrium, under which the total wave drag of the group remains constant, regardless of the group size. These principles could be potentially applied to design modern freight carrying vessels, e.g. a water-train, to transport more cargoes without extra fuel cost.
The benefit received when moving in formation on the water surface may also influence the ducklings’ primal instinct, driving the ducklings to subconsciously follow any moving objects that they see during a period ashore, as they are more sensitive to imprinting. Although the mechanism for imprinting has not been fully understood yet, the study here sheds light on the importance of the fluid mechanics on animals’ behaviour and, potentially, evolution.
Supplementary material
Supplementary material is available at https://doi.org/10.1017/jfm.2021.820.
Acknowledgements
Results were obtained using the ARCHIE-WeSt High Performance Computer (www.archie-west.ac.uk) based at the University of Strathclyde. We thank Mr A. Prothero for language editing and proofreading this work and Dr Y. Lu for her help on the research.
Funding
This research received no specific grant from any funding agency, commercial or not-for-profit sectors.
Declaration of interest
The authors report no conflict of interest.


 Open access