


1. Introduction
Droplet impact onto liquid pools has attracted the interest of researchers since the first systematic experiments of Worthington in the late 19th century (Worthington Reference Worthington1883). In nature and industry, such pools may be shallow or even constitute a thin film. For example, droplets falling from stalactites carry calcium ions into thin water films below, which precipitate to form stalagmites (Parmentier et al. Reference Parmentier, Lejeune, Maréchal, Bourges, Genty, Terrapon, Maréchal and Gilet2019), whilst raindrop impact can affect soil erosion and surface conditions (Smith, Levy & Shainberg Reference Smith, Levy and Shainberg1990). Industrial contexts include spray cooling, inkjet printing involving ‘primer’ films, and the fabrication of electronics (Lohse Reference Lohse2022).
Impacts are usually characterised by Weber  ${We} = \rho u^2l/\sigma$ and Reynolds ${Re} = \rho ul/\mu$ numbers, with the Ohnesorge number ${Oh} = \sqrt {{We}}/{Re}$ combining fluid properties. Here $\rho$, $\mu$, $\sigma$, $u$ and $l$ are the droplet density, dynamic viscosity, surface tension, impact velocity and a characteristic length scale (typically the droplet diameter), respectively. Pool depth $h$ is non-dimensionalised by the droplet diameter, denoted $h^\ast$. Various notions exist for defining when a film is thin and a pool is shallow: see Liang & Mudawar (Reference Liang and Mudawar2016) for a review. Depending on $h^\ast$, We and other parameters including gas properties and sub-continuum factors, various forms of splashing and breakup may be observed on impact (Vander Wal, Berger & Mozes Reference Vander Wal, Berger and Mozes2006).
Despite the extensive body of literature built up over more than a century, the dynamics of droplets at the earliest times following impact have only recently begun to be revealed. Above a threshold  ${We}$ (as a function of ${Re}$ – indigo line in figure 1a), a thin fast ejecta sheet is known to emerge almost horizontally from the impact site at $t\approx 30\,\mathrm {\mu }$s, where $t=0$ on impact (Weiss & Yarin Reference Weiss and Yarin1999; Thoroddsen Reference Thoroddsen2002). Adopting the nomenclature of Agbaglah et al. (Reference Agbaglah, Thoraval, Thoroddsen, Zhang, Fezzaa and Deegan2015), for deep pools and low ${Re}$ the ejecta sheet persists as the only jet and develops into a lamella, but remains separate and is accompanied by a roll jet for higher ${Re}$ (olive line in figure 1a).
(a)  ${We}$ versus ${Re}$ for all shallow pool experiments (red markers) and simulations (black markers) reported, alongside the 1 cSt silicone oil data of Zhang et al. (Reference Zhang, Toole, Fezzaa and Deegan2012) for deep pools (green markers). Lines delineate known deep pool boundaries: indigo for ejecta sheet formation; olive for impact outcome (both Zhang et al. Reference Zhang, Toole, Fezzaa and Deegan2012); purple for vortex shedding ( ${Re}=5{We}$, Agbaglah et al. Reference Agbaglah, Thoraval, Thoroddsen, Zhang, Fezzaa and Deegan2015). (b) Experimental set-up.

Existing studies of such dynamics have generally considered deep pools (Marcotte et al. Reference Marcotte, Michon, Séon and Josserand2019), or shallow pools of only one or a few depths (e.g. Deegan, Brunet & Eggers Reference Deegan, Brunet and Eggers2007; Josserand, Ray & Zaleski Reference Josserand, Ray and Zaleski2016; Bagheri et al. Reference Bagheri, Stumpf, Roisman, Tropea, Hussong, Wörner and Marschall2022). Several authors have varied pool depth more continuously for research focusing on mixing (Ersoy & Eslamian Reference Ersoy and Eslamian2020), forces during droplet impact (Yu et al. Reference Yu, Shao, Teh and Hung2022), bubble ring entrapment at high  ${Re}$ (Thoraval et al. Reference Thoraval, Takehara, Etoh and Thoroddsen2013), cavity dynamics (van Hinsberg et al. Reference van Hinsberg, Budakli, Göhler, Berberović, Roisman, Gambaryan-Roisman, Tropea and Stephan2010) and splashing (Cossali, Coghe & Marengo Reference Cossali, Coghe and Marengo1997). For the latter, some studies discriminate between early (sometimes called prompt) and delayed splashing (Okawa et al. Reference Okawa, Kubo, Kawai and Kitabayashi2021), where the former is presumably associated with ejecta sheet breakup. Intriguingly, differences in early splashing can be perceived between $h^\ast =0.1$ and $h^\ast =0.3$ for ${Oh}<0.1$ in the images of Lu et al. (Reference Lu, Pei, Qin, Peng, Wang and Zhu2020). These observations, together with the ubiquity of structures reminiscent of Edgerton's milk drop coronet (lamellae) following impact onto thin films (e.g. Wu, Wang & Zhao Reference Wu, Wang and Zhao2020), indicate that there is a well-defined depth transition on shallow pools.
In this work, we reveal that such a depth transition arises above a critical  ${We}$, meaning that the impact outcome can be controlled solely by varying pool depth. In such cases, for small $h^\ast$, the ejecta sheet develops into a lamella, whereas it remains separate and folds inward towards the axis of symmetry when the pool is deeper. Using carefully validated direct numerical simulation (DNS), we unveil the physical mechanism underpinning the depth transition, in addition to shedding new light on the well-known ${Re}$ transition (olive line in figure 1a) for deep pools.
2. Methods
2.1. Experiments
Single ethanol droplets ( $\rho = 785$ kg m $^{-3}$; $\sigma = 22.2$ mN m $^{-1}$; $\mu = 1.10$ mPa s) were generated by dripping from a 25-gauge blunt-end dispensing tip (outer diameter 0.51 mm) at $15\,\mathrm {\mu }$L min $^{-1}$ and impacted normally onto a finite-depth pool of the same fluid. The dispensing tip height, relative to the undisturbed free surface of the pool, was varied (145–490 mm) to adjust $u\in [1.6,2.7]$ m s $^{-1}$. The radius of curvature at the bottom of the droplet $r_c=(1.02\pm 0.08)$ mm was measured, with $l=2r_c$ (the effective droplet diameter, $D$) taken as the characteristic length scale (see Sykes et al. Reference Sykes, Fudge, Quetzeri-Santiago, Castrejón-Pita and Castrejón-Pita2022). We non-dimensionalise lengths, velocities and time using $D$,
$D$,  $u$ and $D/u$, respectively. Dimensionless variables are denoted by an asterisk, using $t_u^\ast$ for time. Experiments with $r_c$ or $u$ more than 2.5 standard deviations from the mean of all experiments sharing the same dispensing tip height were discarded. In our experiments, ${We} \in [180,530]$, ${Re} \in [2250,3980]$ and ${Oh}=(5.8\pm 0.2)\times 10^{-3}$.
Our ‘infinity pool’ (see figure 1b) featured a rectangular main compartment and lower front trough, separated by a weir (materials and dimensions are provided as supplementary material available at https://doi.org/10.1017/jfm.2023.622). This construction enabled an unobstructed view of the impact site (see figure S1 in the supplementary material). Fluid was continuously infused into the main compartment with an additional syringe pump to slightly overflow the weir and maintain a slowly varying free surface level. The effective pool base was a glass slide rigidly attached to a vertical translation stage via a Z bracket, enabling  $h\in [0.1,4.0]$ mm to be varied. The maximum pool depth of $h^\ast \approx 2$ was sufficiently large that the pool base did not play a significant role in the early-time dynamics of interest (Thoroddsen et al. Reference Thoroddsen, Thoraval, Takehara and Etoh2011).
For every experiment, the pool depth on impact was determined using a Micro-Epsilon confocal chromatic measuring system with  ${\pm }10\,\mathrm {\mu }$m accuracy – see the supplementary material for details. This device was also used to confirm that the pool base was flat (slope at most ${\ll }0.1^{\circ }$). Impacts were imaged with a Phantom v2512 high-speed camera (25 000–50 000 fps; 1.6–3.0 $\mathrm {\mu }$s exposure) in a shadowgraphy set-up, using a Laowa 25 mm Ultra-Macro lens with effective resolution $(123\pm 1)$ pixels mm $^{-1}$.
2.2. Direct numerical simulation
The multiple scales found in our set-up, ranging from sub-micron details in the ejecta sheet to  $D$ (millimetres), required a specialised numerical implementation also capable of accurately capturing the topological changes involved in high-We impact. The open-source software Basilisk (Popinet Reference Popinet2015) provides such a well-validated DNS infrastructure, equipped with second-order accurate discretisation methods in both space and time. The momentum equation was projected using the Bell–Collela–Glaz scheme (Bell, Colella & Glaz Reference Bell, Colella and Glaz1989), with viscous terms treated implicitly. The volume-of-fluid method was used to capture free surfaces, employing a well-balanced surface tension treatment (Popinet Reference Popinet2018). This computational framework has been proven to faithfully capture high-We impact dynamics, complementing both experimental and analytical studies (e.g. Thoraval et al. Reference Thoraval, Takehara, Etoh, Popinet, Ray, Josserand, Zaleski and Thoroddsen2012; Josserand et al. Reference Josserand, Ray and Zaleski2016; Cimpeanu & Moore Reference Cimpeanu and Moore2018; Fudge et al. Reference Fudge, Cimpeanu, Antkowiak, Castrejón-Pita and Castrejón-Pita2023).
The axisymmetric square computational domain spans  $1.5D$, the droplet being prescribed as a circle of diameter $D$ with a gap of $0.1D$ to the pool. No-slip and impermeability conditions were prescribed at the bottom of the domain, given the presence of the pool base. Free slip and outflow conditions were imposed laterally and above, respectively. The aforementioned non-dimensionalisation was adopted throughout. We included a passive tracer initialised only inside the droplet (see figure 2a), which allowed us to interrogate the ejecta sheet composition. The adaptive grid refinement strategy enforced small cells around the rapidly evolving interfaces and in regions with strong changes in velocity field component magnitudes. A smallest cell size of $0.3\,\mathrm {\mu }$m ( ${\sim }5000$ cells per diameter) was necessary to ensure mesh independence in our regimes of interest, which corresponds to a maximum refinement level of 13, equivalent to $2^{13}$ cells per dimension (see figure 2b). The resulting adaptive grid had $O(10^5)$ cells, versus an unfeasible $O(10^7)$ cells in the equivalent uniform grid. The runs required $O(10^3)$ CPU core hours and were deployed in parallel over 8–32 CPUs. The code and associated tutorials are made available on GitHub.
(a) A subset of the computational domain used for DNS illustrating the adaptive mesh. The droplet, pool and gas regions are identified by different colours. (b) Adaptive mesh refinement level visualisation, with blue indicating a coarser grid and red highlighting more refined regions. (c) A typical ejecta sheet ( ${We}=345$; $h^\ast =0.10$ at $t_u^\ast =0.045$) labelled with its characteristic points. For a free surface $\{x(s),y(s)\}$, A and C are local minima in $x(s)$; B is a local maximum. D is a local minimum in $y(s)$. I is the midpoint of segment CD (replaced with AC whenever point D does not exist, typically only at very early times).

2.3. Ejecta sheet properties
Following Coppola, Rocco & de Luca (Reference Coppola, Rocco and de Luca2011) and Thoraval (Reference Thoraval2013), we introduce key geometrical quantities for the ejecta sheet using the characteristic points depicted in figure 2(c). Defining the free surface parametrically as  $\{x(s),y(s)\}$, points A and C are local minima in $x(s)$. Point B, the tip of the ejecta sheet, is a local maximum in $x(s)$. We also introduce point D as a local minimum in $y(s)$. Similar to Coppola et al., we generally replace point A with point D. Whilst points A and D are often coincident at the early times of interest, the latter can be identified more robustly. The midpoint of segment CD (replaced by AC whenever point D does not exist, typically only for $t_u^\ast <10^{-2}$) is point I, and CD itself is the ejecta sheet base. The ejecta base thickness is therefore $\vert \overrightarrow {CD}\vert$; again, we revert to $\vert \overrightarrow {AC}\vert$ if point D does not exist.
3. Results and discussion
3.1. Impact outcomes on shallow pools
Our experiments fall on a single  ${We}$– ${Re}$ curve in figure 1(a) (as ${Oh}$ is almost constant), which approximately coincides with the 1 cSt silicone oil deep pool data set of Zhang et al. (Reference Zhang, Toole, Fezzaa and Deegan2012). According to their boundary (indigo line in figure 1a), an ejecta sheet forms in our experiments for ${We} \gtrsim 200$. Moreover, as all our experiments reside to the right of the lamella–separate ejecta sheet (olive) boundary in figure 1(a), on a deep pool the ejecta sheet would always remain separate and be subsequently accompanied by a roll jet. We observe the expected dynamics when the pool is sufficiently deep, as shown in figure 3(c) for ${We}=345\pm 7$ and $h^\ast =0.32$. The ejecta sheet remains separate and folds inward towards the initial axis of symmetry before breaking up, with the resulting satellites being ejected from within the collapsing roll jet later on. However, when the pool depth is reduced to $h^\ast =0.10$ with all other parameters maintained (figure 3a), the ejecta sheet no longer remains separate but instead develops into a lamella. These dynamics are similar to low- ${Re}$ behaviour on deep pools, which occupy the region to the left of the lamella–separate ejecta sheet (olive) boundary in figure 1(a). Figure 3 therefore confirms that there is a lamella–separate ejecta sheet transition due to pool depth.
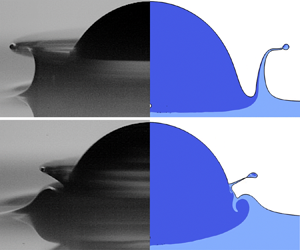
 ${We}=345\pm 7$ impact of an ethanol droplet onto a shallow pool of the same fluid, with free surface contours (orange) from our axisymmetric numerical simulations overlaid in panels (a,c). Panel (a) shows $h^\ast =0.10$, lamella. Panel (b) shows $h^\ast =0.24$, typical asymmetric dynamics close to the depth transition. Panel (c) shows $h^\ast =0.32$, separate ejecta sheet. The horizontal blue lines in the first column indicate the pool base. Additional depths $h^\ast \in [0.08,0.28]$ are provided as supplementary material (figure S3). All scale bars are 2 mm (videos online).

For  ${We}=345$, this depth transition occurs at $h^\ast \approx 0.22$, close to which we see remarkable structural asymmetry as in figure 3(b). In such cases, the ejecta sheet only remains separate in some axial directions, with a lamella formed in others (i.e. different regimes within sections around the circumference of the droplet). This asymmetry is caused by small irregularities in the free surface of the impacting droplet affecting the local $r_c$, which critically influences the ejecta sheet dynamics only very close to the depth transition. Importantly, figure 3(b) provides clear visual evidence that the ejecta sheet merges with the pool to form a single jet on shallow pools, which qualitatively matches the known behaviour for low- ${Re}$ impact (i.e. left of the olive line in figure 1a) on deep pools.
Every experiment in our  ${We}$– $h^\ast$ parameter space is classified according to whether a lamella (cf. figure 3a) or a separate ejecta sheet (cf. figure 3c) is formed in figure 4. Below ${We} \approx 280$, a lamella is formed for all depths, though it is generally much thicker than at higher ${We}$ for very shallow pools – compare figure 4(b) and figure 4(f). For ${We}>280$, the ejecta sheet remains separate only on deeper pools. All structurally asymmetric outcomes (cf. figure 3b) are identified by yellow markers in figure 4, which only appear very close to the depth (vertical) and We (horizontal) transitions that together divide the two primary outcomes. This observation supports our hypothesis that structural asymmetry is caused by small irregularities in the free surface (only critical very close to transitions) and highlights the abruptness of the depth transition identified. Note that whilst the depth transition appears almost vertical ( $h^\ast = 0.22\pm 0.03$), there is a modest migration towards deeper pools for higher ${We}$. We believe this migration is caused by increased impact-induced pressure behind the ejecta sheet affecting its dynamics shortly after formation, as elucidated in § 3.3.
Impact outcomes for all experiments reported. Inset frames are all at  $t_u^\ast =0.42$, sharing a 2 mm scale bar. Yellow markers represent structurally asymmetric experiments (cf. figure 3b). Circle markers indicate experiments that shed small satellites; those with triangle markers do not. The purple band delineates the equivalent dry surface ( $h^\ast =0$) splashing threshold (Sykes et al. Reference Sykes, Fudge, Quetzeri-Santiago, Castrejón-Pita and Castrejón-Pita2022), which spans a small vertical interval encompassing the range of ${Oh}$ found in our experiments.

The depth transition occurs when  $h^\ast$ is one order of magnitude smaller than generally considered for pool depth to have no effect on impact dynamics ( $h^\ast \approx 4$, Tropea & Marengo Reference Tropea and Marengo1999; Liang & Mudawar Reference Liang and Mudawar2016). Within each regime, there are differences in the prevalence of instabilities and break up, plus later time dynamics not presented here (e.g. Worthington jet). The markers’ shape in figure 4 establishes whether satellite droplets akin to splashing on dry surfaces are formed (circles for satellites; triangles for no satellites). Here, satellites are defined as fast-moving droplets at least one order of magnitude smaller than $D$ – specifically excluding the larger slower droplets that are sometimes pinched-off from the top of lamellae (Edgerton crowns). Circle markers are most prevalent in the upper reaches of figure 4, indicating that satellites are more prone to form at higher ${We}$ as expected, but also with a separate ejecta sheet. For example, at $t_u^\ast =0.42$, the ejecta sheet is already unstable and sheds satellite droplets for ${We}=515$ and $h^\ast =1.0$ (figure 4c), whilst no such breakup is seen at ${We}=350$ (and comparable $h^\ast$, figure 4e). Inter-regime dependence on $h^\ast$ is comparably weak. Interestingly, Deegan et al. (Reference Deegan, Brunet and Eggers2007) studied a fixed depth of $h^\ast = 0.2$ (with a superset of our ${We}$– ${Re}$ parameter space), which happens to be very close to the depth transition we have identified: this observation may help to explain some of the ‘complexities of splashing’ identified there. Within the lamella regime, few experiments produce satellites for ${We}<500$ (see figure 4, where the vast majority of red markers are triangles), whereas ${We}\approx 300$ (purple band in figure 4) is the dry flat surface splashing threshold (Sykes et al. Reference Sykes, Fudge, Quetzeri-Santiago, Castrejón-Pita and Castrejón-Pita2022). This observation offers a potential route to reducing contamination from satellite droplets due to droplet impact, by applying a sufficiently thin layer of the same fluid to the surface. For higher ${We}$ than presented in figure 4, the dynamics become more intricate as the ejecta sheet can touch the droplet or pool within 1 ms of impact.
3.2. Comparing experimental and DNS results
Free surface contours extracted from our axisymmetric DNS simulations are overlaid onto the raw experimental images in figure 3(a,c) without structural asymmetry. From these overlays, we conclude that our DNS set-up accurately captures the key features of both lamella and separate ejecta sheet outcomes. For a quantitative comparison between our experiments and simulations, figure 5 shows the ejecta sheet tip (point B) distance from the initial impact point  $O$,
$O$,  $\vert \overrightarrow {OB}\vert$. Four depths $h^\ast \in [0.08,0.32]$ (two either side of the depth transition) are shown, with ${We}=345$ fixed. The experimental errors were determined using a propagation of error analysis (parameters in the caption of figure 5). The number of points is limited both by temporal resolution and the difficulty in accurately discerning the ejecta tip when $t_u^\ast \lessapprox 0.05$ (corresponding to $t\lessapprox 45\,\mathrm {\mu }$s) given its small size, as well as it residing in a region of high curvature between the pool and droplet. Systematic differences between the experiments and simulations (e.g. the real droplet is slightly oblate, but perfectly spherical in silico) were not taken into account. Nevertheless, figure 5 demonstrates very good agreement, despite the multi-scale nature of the flow and the delicate details therein which make this one-to-one comparison a considerable challenge. Both experiments and simulations indicate that the ejecta sheet tip is pushed out further (at a given time) on shallower pools, especially between the depths bisected by the transition identified in figure 4. The dynamics of interest herein take place at very early times (the dashed vertical line in figure 5 delineates the maximum extent of all depth-variation graphs below: $t_u^\ast =0.064$). We are therefore confident in relying on our simulations to explore the physics underpinning the depth transition.
Evolution of the ejecta tip (point B, figure 2c) distance,  $\vert \overrightarrow {OB}\vert$, where $O$ is the initial impact point (indicated within, on the initial free surface profile of the simulations, $t_u^\ast =-0.10$). ${We} = 345$ impact; $h^\ast \in [0.08,0.32]$. The dashed vertical line in the graph delineates the maximum extent of all other depth-variation data shown ( $t_u^\ast =0.064$, figure 8a). Raw experimental images can be found in figure 3 and the supplementary material (figure S3). Experiment error bars are based on propagation of error analysis assuming the following absolute errors: ${\pm }25\,\%$ of the frame period (which is $27\,\mathrm {\mu }$s at 37 000 fps) for $t$;
$t$;  ${\pm }0.2$ pixels mm $^{-1}$ for the scale; ${\pm }0.02$ mm for $r_c$; ${\pm }0.01$ m s $^{-1}$ for $u$. Systematic differences, including non-sphericity of the droplets only in the experiments, are not included.

3.3. Physical mechanism underpinning the pool depth transition
Dimensionless gauge pressure  $p$ and vorticity $\omega$ fields for the axisymmetric cases from figure 3 are shown as two-dimensional slices in figure 6. A ring vortex forms within the fluid close to the ejecta sheet base in both cases, which can be best seen from the inset $\omega$ frames at $t_u^\ast =0.033$. At later times ( $t_u^\ast =0.443$ in figure 6), we only see a patch of detached vorticity within the bulk for $h^\ast =0.32$ (figure 6d–f; see also Thoraval et al. Reference Thoraval, Takehara, Etoh, Popinet, Ray, Josserand, Zaleski and Thoroddsen2012), whilst the equivalent vorticity remains connected to the free surface and diffuses away for $h^\ast =0.10$. Indeed, there is only a very weak layer of elevated vorticity, which is attached to the free surface, at $t_u^\ast =0.443$ for the shallower pool (see figure 6c). Therefore, whilst the ring vortex forms for both depths, it only sheds from the free surface on the deeper pool that has the separate ejecta sheet outcome. Agbaglah et al. (Reference Agbaglah, Thoraval, Thoroddsen, Zhang, Fezzaa and Deegan2015) made similar observations for the ${Re}$ transition on deep pools, finding that vortex shedding occurs on the visco-capillary time scale; hence an association of the ${Re}$ transition with a fixed capillary number, ${Re}=5{We}$ (purple line in figure 1a). All our experiments lie in their vortex shedding regime (and ${Re}$ does not depend on $h^\ast$), from which we can infer that the pool base must modify the dynamics such that a lamella forms only when the pool is sufficiently shallow. Hence the origins of the ${Re}$ and depth transitions are different.
Dimensionless pressure  $p$ (left) and vorticity $\omega$ (right, positive counterclockwise) field magnitudes for cases with (a–c) $h^* = 0.10$ and (d–f) $h^* = 0.32$, from figure 3 ( ${We} = 345$; ${Re} = 3184$). The vorticity data are confined to the liquid regions for clarity. The colour bar is shared between panels, with the scale for $\omega$ remaining constant, while $p$ varies from $-1$ to $p_{max} = 4$ (panels a,d), $2$ (panels b,e) and $1$ (panels c,f) (videos online). The whole pool depth is included for all panels, with the pool base indicated by a black line. Velocity slices are provided as supplementary material (figure S5).

For  ${We}=345$ and $h^\ast \in [0.05,1.00]$ (spanning the depth transition), figure 7(a) shows that there are clear differences in the temporal development of ejecta sheet length $\vert \overrightarrow {IB}\vert$ between the impact outcomes. Note that this data could not be extracted from our experiments, mainly because our view of the ejecta sheet base (close to point I) is blocked by the revolved ejecta sheet in front. A high growth rate is evident only once the pool is shallow enough, most notably for $h^\ast \leq 0.10$ (i.e. only lamella outcome depths). The convergence of temporal evolution as $h^\ast \geq 0.22$ increases coincides with the decreasing influence of the pool base, whose effect is to alter the pressure distribution within the pool, as also seen in figure 6. In terms of values, the peak impact-induced pressure is 5 % higher at $t_u^\ast =0.003$ (42.4 versus 44.7 kPa) for $h^\ast =0.10$ compared with $h^\ast =0.32$. On shallow pools, the pool base therefore has a confinement effect, maintaining the high-pressure region generated by the impact that would otherwise decay into the pool. Hence, the peak pressure difference between the $h^\ast =0.10$ and $h^\ast =0.32$ cases grows whilst $t_u^\ast \sim O( 10^{-2} )$, to 17 % at $t_u^\ast =0.033$ (15.4 versus 13.1 kPa). As such, the ejecta sheet is pushed out further and for longer on shallower pools. A similar mechanism is known to occur at higher ${We}$ and ${Re}$ where the von Kármán vortex street that arises behind the ejecta sheet can be constrained by a pool base, resulting in both an increase in the maximum liquid (droplet and pool) velocity and altered ejecta sheet dynamics on shallow pools (Thoraval et al. Reference Thoraval, Takehara, Etoh and Thoroddsen2013).
Ejecta sheet length  $\vert \overrightarrow {IB}\vert$ and tip velocity (computed as the central temporal derivative of $\vert \overrightarrow {IB}\vert$) in a frame of reference co-moving with I, for ${We} = 345$ impact; $h^\ast \in [0.05,1.00]$.

Figure 7(b) shows the velocity evolution of the ejecta sheet tip (point B) in a frame of reference co-moving with point I, computed as the central temporal derivative of  $\vert \overrightarrow {IB}\vert$. The velocities are similar for all depths initially (up to $t_u^\ast \approx 0.01$), but grow substantially only for $h^\ast \leq 0.10$ by $t_u^\ast \approx 0.02$ due to the confinement effect. Given the frame of reference, high velocities can be interpreted as rapid lengthening of the ejecta sheet, which is most pronounced for the lamella outcome. Note that the velocities are almost coincident for all $h^\ast \geq 0.22$ due to the weak influence of the pool base: at $t_u^\ast = 0.033$, the pressure at the wall is almost ambient on the axis of symmetry for $h^\ast =0.32$ (figure 6b).
Figure 8(a) shows that until  $t_u^\ast \approx 0.02$, ejecta base thicknesses $\vert \overrightarrow {CD}\vert$ grow linearly and are almost coincident for all depths considered in this work (the ejecta sheet is marginally thicker for smaller $h^\ast$, as expected from the slightly higher initial peak pressure). Thereafter, a bifurcation cleanly separates the impact outcomes: lamella ( $h^\ast \leq 0.10$) and separate ejecta sheet ( $h^\ast \geq 0.22$). In fact, for each $h^\ast \leq 0.10$, the evolution breaks away from the deep-pool linear trend exactly when the ejecta sheet is lengthening fastest, i.e. times coinciding with local maxima in figure 7(b). Taken together, the evolutions of ejecta sheet velocity (figure 7b) and base thickness (figure 8a) confirm that rapid lengthening results in ejecta sheets being stretched on shallow pools. This process can be seen visually in the free surfaces of figure 8(c). ${We} = 345$ impact. The ejecta base thickness is generally computed as $\vert \overrightarrow {CD}\vert$ (see figure 2c). In panel (a), $h^\ast$ is varied, with $\hat {\mu }=1.0$ (fluid dynamic viscosity normalised by that of ethanol) fixed. In panel (b), $\hat {\mu }$ is varied to change ${Re}$ as shown in figure 1(a) (black markers), with $h^\ast = 0.32$ fixed. Orange arrows identify the same data point in the pink data series. (c) Free surface profiles around the ejecta sheet at $t_u^\ast \in \{0.025,0.033,0.041\}$, for $h^\ast =0.10$ (green) and $h^\ast =0.32$ (red), with $\hat {\mu }=1.0$. Labels {B,C,D} indicate the characteristic points identified in figure 2(c). (d) Visualisations at $t_u^\ast =0.48$ where $h^\ast$ and $\hat {\mu }$ are varied, with the droplet (darker blue) and pool (lighter blue) fluids distinguished.

For the separate ejecta sheet outcome, strong interaction between the ejecta sheet and droplet free surface is required for a liquid bridge to build between them and separate the ejecta sheet from the pool, akin to the initial stages of coalescence. The bridge-building process can be seen in the  $h^\ast =0.32$ (red) free surface profiles of figure 8(c), where point D propagates ahead of point C by $t_u^\ast =0.041$ (see figure S4a in the supplementary material for a graphical representation). These dynamics result in the ejecta sheet ‘climbing up’ the droplet, similar to the quartering case of Thoraval et al. (Reference Thoraval, Takehara, Etoh, Popinet, Ray, Josserand, Zaleski and Thoroddsen2012). They also appear to be key in allowing the adverse pressure gradient that exists for all $h^\ast$ to detach the ring vortex in the separate ejecta sheet outcome (compare $\omega$ fields at $t_u^\ast =0.443$ in figure 6) and requires some flow from the droplet into the ejecta sheet. Such flow should not occur with smaller $h^\ast$ for which a lamella is formed, as the stretching dynamics described above restrict flow from the droplet into the ejecta sheet at the critical moment. We included a passive tracer inside the droplet in our simulations to assess this hypothesis. In figure 8(d), for $h^\ast =0.10$, very little droplet fluid (darker blue) can be seen in the lamella and there is no folding of the internal fluid interface (i.e. little mixing), which occurs when there are conflicting velocities across it. These observations support the aforementioned hypothesis. A further factor reducing flow from the droplet into the ejecta sheet on shallow pools is that the peak velocity is generally directed from the pool for all $h^\ast$ (see the supplementary material for velocity snapshots – figure S5), which is enhanced by the confinement effect on shallow pools. Ultimately, without flow from the droplet and subsequent vortex detachment to separate it, the ejecta sheet preferentially collects fluid from the pool and develops into a lamella on shallower pools. Hence we conclude that a pressure confinement effect due to the proximity of the base on shallow pools restricts flow from the droplet into the ejecta sheet and prevents vortex separation from the free surface, resulting in the formation of a lamella.
3.4. Comparison with the Re transition
We now apply our understanding of the depth transition developed in § 3.3 to explore the associated Re transition studied principally by Zhang et al. (Reference Zhang, Toole, Fezzaa and Deegan2012) and Agbaglah et al. (Reference Agbaglah, Thoraval, Thoroddsen, Zhang, Fezzaa and Deegan2015). To generate the required data, we carried out further simulations with different fluid viscosities  $\hat {\mu }\in [0.8,5.0]$, where $\hat {\mu }$ is the dynamic viscosity normalised by the value for ethanol. Hence, ${Re}\in [640,3980]$ (see figure 1a), with ${We}=345$ and $h^\ast =0.32$ fixed. Consistent with the lamella-separate ejecta sheet boundary (olive line in figure 1a) of Zhang et al., a lamella forms in our simulations only for $\hat {\mu }\geq 3.0$.
The evolution of ejecta base thickness when changing viscosity is shown in figure 8(b), with time normalised by  $\mu D/\sigma$ to facilitate comparison (this quantity is denoted $t_\mu ^\ast$). Unlike for the depth transition (figure 8a), we do not observe a clear difference (much less a bifurcation) in the thickness evolution between different impact outcomes. More surprisingly, the long-term thickness evolution is not consistent for all experiments sharing the same impact outcome. For instance, the ejecta base thickness monotonically increases for $\hat {\mu }\in \{0.8,1.0\}$ (consistent with the $h^\ast =0.32$ data in figure 8a), whilst it starts to decrease at $t_\mu ^\ast \approx 0.30$ for $\hat {\mu }\in \{1.2,1.5\}$, despite these four viscosities sharing the same impact outcome. This observation contrasts with the data in figure 8(a), where the evolutions realign for all depths with a given outcome following the bifurcation. It is also recognised that the ejecta sheet angle (between the horizontal and normal to its base) is important in determining its subsequent dynamics for different ${Re}$ (Thoraval et al. Reference Thoraval, Takehara, Etoh, Popinet, Ray, Josserand, Zaleski and Thoroddsen2012). However, for all $h^\ast$ we studied (at ${We}=345$), the angles are very similar until the bifurcation in figure 8(a) (figure S4b in the supplementary material), which suggests that the ejecta sheet angle does not play a major role in the depth transition.
Nevertheless, there is a common factor distinguishing the outcomes (lamella versus separate ejecta sheet) whether via a Re or depth transition: is a liquid bridge built between the droplet and ejecta sheet? For the depth transition, the early-time dynamics affect the ejecta base thickness, which controls whether fluid flows from the droplet into the ejecta sheet, and therefore whether the liquid bridge expands. Whilst figure 8(b) does not indicate any clear distinction between outcomes, it does confirm that ejecta sheet bases are initially thicker for more viscous impacts – in fact, the thickness decreases linearly with increasing Re (Agbaglah & Deegan Reference Agbaglah and Deegan2014). We suggest that the resulting increased volume flux from the pool associated with a higher fluid viscosity (see figure 5 of Agbaglah et al. Reference Agbaglah, Thoraval, Thoroddsen, Zhang, Fezzaa and Deegan2015) acts to thicken the ejecta sheet (see later times in figure 8b) into a lamella, thereby suppressing expansion the liquid bridge. This proposition is supported by the observation of Agbaglah et al. (Reference Agbaglah, Thoraval, Thoroddsen, Zhang, Fezzaa and Deegan2015) that all separate ejecta sheet (vortex shedding) cases on deep pools exhibit a minimum in the free surface curvature close to where the ejecta sheet and droplet join. In particular, this explanation offers a way to reconcile the similar dynamics associated with the depth and  ${Re}$ transitions consistent with their different origins.
4. Conclusions
We have revealed a well-defined transition between impact outcomes owing only to pool depth  $h^\ast$ for droplets impacting shallow pools of the same fluid. Above a critical ${We}$, the ejecta sheet formed on impact remains separate and spectacularly folds inward only on deeper pools, whereas it preferentially collects fluid from the pool to develop into a lamella when $h^\ast$ is sufficiently small. We were able to precisely delineate the $h^\ast$ and ${We}$ transitions between these outcomes due to an innovative experimental set-up that enabled $h^\ast$ to be varied from a thin film ( $h^\ast \approx 0.05$) to a deep pool ( $h^\ast \approx 2.00$), measured accurately on impact for every experiment whilst imaging unobstructed at high speeds. To reveal the physical mechanism underpinning the depth transition, we developed a high-resolution DNS framework, carefully validated against our experiments, which enabled us to interrogate the microsecond time scale ejecta sheet dynamics. We found that a pool base acts to confine the impact-induced pressure once $h^\ast$ is sufficiently small, causing the ejecta sheet to stretch and thin at its base. This process restricts flow from the droplet into the ejecta sheet, preventing vortex detachment and liquid bridge expansion, allowing it to develop into a lamella. Regarding the well-known transition that arises when decreasing ${Re}$ (Agbaglah et al. Reference Agbaglah, Thoraval, Thoroddsen, Zhang, Fezzaa and Deegan2015), we propose that it is caused by the increased initial thickness of the ejecta sheet base that similarly suppresses liquid bridge expansion despite a different origin to the depth transition. Our findings therefore offer a consistent way to explain the transition between lamella and separate ejecta sheet outcomes based on the flow into the ejecta sheet for a wide variety of pool impact scenarios.
Supplementary material and movies
Supplementary material and movies are available at https://doi.org/10.1017/jfm.2023.622.
Acknowledgements
We thank D. Vella for lending us the confocal system. Some simulations were undertaken on ARC3, part of the High Performance Computing facilities at the University of Leeds, UK.
Funding
This work was funded by two NSF/CBET-EPSRC grants (grant nos EP/S029966/1 and EP/W016036/1) and a Royal Society University Research Fellowship (grant no. URF\R\180016) & Enhancement Award (grant no. RGF\EA\181002).
Data availability statement
The data supporting this study are available at https://github.com/OxfordFluidsLab/ShallowPoolImpact.
Declaration of interests
The authors report no conflict of interest.


 Open access