


Introduction
Marine resources have been vital for humans, providing food, fuel, clothing and various raw materials, and helping shape the economic trajectories of European societies. Fish were a vital source of protein in ancient Rome, and were often preserved to extend their shelf life both for local consumption and trade. To enable large-scale preservation, the Romans established fish-salting plants, also known as cetariae, in coastal areas throughout the Roman Empire. These facilities processed and preserved fish, mainly through salting and fermentation (Bernal-Casasola et al. Reference Bernal-Casasola, Expósito and Díaz2018). Large fish, such as tuna, were cleaned, gutted and layered with salt in stone vats to draw out moisture, thus preventing bacterial growth, which allowed the fish to be stored for long periods and facilitated its commerce throughout the Empire.
Small fish, typically not considered high quality, were used to make fish sauces such as garum, which was used for seasoning and as a condiment, adding an umami flavour to food. Garum, liquamen, allec or muria (Grainger Reference Grainger and Hocquet2014) were prepared by crushing the whole fish and then fermenting it in brine. Pelagic fish, such as sardines, sprats, anchovies and mackerels, were therefore an important component of the human diet in the Roman period in the form of fish sauce, while sardines were also used for the making of fish pastes that could additionally contain other marine and land fauna (Marzano Reference Marzano2018).
Fish bones are a frequent find in the archaeological record yet their use in archaeogenomic studies is residual, probably due to the fragmentary nature of remains, which makes identification to species or even genus difficult. Ancient DNA (aDNA), however, has been recovered from the remains of a number of different fish species (Oosting et al. Reference Oosting, Star, Barrett, Wellenreuther, Ritchie and Rawlence2019). Analysis of these data has the potential to open a new research avenue into the subsistence economies, cultures and diets of past human populations, and provide information on fish populations that cannot be obtained from fishery catch data or modern specimens alone, such as demographic dynamics and adaptive change over time. Studies have not only analysed larger species, such as catfish (Arndt et al. Reference Arndt, Van Neer, Hellemans, Robben, Volckaert and Waelkens2003), bluefin tuna (Andrews et al. Reference Andrews2021) and cod (Star et al. Reference Star2017; Martínez-García et al. Reference Martínez-García2021; Pinsky et al. Reference Pinsky2021), but have also focused on herring (Atmore et al. Reference Atmore, Martínez-García, Makowiecki, André, Lõugas, Barrett and Star2022, Reference Atmore2024) and have shown good preservation and high levels of endogenous DNA in most remains (Star et al. Reference Star2017; Oosting et al. Reference Oosting, Star, Barrett, Wellenreuther, Ritchie and Rawlence2019; Ferrari et al. Reference Ferrari2021) even with small amounts of material (Atmore et al. Reference Atmore2023).
The bottoms of fish-salting vats offer a myriad of remains, yet one of the biggest challenges to studying pelagic fish from these contexts is the small size of the bone material. Fish are crushed during the production of fish sauce/paste, so most bones from fish-salting vats are disarticulated; broken vertebrae are the most common bone present and the fragile and fractured bones are often difficult to identify to species level. The small bone size also limits the initial amount of tissue available for DNA extraction and library construction.
DNA preservation in these samples may be affected by the fermentation process, which creates an acidic environment and increases the depurination rate, and hence fragmentation, of the DNA molecule (Bauer et al. Reference Bauer, Weller, Hammes and Hertel2003). The proliferation of microorganisms, and their DNA-trimming enzymes (endonucleases), in this environment also contributes to higher levels of DNA degradation (Gryson Reference Gryson2010; Garnier et al. Reference Garnier, Bernal-Casasola, Driard and Pinto2018), which may be further exacerbated by additional processing such as grinding and maceration (Gryson Reference Gryson2010). Moreover, as multiple fish were processed simultaneously, specimens from the vats may be contaminated with DNA from other fish of the same or different species.
Here, we report the results of our attempt to extract and sequence DNA from small bone remains, mainly crushed vertebrae, morphologically identified as European sardine (Sardina pilchardus), found at a Roman cetariae in Adro Vello, O Grove, Galicia. Through this, we can assess the suitability of such remains for aDNA research.
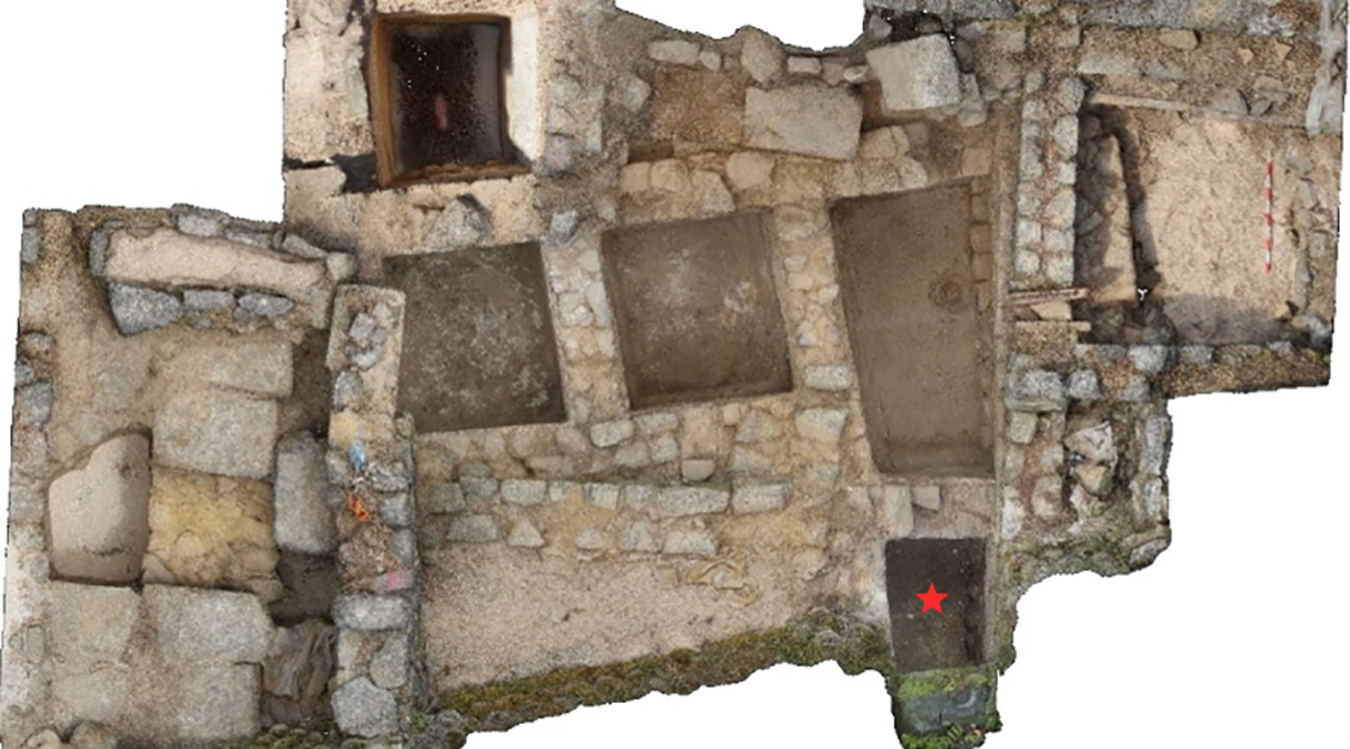
Adro Vello is an archaeological site on the shore of O Carreiro beach, in north-west Iberia (Figure 1). The site has a long history of occupation, beginning in the first–third centuries AD with the fish-salting plant (Figure 1b) followed by a fourth–seventh-century AD Late Roman villa, and continuing with a possible Early Medieval monastery (eighth–eleventh centuries) and a medieval church with a large cemetery (thirteenth–eighteenth centuries) (Mangas-Carrasco et al. Reference Mangas-Carrasco, Colmenares-Prado, Fernández-Fernández and López-Costas2022). Within the Roman assemblage, four large vats were identified; the presence of preserved ichthyological fish residues at the bottom of vat number one suggested that these had been used in the production of fish sauces and pastes.
a) Map of the Iberian Peninsula with the location of Adro Vello, O Grove marked in red; b) 3D reconstruction of the fish-salting plant at Adro Vello, the location of vat 1 is marked with a red star; c) aerial view of O Carreiro beach showing the location of Adro Vello (figure by authors).

This study aims to determine whether shotgun sequencing of DNA extracted from small bones retrieved from these residues can identify the fish species used at this site in the production of garum and thereby to assess the potential for DNA preservation in fish bones from fermentation brines. Despite the prevalence of such remains in the European archaeological record, to our knowledge, genomic studies have yet to take advantage of the vast potential of this data source for elucidating past fish consumption and the population dynamics of commercially relevant fish species.
Materials and methods
Sampling, stratigraphy and radiocarbon dating
Ichthyological remains, including spines, vertebrae and scales (Figure 2), were collected from the bottom of fish-salting vat number one at Roman Adro Vello (Figure 1b). These were placed in zip-lock bags and stored and processed in the Laboratorio de Prehistoria at the University of León, Spain. The remains were washed through a 0.8mm sieve, separated into groups and assessed based on their morphology. Where taxonomic determination was possible, the remains were mostly identified as Sardina pilchardus (González Gómez de Agüero Reference González Gómez de Agüero2014).
Ichthyofauna remains from the bottom of vat 1 before processing (a), and after processing sorted into fish spines (b), vertebrae (c) and scales (d) (figure by authors).

To confirm the period in which this salting plant was active, a fish-bone sample from the bottom of vat 1 was sent to Beta Analytic for accelerator mass spectrometry (AMS) radiocarbon dating. The resulting dates were calibrated using BetaCal4.20, and the high probability density range method Marine20 was used to correct for the local ocean reservoir effect (Heaton et al. Reference Heaton2020). Before radiocarbon dating, the bones were treated with alkalis to extract collagen.
DNA extraction and library building
DNA extractions and double-stranded DNA Illumina library preparation steps were conducted in a dedicated aDNA facility at the Museum of Natural History in Stockholm, Sweden. This facility is specifically designed to handle degraded samples that are particularly susceptible to contamination from exogenous DNA sources. During DNA extraction and polymerase chain reaction (PCR) processes contamination was monitored using blank controls. Total cellular DNA was extracted from 18 bone samples, including vertebrae and opercula (bony plates that cover the gill slits), according to the following protocol. All bones were either crushed with a mortar or simply placed in an Eppendorf (smaller vertebrae) and incubated overnight at 37°C in 1.0mL of 0.5M EDTA and 25mg/ml proteinase K. This solution was centrifuged at 12 000rpm for five minutes, to pellet the non-digested powder. The liquid fraction was then transferred to a Centricon micro-concentrator (30-kDa cut-off) and spun at 4000rpm for 10 minutes. Once the liquid was concentrated to 200–250μl, the DNA was purified using the MinElute PCR purification kit (Qiagen), with three modifications: 1) 13ml of PB buffer (Qiagen) was used for the DNA binding step; 2) spins were conducted at 8000rpm with the exception of a final spin at 13 000rpm; 3) in the elution step, spin columns were incubated in 25μl EB buffer at 37°C for 10 minutes, then spun down and repeated once more with both eluates pooled at the end.
Library construction and amplification
Blunt-end, double-stranded DNA Illumina libraries were constructed from 21.25μl of DNA extract following the protocols outlined by Maricic et al. (Reference Maricic, Whitten and Pääbo2010) and Meyer and Kircher (Reference Meyer and Kircher2010). The amplified libraries were quantified on an Agilent 2100 Bioanalyzer High Sensitivity DNA chip, and pooled and screened at Novogene (150PE read mode). The 12 libraries with the highest percentage of endogenous DNA were then deep sequenced in one fourth of a lane on an Illumina Novaseq X (150 cycles, PE read mode) at SciLife Lab, Sweden.
Data processing, mapping and annotation
The Illumina software CASAVA 1.8.2, with the requirement of a 100 per cent match to the six-nucleotide index used during library preparation, was used for base calling. Raw Illumina reads were initially processed with Trimmomatic (v.0.36) (Bolger et al. Reference Bolger, Lohse and Usadel2014) to remove adapter sequences, trim bases with quality scores below 20 and discard reads shorter than 30 bases. Clean reads were mapped to the European sardine genome assembly using bwa-mem (v.0.7.17-r1188; Li Reference Li2013), and samtools (v.1.7; Li et al. Reference Li2009) was used to retain reads with mapping quality above 25. Picard MarkDuplicates (v. 1.95; https://broadinstitute.github.io/picard/) was used to remove PCR duplicates.
The mitochondrial genome for each sample was obtained as a consensus sequence of the reads mapped to the European sardine complete mitochondrial genome (GenBank accession number GCF_963854185.1). This was achieved using the -doFasta 2 option in ANGSD (Korneliussen et al. Reference Korneliussen, Albrechtsen and Nielsen2014), excluding positions with sequencing depth below 3X (-setMinDepth 3). To check for intraspecific contamination from other sardines in the brine, we called single nucleotide polymorphisms (SNPs) using a diploid model in FreeBayes (v.1.3.8; Garrison & Marth Reference Garrison and Marth2012). No signs of contamination were detected.
ANGSD was also used to produce Beagle files containing the positions of SNPs on the nuclear genome (Korneliussen et al. Reference Korneliussen, Albrechtsen and Nielsen2014) using the following options: angsd -bam $bamList -ref $REF -out ${out}.snp -C 50 -baq 2 -remove_bads 1 -uniqueOnly 1 -doCounts 1 -doGlf 2 -GL 1 -doMaf 2 -SNP_pval 1e-6 -doMajorMinor 1 -minQ 20 -minMapQ 30 -minInd 62 -minMaf 0.05 -rmTrans 1. Transitions (base substitutions from A to G and from C to T, or vice versa) were excluded. A restrictive minimum allele frequency of 0.05 was used to discard possible contamination. A total of 54 438 SNPs were obtained using all samples allowing for 50 per cent missing data (-minInd62) and keeping only the SNPs that had information for at least one of the five samples with the lowest sequencing depth (1004, 1009, 1013, 1014, 1018, the ones that were not chosen for deep sequencing due to lower endogenous values). Admixture proportions were estimated by running NGSadmix (v.32; Skotte et al. Reference Skotte, Korneliussen and Albrechtsen2013) for number of populations K = 2 and K = 3 with 300 seed values, ensuring convergence. PCAngsd (v.0.1; Meisner & Albrechtsen Reference Meisner and Albrechtsen2018) was used to obtain a principal component analysis (PCA) using the same SNP set.
Authentication and alignment
We ran DamageProfiler (v.0.4.9; Neukamm et al. Reference Neukamm, Peltzer and Nieselt2021) to detect DNA post-mortem damage patterns typical of ancient or degraded DNA. The program uses misincorporation patterns, particularly deamination of cytosine into uracils, within a Bayesian framework. An elevated C to T (cytosine to thymine) substitution rate towards sequencing starts (and complementary G to A (guanine to adenine) rate towards the end) is considered indicative of genuine ancient or degraded DNA.
Species identification and phylogenetic analysis
Full mitochondrial DNA genomes were first aligned with mitogenomes from the European sardine, Atlantic chub mackerel (Scomber colias), Atlantic horse mackerel (Trachurus trachurus), anchovy (Engraulis encrasicolus), sprat (Sprattus sprattus), European seabass (Dicentrarchus labrax) and gilthead seabream (Sparus aurata). Protein-coding genes (except for ND6) and ribosomal RNA genes, as annotated in the European sardine reference mitochondrial genome, were extracted from the alignment and served as input in Beast (v.2.7.6; Bouckaert et al. Reference Bouckaert2019). Genes were input separately under a linked tree and clock model and independent sites models, allowing each gene to have independent mutation rates. We picked a GTR (general time reversible) nucleotide substitution model, with a proportion of invariable sites, and a strict clock model, as we were more interested in taxonomic classification of our samples than in splitting times. We picked the most complex model (GTR), as recommended by Huelsenbeck and Rannala (Reference Huelsenbeck and Rannala2004), as Bayesian phylogenetics is less sensitive to overspecification than underspecification. We ran a Markov chain Monte Carlo simulation for 10 million generations and 10 per cent were discarded as burn in.
Historical mitochondrial genomes from Adro Vello were aligned with 108 modern mitogenomes from across the species distribution range (Barry et al. Reference Barry, Broquet and Gagnaire2022; da Fonseca et al. Reference da Fonseca2024). PopART (Leigh & Bryant Reference Leigh and Bryant2015) was used to estimate a median-joining haplotype network (Bandelt et al. Reference Bandelt, Forster and Röhl1999) based on mitochondrial SNPs with a minor allele frequency greater than 25 per cent (a total of 30 SNPs). This conservative filter was applied to reduce noise in the resulting network.
Results and discussion
Radiocarbon dating
The bone residue from vat 1 at Adro Vello showed good preservation, indicated by a C:N ratio of 3.3, which falls within the expected range for well-preserved collagen (2.9–3.6; DeNiro Reference DeNiro1985). The radiocarbon dating yielded an age of 2280±30 BP (Beta–663761), which corresponds to a calibrated date range of cal AD 84–394 (at 95.4% probability) or cal AD 162–321 (at 68.2% probability). The stable isotope values for carbon (-12.2‰) and nitrogen (8.3‰) align with expectations for a marine pelagic fish species (Fuller et al. Reference Fuller, Müldner, Van Neer, Ervynck and Richards2012).
The marine reservoir effect presents a challenge when dating marine organisms, reflecting the complex interaction between the atmosphere and the ocean in the global carbon cycle, and appropriate correction of dates is particularly important when comparing marine and terrestrial samples. Oceans are vast carbon reservoirs, but complexities in marine circulation mean that the reservoir effect correction varies with location. North-western Iberia is an active upwelling area, but upwelling intensity varies depending on the latitude and may also have varied through time. This regional deviation from the average global marine reservoir correction is designated ΔR (Stuiver & Braziunas Reference Stuiver and Braziunas1993). There are no values for Adro Vello, Galicia (42°28′39.31″N, 8°55′52.93″W) so we averaged data from the 10 closest available points, found at http://calib.org/marine/ (Cook et al. Reference Cook2015), which are all situated on the Portuguese Atlantic Coast, producing a ΔR value of 12±163. However, the uncertainty of this value is large when compared with the correction factor itself; application of the correction factor only provides a date range of cal AD 102–409 for the fish remains, while including the uncertainty broadens this range to 161 cal BC–cal AD 637.
Stratigraphic information from Adro Vello can help reduce this date range. The inclusion of Haltern 70 amphorae fragments within the walls of the fish-salting plant dates its construction to the beginning of the first century AD. Haltern 70 is a type of Roman clay amphora produced in Baetica, a province in south-western Iberia, and usually found in north-western Iberia in the first half of the first century AD. In addition, a deposit excavated in 2023 and directly linked to the factory has provided archaeological materials dating from the first, second and early third centuries AD (composite date). Therefore, the abandonment and collapse of the factory must have occurred sometime in the early third century AD. A similar date has been attributed to the salting factory located in O Naso beach (Illa de Arousa, Pontevedra) 30km from Adro Vello (Fernández Fernández et al. Reference Fernández Fernández, Rodríguez Nóvoa, Valle Abad and Ruanova Álvarez2022). The fish remains discovered in the interior of vat number one are therefore most likely to date from around the beginning of the third century AD, which is consistent with the radiocarbon dating.
Extraction and library construction
All bone samples (n = 18) yielded usable DNA, and we were able to build libraries for each sample. Of these, 17 specimens were sequenced (one was discarded), each yielding between 4 and 21 per cent endogenous sardine DNA; a lower yield than has been described for larger fish such as the Atlantic cod (Ferrari et al. Reference Ferrari2021) yet still promising figures considering the processing endured by these samples before they entered the archaeological record. The pH of the brine solutions was likely highly acidic, due to the fermentation process, contributing to the acceleration of DNA degradation and resulting in lower levels of endogenous DNA and a higher fragmentation rate. Preservation through the fermentation method relies on the combination of low pH (generally below 5–4.5) and high organic acid content, particularly lactic acid, to effectively inhibit bacterial growth. These endogenous DNA yields therefore reveal new applications for fermentation residues in the study of historic economies and past societies.
Species identification
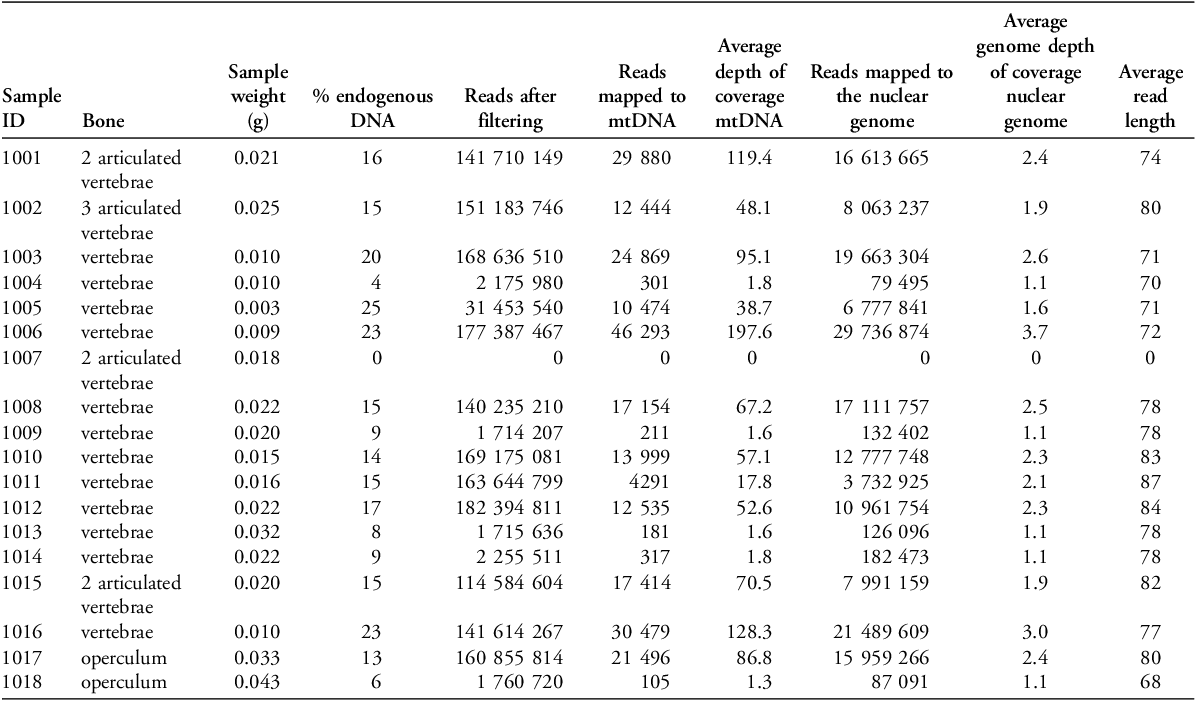
Twelve of the 18 samples were sequenced to a higher depth and mapped against the European sardine genome, having previously been morphologically identified as sardines. After removing duplicates and presumed paralogs (genes originated from duplication events) we successfully assembled the full mitochondrial genome (17 552 base pairs) for each sample, with a mean depth of coverage between 1.3 and 197.6X (Table 1) (data accessible from the Sequence Read Archive, https://www.ncbi.nlm.nih.gov/sra, bioproject PRJNA1198114). Assembled nuclear genomes have depths of coverage between 1.1 and 3.7X.
Sample information and mapping statistics for the 17 samples screened. mtDNA: mitochondrial DNA.

DNA damage patterns, visualised using DamageProfiler (v.0.4.9), show an increase in the frequency of thymine at the start of sequences and an increase in adenine at the end of sequences, confirming the endogenous nature of the DNA (see Figure S1).
Species identification was further confirmed by Bayesian phylogenetic reconstruction (Figure 3a). The 12 higher-depth samples from Adro Vello form a well-supported clade (group) with the reference mitogenome of the European Sardine with a posterior probability of one. The median joining network constructed using mitochondrial genomes from 120 fish from across the sardine distribution range shows that our historical specimens predominantly cluster with genomes from the Western and Central groups (da Fonseca et al. Reference da Fonseca2024), revealing haplotype continuity over the past 2000 years in this region.
a) Bayesian phylogenetic reconstruction based on the complete mitochondrial genome of 12 historical sardine samples. Sequences of European sardine (NC009592), Atlantic horse mackerel (NC006818), Atlantic chub mackerel (NC013724), sprat (NC009593), anchovies (NC009581), European seabass (NC026074) and gilthead seabream (NC024236) were also included in the analyses. Posterior probabilities above 0.9 are shown. b) Median joining network (PopArt) of 108 modern and 12 historical mitochondrial genomes. Only variants with minor allele frequency above 25% were used. Hatch marks represent mutations; colours represent the main ancestry of each individual (as defined in da Fonseca et al. Reference da Fonseca2024) except for the Adro Vello historical samples, depicted in burgundy (figure by authors).

Sardine population structure
We compared the nuclear data obtained from Adro Vello specimens to the previously published genomes of modern sardines from across the distribution range of the species (Barry et al. Reference Barry, Broquet and Gagnaire2022; da Fonseca et al. Reference da Fonseca2024). The admixture analyses conducted in NGSadmix show that the Adro Vello population clusters with the Central group, which encompasses samples from Morocco, Iberia and the Atlantic Coast of France (Figure 4b). The Adro Vello samples seem much less admixed than their modern counterparts from western Iberia, with only one sample (1003) presenting a small genetic contribution from the Eastern group.
a) Distribution of sardine populations based on the first two components of the PCA. Variation explained by each component is shown in parentheses. Samples from the Western group are depicted in light blue. Central group samples in dark blue and Mediterranean samples in yellow. The samples from the Canary Islands are shown in green and the Adro Vello samples in burgundy (the five samples with lowest depth of coverage are depicted as circles). b) Population structure plot, obtained with NGSadmix, showing the ancestry of each individual (vertical bar) to two (above) and three (below) genetic clusters. Samples from Adro Vello are highlighted with a burgundy outline (figure by authors).

The principal component analysis also places the Adro Vello samples with fish from the Central group (Figure 4a), with PC1 explaining 7.3 per cent of the variation and PC2 explaining 1.2 per cent. The samples from Adro Vello form a coherent group, and the lower admixture rates combined with the greater differentiation from both Mediterranean and Macaronesian populations suggest reduced connectivity between sardine populations in the Roman period. Increased admixture rates in modern populations may result from human activity, such as intensive fishing and shipping movement in the Atlantic. The European sardine is an economically important fish species, especially in southern Europe and Morocco, and is the main target of the purse-seine fleets, in Portugal and Spain, that surround whole schools of fish with a net wall that is then drawn up from the bottom to prevent escape. This species represents a major source of income for local economies and has been overexploited in recent decades (ICES 2013).
Resource use in O Grove and the southern Atlantic facade
Morphological and aDNA analyses confirm that the European sardine was the main fish resource for the making of Roman fish sauce at the archaeological site of O Grove, consistent with the use of this species at other fish-salting plants on the coast of Galicia (González Gómez de Agüero Reference González Gómez de Agüero2014) and more broadly along the Atlantic facade. For example, production residue from a Roman fish-salting plant on Rue du Guet, Douarnenez, on the Atlantic coast of France, is identified as consisting of sardine and some sparids (e.g. gilthead seabream) (Desse & Desse Reference Desse and Desse1983). In Brittany (north-west France), a residue of European sardine is identified in the Douarnenez II fish-salting plant (Sanquer Reference Sanquer1977) as well as in the Lanévry plant (Driard Reference Driard2011; Ephrem Reference Ephrem2016a) and the La Falaise site (Étel). In vat 1 at La Falaise, 99.6 per cent of the fish remains were European sardine, while the rest were a mix of Atlantic herring (Clupea harengus), whiting (Merlangius merlangus) and Atlantic mackerel (Scomber scombrus) (Ephrem Reference Ephrem2016b).
Further examples of the preponderance of sardine in Roman industrial contexts can be found on the coast of Portugal. In Lisbon, on Rua Augusta, the ichthyological residue recovered inside the vats of a fish-salting plant had a clear prevalence of European sardine (Fabião Reference Fabião2017). Nearby, in Belém, a large fish-salting plant was excavated in the old Governor’s House. Remains of ichthyofauna were recovered from 16 vats and the European sardine represented more than 98 per cent of the recovered material; other residual species included anchovy, Atlantic horse mackerel, Atlantic mackerel and Mediterranean moray (Muraena helena) (Fabião et al. Reference Fabião, Filipe, Dias, Trindade, Prudêncio, Gabriel and Coelho2021). Further south, in the large fish-producing centre of Tróia (Setúbal), the presence of European sardine is documented in the Tróia 1 factory along with clupeids, sturgeon (Acipenseridae), axillary seabream (Pagellus acarne) and Atlantic mackerel (Étienne et al. Reference Étienne, Makaroun and Mayet1994).
In Baelo Claudia, a Roman city in Baetica, close to the Strait of Gibraltar, several kinds of garum were prepared. In some cetariae, anchovy was the main fish used, while in others 95 per cent of the remains were from the European sardine, and garum was also made using sprat and axillary seabream (Bernal-Casasola et al. Reference Bernal-Casasola, Expósito and Díaz2018). In the Atlantic territory of North Africa, the situation was similar: in Tahaddart (Assilah, Morocco) sauces based on sardine and clupeids have been identified (Adolfo Fernández pers. comm.).
Conclusions
Ichthyofaunal remains from the bottom of fish-salting vats present a novel opportunity to study the aDNA of fish from the same population, as the remains offer a secure contemporaneity that is often lacking in other archaeological contexts. Where bones are crushed or otherwise morphologically unidentifiable, bulk bone metabarcoding can be used as a complementary method for fish species identification, as already demonstrated for terrestrial animals (Murray et al. Reference Murray2013; Grealy et al. Reference Grealy2015).
In this study, we demonstrate that usable DNA can survive in fermentation environments, such as the brines used by the Romans to make garum, allowing for species identification and the study of ancient populations. To our knowledge, this is the first time DNA has been extracted and sequenced from remains from the bottom of Roman fish-salting vats. Despite enduring conditions that promote the degradation of DNA, the methods we outline here allow for the identification of species from these processed bones, opening a new window into the past in the study of archaeological fish remains, an often-overlooked resource. This approach would also work for other fish species that have a modern reference genome/mitogenome, paving the way for systematic studies of fish species used in different sites, eras or cultures and their population dynamics.
Acknowledgements
We thank Professor Love Dalén for hosting Paula F. Campos, and Edana Lord and Vendela Kempe Lagerholm for lab guidance.
Funding statement
This research was partially supported by the Strategic Funding UIDB/04423/2020 and UIDP/04423/2020, through national funds provided by Fundação para a Ciência e a Tecnologia (FCT) and the European Regional Development Fund, in the framework of the programme PT2020. Paula F. Campos was partially supported by FCT (CEECIND/01799/2017; 2023.05877.CEECIND, SARDINOMICS 2022.03142.PTDC) and SYNTHESYS+ (SE-TAF-TA3-005), which funded access to a clean lab facility at the Museum of Natural History in Stockholm.
Online supplementary material (OSM)
To view supplementary material for this article, please visit https://doi.org/10.15184/aqy.2025.73 and select the supplementary materials tab.


 Open access