


1. Introduction
Prosody provides additional layers of meaning to an utterance beyond its surface meaning. In fact, Mauchand et al. (Reference Mauchand, Caballero, Jiang and Pell2021) have suggested that even very early on in an utterance, when lexical choices do not necessarily evoke sarcasm yet, prosody has a role in helping listeners recognize the intent. This, however, may not be the case for everyone: differences in the recognition of sarcastic intent and affective prosody have been noted in individuals on the autism spectrum and the general population (American Psychiatric Association, 2013; and see Happé, Reference Happé1993; Kaland et al., Reference Kaland, Møller-Nielsen, Callesen, Mortensen, Gottlieb and Smith2002; Martin & McDonald, Reference Martin and McDonald2004; MacKay & Shaw, Reference MacKay and Shaw2004; Wang et al., Reference Wang, Lee, Sigman and Dapretto2006; Chevallier et al., Reference Chevallier, Noveck, Happé and Wilson2011; Mathersul, McDonald, & Rushby, Reference Mathersul, McDonald and Rushby2013; Scholten, Engelen, & Hendriks, Reference Scholten, Engelen and Hendriks2015; Nuber et al., Reference Nuber, Jacob, Kreifelts, Martinelli and Wildgruber2018; Deliens et al., Reference Deliens, Papastamou, Ruytenbeek, Geelhand and Kissine2018; Saban-Bezalel et al., Reference Saban-Bezalel, Dolfin, Laor and Mashal2019; Panzeri et al., Reference Panzeri, Mazzaggio, Giustolisi, Silleresi and Surian2022), raising the question of whether early prosody can be considered a useful cue for many individuals on the autism spectrum. In addition, neither the prosodic characteristics, nor the perception of only the first few words of a sarcastic utterance have been explored, resulting in a missing link between prior observations of differences in measured brain responses to sarcastic and sincere utterances and the attribution of these differences to prosody (as was suggested by Mauchand et al. Reference Mauchand, Caballero, Jiang and Pell2021). The focus of the present paper is thus the examination of early prosodic marking of sarcasm and its perception in individuals with variable self-identified autistic traits, which in the present paper is inferred to be present from participants’ self-identification as being on the autism spectrum and from their Autism Quotient Questionnaire scores (Baron-Cohen et al., Reference Baron-Cohen, Wheelwright, Skinner, Martin and Clubley2001).
The introduction first provides an overview of sarcasm and its acoustic and perceptual correlates, then discusses the relevant literature on sarcasm perception in individuals on the autism spectrum, and finally lays out the motivations and research questions of the present study.
1.1 Sarcasm and its acoustic and perceptual correlates
In Gricean terms, irony involves flouting the Maxim of Quality, while creating an implicature that is meant to be ‘the contradictory’ of the literal meaning (Grice, Reference Grice1975). Sarcasm, a type of irony, delivers an additional mocking or ridiculing component (Kreuz & Glucksberg, Reference Kreuz and Glucksberg1989; Lee & Katz, Reference Lee and Katz1998) and often targets a victim (Kreuz & Glucksberg, Reference Kreuz and Glucksberg1989). The theoretical debate around the characteristics that differentiate irony and sarcasm is ongoing (see Garmendia (Reference Garmendia2018) for a review), with a potential difference between scholars and non-linguist speakers in their application of the terms. In lieu of a proper definition, sarcasm is characterized in the present paper as a negative or critical attitude couched in positive language that is directed at some aspect of an event, some characteristic of a person, or a person’s actions. In addition, focus is largely on sarcasm as culturally understood in the United States, with mentions of empirical findings from other cultural and linguistic backgrounds where appropriate.
Speakers use particular gestures, facial expressions, lexical items (for example, hyperbole and intensifiers) and prosody when producing sarcastic utterances (for a discussion, see Kreuz & Roberts, Reference Kreuz and Roberts1995; Rockwell, Reference Rockwell2000; Pexman, Reference Pexman2008; Caucci & Kreuz, Reference Caucci and Kreuz2012; Garmendia, Reference Garmendia2018; Kreuz, Reference Kreuz2020; Aguert, Reference Aguert2022). Garmendia (Reference Garmendia2018) suggests that cues to irony cannot be too explicit; for instance, a speaker would not reveal irony by stating that they are being ironic. At the same time, cues must be strong enough for the listener to decipher the intended meaning. As it is a type of irony, similar rules may apply to sarcasm. Indeed, researchers find that relative differences between sarcastic and sincere speech supply sufficient information for the listener to infer the implicature behind the literal meaning of an utterance.
In an EEG study, Mauchand et al. (Reference Mauchand, Caballero, Jiang and Pell2021) report their listeners to show early sensitivity to prosody during sarcasm processing, even before hearing a critical word (= a ‘target’) that signals a contrast between a speaker’s prosody and the positive or negative valence of the target. For instance, in the sentence ‘He is a really nice fellow’, the word ‘nice’ is the target with positive valence, and ‘he is really’ is the ‘pre-target’ part. Given a sarcastic utterance, the positivity of ‘nice’ contrasts with the sarcastic intent of the speaker, cued by prosody in the present case. Mauchand et al. infer this sensitivity from neural activity at certain crucial points in the utterance: relative to when participants listened to sincere speech, the authors observed reduced activity after the target word was heard when participants listened to sarcastic speech (differences were observed at the P200, N400, and P600 event-related potential components, or ERPs). They interpret these results as showing the constraining effect of prosody during the ‘pre-target’ portion of the utterances on further processing: prosody is proposed to create a context against which listeners interpret the rest of the utterance. (N.B.: Mauchand et al. explore irony both when sarcastically and when more kindly meant; however, the present paper focuses on sarcasm specifically.)
Although previous studies provide evidence that people can recognize spoken sarcasm without supporting context (Rockwell, Reference Rockwell2000; Bryant & Fox Tree, Reference Bryant and Fox Tree2002; Rutherford, Baron-Cohen, & Wheelwright, Reference Rutherford, Baron-Cohen and Wheelwright2002; Voyer, Bowes, & Techentin, Reference Voyer, Bowes and Techentin2008; Voyer & Techentin, Reference Voyer and Techentin2010; Cheang & Pell, Reference Cheang and Pell2011; Loevenbruck et al., Reference Loevenbruck, Jannet, d’Imperio, Spini and Champagne-Lavau2013; Braun & Schmiedel, Reference Braun and Schmiedel2018; Li et al., Reference Li, Gu, Liu and Tang2020), much of the evidence comes from studies that test either full utterances or keywords, thus Mauchand et al. (Reference Mauchand, Caballero, Jiang and Pell2021) present novel evidence that the early part of an utterance could provide key information about sarcasm as well. What is not known, however, is what prosodic information in the pre-target part of the utterance listeners use in the identification of sarcasm (a question that is non-trivial even for full utterances, as suggested by Loevenbruck et al. Reference Loevenbruck, Jannet, d’Imperio, Spini and Champagne-Lavau2013 and González-Fuente et al. Reference González-Fuente, Prieto, Noveck, Barnes, Brugos, Shattuck-Hufnagel and Veilleux2016).
While Mauchand et al. (Reference Mauchand, Vergis and Pell2018, Reference Mauchand, Vergis and Pell2020) report on the prosody of the full utterances they used as stimuli in their processing study, the phonetic correlates of sarcasm in the critical region have not been examined previously to our knowledge. Importantly, the possibility of interpreting differences in processing as being due to prosody rests on there being a meaningful difference in the prosodic characteristics of the portions of sarcastic and sincere utterances that precede keywords. As outlined in Section 2, the present study continues this line of research to examine whether speakers make a systematic distinction in the prosody of sincere and sarcastic utterances from the beginning of the utterances (= ‘pre-target’ portion), that is, before lexical information reveals sarcasm to the listener, and if so, what prosodic features they utilize.
To determine whether there are perceptually meaningful differences in the prosody of pre-target utterance fragments, it is important to consider the correlates of sarcasm both in production and perception. The following subsections present first the phonetic correlates of sarcasm, as described for various languages (1.1.1), followed by a review of perceptual cues to sarcasm (1.1.2).
1.1.1 Acoustic correlates of sarcasm
This subsection presents a survey of findings regarding the phonetic correlates of sarcasm, showing that in general, sarcastic utterances are produced in a sufficiently distinct manner from sincerity, lending support to the idea that listeners can recognize the intent from prosody.
Broadly, there does not seem to be a specific intonation reserved exclusively for sarcasm across languages; rather, a person’s prosody appears to act as a marker of their attitude (see e.g. Grice, Reference Grice1975; Rockwell, Reference Rockwell2000; Bryant & Fox Tree, Reference Bryant and Fox Tree2002). (Although González-Fuente et al. (Reference González-Fuente, Escandell-Vidal and Prieto2015) did find the intonational contour L+H* L% to indicate sarcasm in Catalan, and González-Fuente et al. (Reference González-Fuente, Prieto, Noveck, Barnes, Brugos, Shattuck-Hufnagel and Veilleux2016) found H+!H* !H% on the critical word to be indicative of irony in French.) As such, ‘sarcastic prosody’ may come in many forms and is subject to speaker variation. The present section reviews the body of experimental work that aimed at determining the prosodic characteristics that accompany irony and sarcasm. (N.B.: not all of the authors make a distinction between different forms of irony, thereby potentially conflating sarcasm with other forms of ironic speech in the studies.)
Most of the work on ‘sarcastic prosody’ aims to ascertain if there are systematic ways in which sincere and sarcastic speech differ from each other. These approaches and methods vary depending on field of study (neuropsychology: Voyer, Bowes, & Techentin, Reference Voyer, Bowes and Techentin2008; communication: Rockwell, Reference Rockwell2000; Cheang & Pell, Reference Cheang and Pell2008, Reference Cheang and Pell2009; pragmatics: Bryant, Reference Bryant2010; or phonetics: Niebuhr, Reference Niebuhr2014; Chen & Boves, Reference Chen and Boves2018; Jansen & Chen, Reference Jansen and Chen2020) and whether the authors attend to production (Anolli, Ciceri, & Infantino, Reference Anolli, Ciceri and Infantino2002; Cheang & Pell, Reference Cheang and Pell2008, Reference Cheang and Pell2009; Loevenbruck et al., Reference Loevenbruck, Jannet, d’Imperio, Spini and Champagne-Lavau2013; Scharrer & Christmann, Reference Scharrer and Christmann2011; Niebuhr, Reference Niebuhr2014; Chen & Boves, Reference Chen and Boves2018; Jansen & Chen, Reference Jansen and Chen2020) or perception (Rockwell, Reference Rockwell2000; Bryant & Fox Tree, Reference Bryant and Fox Tree2002; Voyer, Bowes, & Techentin, Reference Voyer, Bowes and Techentin2008; Voyer & Techentin, Reference Voyer and Techentin2010). Across this range, the majority of the studies examine mean fundamental frequency (the articulatory correlate of perceived pitch), f0 range (minimum f0 subtracted from maximum f0), tempo (the rate of speech, measured either in mean syllable duration (Bryant, Reference Bryant2010), number of syllables divided by length of utterance (Cheang & Pell, Reference Cheang and Pell2008, Reference Cheang and Pell2009), or total length of utterance (Niebuhr, Reference Niebuhr2014)), and loudness or intensity (measured in dB). In addition to these, a smaller number of studies have considered further attributes such as hyperarticulation (Scharrer & Christmann, Reference Scharrer and Christmann2011), segmental reduction (Niebuhr, Reference Niebuhr2014), and voice quality (Cheang & Pell, Reference Cheang and Pell2008, Reference Cheang and Pell2009; Niebuhr, Reference Niebuhr2014). As the following subsections demonstrate, the majority of the studies report systematic changes in mean f0, f0 variability, and speech rate to be characteristic of sarcastic speech.
Mean f0: Many studies find mean f0 to be systematically different in sarcastic and sincere utterances. Some reported it to be lower in sarcasm (Rockwell, Reference Rockwell2000; Cheang & Pell, Reference Cheang and Pell2008; Scharrer & Christmann, Reference Scharrer and Christmann2011; Rao, Reference Rao2013; Niebuhr, Reference Niebuhr2014; Chen & Boves, Reference Chen and Boves2018; Braun & Schmiedel, Reference Braun and Schmiedel2018; Mauchand, Vergis, & Pell, Reference Mauchand, Vergis and Pell2020), while others observed the opposite (Anolli et al., Reference Anolli, Ciceri and Infantino2002; Cheang & Pell, Reference Cheang and Pell2009; Loevenbruck et al., Reference Loevenbruck, Jannet, d’Imperio, Spini and Champagne-Lavau2013; González-Fuente et al., Reference González-Fuente, Escandell-Vidal and Prieto2015; González-Fuente, Prieto, & Noveck, Reference González-Fuente, Prieto, Noveck, Barnes, Brugos, Shattuck-Hufnagel and Veilleux2016; Jansen & Chen, Reference Jansen and Chen2020). Although it is noteworthy that sarcastic intent is marked by mean f0 change relative to sincerity with many speakers maintaining a distinction, the directionality of the difference is not uniform in these studies, the results are inconsistent, and there is no consensus on how mean f0 relates to sarcasm (additionally, similar central tendencies of f0 over an utterance may hide patterns of variation among speakers related to local f0 dynamics and changes over time, reducing the measure’s informativity).
F0 variability: A less variable f0 contour or a more flat or monotonous intonation has been suggested to be characteristic of (at least a subtype of) sarcasm that has a ‘deadpan’ delivery (see e.g. Rockwell, Reference Rockwell2000; Attardo et al., Reference Attardo, Eisterhold, Hay and Poggi2003), and so previous studies also consider changes in f0 variability to be marking sarcasm. Researchers have used different phonetic correlates to index variability across studies, such as f0 range or standard deviation. Similarly to mean f0, studies that report f0 range show variability in the direction that the change takes: some show evidence for a smaller f0 span in sarcasm (Bryant & Fox Tree, Reference Bryant and Fox Tree2005; Cheang & Pell, Reference Cheang and Pell2008, Reference Cheang and Pell2009; Rakov & Rosenberg, Reference Rakov and Rosenberg2013; Niebuhr, Reference Niebuhr2014; Chen & Boves, Reference Chen and Boves2018; Mauchand, Vergis, & Pell, Reference Mauchand, Vergis and Pell2018; Braun & Schmiedel, Reference Braun and Schmiedel2018; Mauchand et al., Reference Mauchand, Vergis and Pell2020; Leykum, Reference Leykum2020), while others provide evidence of the opposite (Anolli et al., Reference Anolli, Ciceri and Infantino2002; Loevenbruck et al., Reference Loevenbruck, Jannet, d’Imperio, Spini and Champagne-Lavau2013; Gonzáles-Fuente et al., Reference González-Fuente, Prieto, Noveck, Barnes, Brugos, Shattuck-Hufnagel and Veilleux2016; Jansen & Chen, Reference Jansen and Chen2020). Findings are also variable from other studies that designate the standard deviation (sd) around mean f0 to be the index of f0 variability. Some find that sarcasm is marked by smaller standard deviation around the f0 mean, indicating a less variable f0 contour or a more flat intonation (Bryant & Fox Tree, Reference Bryant and Fox Tree2005; Cheang & Pell, Reference Cheang and Pell2008; Leykum, Reference Leykum2020) and others report the opposite (Anolli, Ciceri, & Infantino, Reference Anolli, Ciceri and Infantino2000; Anolli et al., Reference Anolli, Ciceri and Infantino2002), yet others find the measure to not differ substantially in the two affect conditions (Bryant Reference Bryant2010; Rakov & Rosenberg, Reference Rakov and Rosenberg2013; González-Fuente, Escandell-Vidal, & Prieto, Reference González-Fuente, Escandell-Vidal and Prieto2015). Variation in direction aside, it appears that some speakers do mark their sarcastic and sincere utterances by making a systematic change in f0 variability across conditions.
Speech rate: Another measure often observed to distinguish sarcastic and sincere speech is tempo or speech rate. A study looking at sarcasm in Thai, reports faster speech to correspond to sarcasm (Kumwapee & Jitwiriyanont, Reference Kumwapee and Jitwiriyanont2020), but, overwhelmingly, evidence seems to point to sarcastic intent being accompanied by slower speech rate relative to utterances with sincere intent (Rockwell, Reference Rockwell2000; Cheang & Pell, Reference Cheang and Pell2009, Reference Cheang and Pell2008; Bryant, Reference Bryant2010; Scharrer & Christmann, Reference Scharrer and Christmann2011; Loevenbruck et al., Reference Loevenbruck, Jannet, d’Imperio, Spini and Champagne-Lavau2013; Rao, Reference Rao2013; Niebuhr, Reference Niebuhr2014; González-Fuente et al., Reference González-Fuente, Escandell-Vidal and Prieto2015; González-Fuente et al., Reference González-Fuente, Prieto, Noveck, Barnes, Brugos, Shattuck-Hufnagel and Veilleux2016; Mauchand et al., Reference Mauchand, Vergis and Pell2018; Chen & Boves, Reference Chen and Boves2018; Mauchand et al., Reference Mauchand, Vergis and Pell2020; Jansen & Chen, Reference Jansen and Chen2020).
Other measures: In addition to f0-related measures and tempo, a number of other vocal characteristics have been investigated as indicators of sarcastic speech, such as intensity (or loudness), harmonics–to–noise ratio, jitter, and phonation type (voice quality). With respect to intensity, findings are varied. One of the first studies to consider loudness, Rockwell (Reference Rockwell2000), found that English speakers perceive louder speech as more sarcastic. In this particular study, intensity is regarded only in subjective measures, that is, in terms of how loud an utterance sounds. Although one production study (Cheang & Pell, Reference Cheang and Pell2008) that reports precise acoustic analyses corroborates the findings of Rockwell (Reference Rockwell2000) for English, another perception study (Voyer & Techentin, Reference Voyer and Techentin2010) supports the opposite direction of intensity change: the authors report sarcasm to be spoken with lower intensity (Voyer & Techentin, Reference Voyer and Techentin2010: 237). Reports on other languages are varied as well (Anolli et al., Reference Anolli, Ciceri and Infantino2000; Cheang & Pell, Reference Cheang and Pell2009; Scherrer & Christmann, 2011; Niebuhr, Reference Niebuhr2014; González-Fuente et al., Reference González-Fuente, Escandell-Vidal and Prieto2015; Braun & Schmiedel, Reference Braun and Schmiedel2018; Jansen & Chen, Reference Jansen and Chen2020) With respect to harmonics–to–noise ratio (the measure of average noise relative to the average periodic signal in sound measured in decibels), it is found to be a reliable index of sarcasm in Cheang & Pell (Reference Cheang and Pell2008, Reference Cheang and Pell2009), Lan et al. (Reference Lan, Hui, Xu and Mok2019), Li et al. (Reference Li, Gu, Liu and Tang2020), and Yang (Reference Yang2021); however, as with the previous measures, the direction of change varies. Yang (Reference Yang2021) additionally finds sarcasm to be characterized by higher jitter in English speakers’ production. Finally, with respect to phonation type, sarcasm was found to be expressed by a more creaky (as opposed to modal) voice in Mandarin (Li et al., Reference Li, Gu, Liu and Tang2020), by breathy or tense voice quality in German (Niebuhr, Reference Niebuhr2014) and by breathy, creaky, and falsetto voices in Catalan (González-Fuente et al., Reference González-Fuente, Escandell-Vidal and Prieto2015).
As mentioned previously, the speaker intends for the listener to recognize the sarcastic intent behind the surface meaning. What the studies reviewed above suggest is that changes in prosody (as well as gestures, facial expressions, lexical choices, and contextual information, which were not reviewed here) are employed by speakers systematically to mark sarcasm. To help determine what perceptually meaningful phonetic correlates there may be in pre-target utterance fragments, the following subsection reviews some evidence for what prosodic cues listeners are sensitive to when presented with complete utterances.
1.1.2 Perceptual cues to sarcasm
As shown in the previous subsection, there is variation in the directionality of change in prosodic characteristics in sarcasm (for instance, whether mean f0 is measured to be systematically lower or higher in sarcasm than in literal speech), and perception studies report that listeners are able to identify sarcasm among other affective stances and emotions (Rutherford et al., Reference Rutherford, Baron-Cohen and Wheelwright2002; Voyer, Bowes, and Techentin, Reference Voyer, Bowes and Techentin2008; Voyer & Techentin, Reference Voyer and Techentin2010; Braun & Schmiedel, Reference Braun and Schmiedel2018). Some combination of prosodic features is therefore likely to be sufficient to signal the attitude of the speaker and thus allow for the listener to infer the intended sarcastic meaning. The present subsection discusses perceptual cues to sarcasm. Previous studies have shown that durational, as well as f0-related differences may be important to successful detection of the intent, which aligns with the acoustic correlates detailed above. In addition to demonstrating the significance of individual cues, there is evidence (see e.g. González-Fuente et al., Reference González-Fuente, Prieto, Noveck, Barnes, Brugos, Shattuck-Hufnagel and Veilleux2016) implying that, rather unsurprisingly, the presence of multiple cues allows for improved perception.
Speech rate: Listeners are sensitive to speech rate. In a production and perception study, Mauchand et al. (Reference Mauchand, Vergis and Pell2018) find native English listeners to be sensitive to longer utterance duration in judging sarcasm. Similarly, analyzing the irony production and perception of French speakers and listeners, Augert (2022) finds utterance duration to be a robust cue. Durational differences are similarly an important cue to French listeners in González-Fuente et al. (Reference González-Fuente, Prieto, Noveck, Barnes, Brugos, Shattuck-Hufnagel and Veilleux2016). In sum, the three studies find reduced speech rate to be a salient cue to listeners, and to our knowledge, no study thus far has reported listeners to interpret increased speech rate as more sarcastic.
F0-related measures: The contribution of f0-related measures to sarcasm perception is more varied. Mauchand et al. (Reference Mauchand, Vergis and Pell2018) find native English listeners to be sensitive to reduced range of standard deviation of f0 (as a proxy for f0 variation). In contrast, González-Fuente et al. (Reference González-Fuente, Prieto, Noveck, Barnes, Brugos, Shattuck-Hufnagel and Veilleux2016), investigating French, report pitch range differences to be relatively less important in judging verbal irony. The authors do, however, find the intonational cue mentioned above statistically significant (i.e. having an H+!H* !H% intonation pattern on the critical lexical item as opposed to L* L%). Additionally, Glenwright et al. (Reference Glenwright, Parackel, Cheung and Nilsen2014) find listeners (both children and adults) to be sensitive to large f0 reduction in sarcasm in the production of one speaker who purposefully modulated her f0 to produce small, medium, and large differences between the target and the preceding utterance. Further, Voyer et al. (Reference Voyer, Bowes and Techentin2008) report listeners to recognize sarcasm above chance when an effort was made on the part of the recorded speaker to vary f0 only and keep utterance duration and intensity constant, thereby evaluating the unique contribution of f0 modulation to sarcasm recognition (the authors report reduced mean f0 in sarcasm relative to sincerity).
Multiple cues: In addition to considering the relative contribution of individual measures, the controlled manipulation of multiple measures at once has also been examined. González-Fuente et al. (Reference González-Fuente, Prieto, Noveck, Barnes, Brugos, Shattuck-Hufnagel and Veilleux2016) find that when utterance duration, pitch range, and intonation are all modified in the direction suggested to be characteristic of sarcasm for French (longer duration, reduced pitch range, and a H+!H* !H% pattern), listeners are more accurate in perceiving the intent. Similarly, Peters et al. (Reference Peters, Wilson, Boiteau, Gelormini-Lezama and Almor2016) report their English listeners to perceive English utterances as more sarcastic when presented with modified versions which had reduced pitch, increased duration, and increased intensity relative to the original.
The last two subsections reviewed the phonetic correlates and perceptual cues of sarcasm in full utterances and target words. As mentioned above, Mauchand et al. (Reference Mauchand, Caballero, Jiang and Pell2021) posit that listeners attune to a speaker’s sarcastic prosody early on in an utterance, even before they encounter the lexical item that could reveal sarcasm to them. The ability of listeners to recognize the early acoustic characteristics as cues to sarcasm, however, is also crucial. Differences have been reported between individuals on the autism spectrum and the general population with respect to sarcasm recognition, which suggests a possible difference in early sarcasm recognition as well. The following subsection reviews the relevant literature.
1.2 Sarcasm in Autism Spectrum Conditions (ASC)
Autism Spectrum Disorder (ASD) or Autism Spectrum Conditions (ASC) is a neurodevelopmental condition that is defined and diagnosed based on behavioral attributes, and, according to the Diagnostic and Statistical Manual of Mental Disorders (DSM-5), is generally characterized by individuals showing varying degrees of differences regarding social communication and social interaction, as well as by having restricted and repetitive patterns of behavior and interests (APA, 2013). ASC, as a spectrum condition, is considered to vary in the type and quality of traits involved (APA, 2013), showing heterogeneity in cognitive and linguistic abilities (Howlin, Reference Howlin2021; Prelock, Reference Prelock2021). Even though language impairment is no longer a requirement for receiving an ASC diagnosis, the implication being that language impairment is not universally present, the DSM-5 states that the following language and communication disorders (among others) may co-occur with an ASC diagnosis: deficit in joint attention and eye gaze, atypical use and perception of gestures, facial expressions, and intonation (APA, 2013). Other characteristics reviewed in Surian and Siegal (Reference Surian and Siegal2008) include variable difficulties with phonology and syntax (see e.g. Rapin & Dunn, Reference Rapin and Dunn2003), selective difficulties in semantics and pragmatics (e.g. Mitchell, Saltmarsh, & Russell, Reference Mitchell, Saltmarsh and Russell1997; Surian, Reference Surian1996), and prosody (see e.g. Simmons & Baltaxe, Reference Simmons and Baltaxe1975; Paul et al., Reference Paul, Augustyn, Klin and Volkmar2005; Peppé et al., Reference Peppé, McCann, Gibbon, O’Hare and Rutherford2007; Diehl et al., Reference Diehl, Bennetto, Watson, Gunlogson and McDonough2008; Diehl et al., Reference Diehl, Watson, Bennetto, Mcdonough and Gunlogson2009; Green & Tobin, Reference Green and Tobin2009; Peppé et al., Reference Peppé, Cleland, Gibbon, O’Hare and Castilla2011; Bonneh et al., Reference Bonneh, Levanon, Dean-Pardo, Lossos and Adini2011; Kaland, Swerts, & Krahmer, Reference Kaland, Swerts and Krahmer2013; Diehl & Paul, Reference Diehl and Paul2013; Grice, Krüger, & Vogeley, Reference Grice, Krüger and Vogeley2016; Kargas et al., Reference Kargas, López, Morris and Reddy2016; Hubbard et al., Reference Hubbard, Faso, Assmann and Sasson2017; Wehrle et al., Reference Wehrle, Cangemi, Krüger and Grice2018, Reference Wehrle, Cangemi, Hanekamp, Vogeley and Grice2020, Reference Wehrle, Cangemi, Vogeley and Grice2022; and for review, see McCann & Peppé, Reference McCann and Peppé2003; Loveall, Hawthorne, & Gaines, Reference Loveall, Hawthorne and Gaines2021; Asghari et al., Reference Asghari, Farashi, Bashirian and Jenabi2021; Grice et al., Reference Grice, Wehrle, Krüger, Spaniol, Cangemi and Vogeley2023). In light of the lack of homogeneity, however, Tager-Flusberg (Reference Tager-Flusberg2004) advocates for a research program that examines within-group variability (see Wittke et al. (Reference Wittke, Mastergeorge, Ozonoff, Rogers and Naigles2017) for heterogeneity in language traits).
Individuals on the autism spectrum have been observed to recognize some types of figurative language less accurately on average when compared to the general population (Dewey & Everard, Reference Dewey and Everard1974; MacKay & Shaw, Reference MacKay and Shaw2004; Kalandadze et al., Reference Kalandadze, Norbury, Nærland and Næss2018). Sarcasm is a type of figurative language in which the intended meaning does not match or is the opposite, in some sense, of the most conventional meaning of the utterance (Grice, Reference Grice1975), and its recognition has been identified as difficult for some people on the spectrum (DSM-5 (APA, 2013)). Such difficulties are demonstrated for children in Panzeri et al. (Reference Panzeri, Mazzaggio, Giustolisi, Silleresi and Surian2022), Saban-Bezalel et al. (Reference Saban-Bezalel, Dolfin, Laor and Mashal2019), Scholten et al. (Reference Scholten, Engelen and Hendriks2015), Chevallier et al. (Reference Chevallier, Noveck, Happé and Wilson2011), Wang et al. (Reference Wang, Lee, Sigman and Dapretto2006), MacKay & Shaw (Reference MacKay and Shaw2004), and Kaland et al. (Reference Kaland, Møller-Nielsen, Callesen, Mortensen, Gottlieb and Smith2002). In adults, Deliens et al. (Reference Deliens, Papastamou, Ruytenbeek, Geelhand and Kissine2018), Nuber et al. (Reference Nuber, Jacob, Kreifelts, Martinelli and Wildgruber2018), Mathersul et al. (Reference Mathersul, McDonald and Rushby2013), Martin & McDonald (Reference Martin and McDonald2004), and Happé (Reference Happé1993) found that individuals on the autism spectrum perform worse on irony and sarcasm comprehension tasks than does the general population. This, however, is not found to be a universal trait: a number of studies report no substantial differences between participants on the autism spectrum and the general population (Pexman et al., Reference Pexman, Rostad, McMorris, Climie, Stowkowy and Glenwright2011; Colich et al., Reference Colich, Wang, Rudie, Hernandez, Bookheimer and Dapretto2012; Glenwright & Agbayewa, Reference Glenwright and Agbayewa2012; Zalla et al., Reference Zalla, Amsellem, Chaste, Ervas, Leboyer and Champagne-Lavau2014; Au-Yeung et al., Reference Au-Yeung, Kaakinen, Liversedge and Benson2015; Braun, Schulz, & Schmiedel, Reference Braun, Schulz, Schmiedel, Calhoun, Escudero, Tabain and Warren2019). However, even in studies where no statistically significant group difference in sarcasm-related tasks is observed, authors note the presence of numerical differences in accuracy and latency (Au-Yeung et al., Reference Au-Yeung, Kaakinen, Liversedge and Benson2015) and, based on processing differences, some raise the possibility of there being a compensatory mechanism in place (Wang et al., Reference Wang, Lee, Sigman and Dapretto2006; Colich et al., Reference Colich, Wang, Rudie, Hernandez, Bookheimer and Dapretto2012). Findings across studies may be difficult to compare, with potential sources of variation including testing conditions (in-person communication, computer-mediated interaction), task and stimulus types (written text, spoken language, audiovisual stimuli), and the generally small sample sizes. On the other hand, given that ASC is a spectrum condition, diverging findings are not surprising; in fact, other studies do find within-group variation (Saban-Bezalel et al., Reference Saban-Bezalel, Dolfin, Laor and Mashal2019; Panzeri et al., Reference Panzeri, Mazzaggio, Giustolisi, Silleresi and Surian2022).
Relevant to the foregoing discussion is the connection between prosody, emotion recognition, and how these might relate to sarcasm processing and perception in ASC. Some studies observe that the source of the phonetic correlates of sarcastic prosody (reviewed above) is an underlying negative affect (Rockwell, Reference Rockwell2000; Cheang & Pell, Reference Cheang and Pell2008; Mauchand et al., Reference Mauchand, Vergis and Pell2020; Mauchand et al., Reference Mauchand, Caballero, Jiang and Pell2021), which has been noted to be akin to low-intensity emotions in its prosodic characteristics (Rockwell, Reference Rockwell2000; Anolli et al., Reference Anolli, Ciceri and Infantino2002). Thus there may be a connection between the ability to recognize emotion and affect and the ability to recognize irony and sarcasm. In fact, in an eye-tracking study, Olkoniemi, Strömberg, and Kaakinen (Reference Olkoniemi, Strömberg and Kaakinen2019) reported a correlation between self-reported emotion recognition ability and sarcasm processing in written text, such that participants who report poor emotion recognition were also slower at identifying sarcasm.
With respect to affective prosody recognition in ASC, results vary. There are reports of no substantial differences between individuals on the autism spectrum and the general population in affective prosody perception (Paul et al., Reference Paul, Augustyn, Klin and Volkmar2005; Grossman et al., Reference Grossman, Bemis, Skwerer and Tager-Flusberg2010; Hsu & Xu, Reference Hsu and Xu2014; Ben-David et al., Reference Ben-David, Ben-Itzchak, Zukerman, Yahav and Icht2020), but other studies provide evidence for such differences (Rutherford et al., Reference Rutherford, Baron-Cohen and Wheelwright2002; Peppé et al., Reference Peppé, McCann, Gibbon, O’Hare and Rutherford2007; Chevallier et al., Reference Chevallier, Noveck, Happé and Wilson2011; Grossman & Tager-Flusberg, Reference Grossman and Tager-Flusberg2012; Stewart et al., Reference Stewart, McAdam, Ota, Peppé and Cleland2013; Gebauer et al., Reference Gebauer, Skewes, Hørlyck and Vuust2014; Lindström et al., Reference Lindström, Lepistö-Paisley, Vanhala, Alén and Kujala2016; Fridenson-Hayo et al., Reference Fridenson-Hayo, Berggren, Lassalle, Tal, Pigat, Bölte and Golan2016; Rosenblau et al., Reference Rosenblau, Kliemann, Dziobek and Heekeren2017). Further, Rosenblau et al. (Reference Rosenblau, Kliemann, Dziobek and Heekeren2017) found emotion recognition accuracy to be negatively correlated with ASC characteristics. In addition to behavioral differences, findings of neuroimaging studies show divergence in affective prosody processing in individuals on the autism spectrum and the general population (Eigsti et al., Reference Eigsti, Schuh, Mencl, Schultz and Paul2012; Rosenblau et al., Reference Rosenblau, Kliemann, Dziobek and Heekeren2017).
Similarly to the findings of the correlation between written sarcasm comprehension and self-reported emotion recognition in Olkoniemi et al. (Reference Olkoniemi, Strömberg and Kaakinen2019), should there be reliable differences in spoken sarcasm recognition, they might be related to difficulties with decoding the phonetic correlates of emotion and affect.
1.3 Motivation for the present study
The previous subsections reviewed studies on (1) the phonetic correlates of sarcastic speech and a few perceptual cues to sarcasm, and (2) the perception of sarcasm and affect in individuals on the autism spectrum. Left out of this body of work is how these cues are deployed dynamically over the course of an utterance. Mauchand et al. (Reference Mauchand, Caballero, Jiang and Pell2021) argue that listeners are sensitive to ironic (including sarcastic) prosody in an utterance even before they encounter the lexical item that may reveal speaker intent to them (by the discrepancy between a negative affect and a lexical item with positive valence). With respect to this ‘pre-target’ prosody, however, although in previous studies the authors report on the prosody of the full utterances used as stimuli (see Mauchand et al., Reference Mauchand, Vergis and Pell2018, Reference Mauchand, Vergis and Pell2020), they do not inspect the phonetic correlates of sarcasm in the critical region, and thus they do not evaluate the acoustic properties of the utterance-initial fragments from either a production or a perception perspective. To our knowledge, no other study has investigated this question either. Additionally, what phonetic characteristics listeners are sensitive to when it comes to the critical region has also not been previously explored. The present study examines these two questions, as they are crucial to determining whether ‘pre-target’ prosody is a sufficient cue for sarcasm recognition.
In addition to the abovementioned questions, the ability of different listeners to interpret these early characteristics as cues to speaker intent is also crucial. How the acoustic properties of ‘pre-target’ utterance fragments (as defined above) relate to perceptual cues in sarcasm perception within individuals on the autism spectrum and the general population remains unknown, but ought to be explored given the pivotal role of ‘pre-target’ prosody to sarcasm perception as suggested in Mauchand et al. (Reference Mauchand, Caballero, Jiang and Pell2021) and the variable differences between individuals on the autism spectrum and the general population in both affective prosody and sarcasm recognition as reported in Section 1.2. The present study aims to begin to investigate the contribution of utterance-initial negative affect to making the pragmatic inference from sincerity to sarcasm in adults who identify themselves as being on the autism spectrum and adults who do not. Our listeners who were likely to self-identify as being on the spectrum were recruited from a pool of participants on Prolific who either specify being on the autism spectrum on their profile or specify identifying as being on the spectrum. Additionally, we recruited a small subset of our participants through an autism center. Note, however, that we did not request disclosure of a formal diagnosis, and we do not claim that the listeners in the study have a clinical diagnosis. See Sasson & Bottema-Beutel (Reference Sasson and Bottema-Beutel2022) on the importance of differentiating between studies on autistic traits in the general population versus clinically diagnosed autism.
We provide explicit information as to (i) the prosodic characteristics of ‘pre-target’ portions of an utterance (i.e. whether there is a sufficient difference in the pre-target region already) with special focus on F0 variability and speech rate, (ii) whether these phonetic differences are interpreted as cues by listeners, and (iii) the recognizability of sarcasm from those portions, given listeners who do and listeners who do not self-identify as being on the autism spectrum. We address these points with attention to speaker and listener variability, as the conflicting results of previous production and perception studies suggest that speakers vary in how they mark sarcasm, and listeners vary in how well they recognize it. We conducted a production and a perception study to address the following specific research questions:
Production:
[RQ1] Do speakers make a systematic distinction in the prosody of sincere and sarcastic utterances from the beginning of the utterances (= ‘pre-target’ portion), that is, before lexical information reveals sarcasm to the listener?
[RQ2] If so, what prosodic features do speakers utilize?
Perception:
[RQ3] Do listeners recognize sarcasm from the ‘pre-target’ part?
[RQ4] Are different speakers recognized at similar rates?
[RQ5] Is there a reliable difference in sarcasm recognition accuracy rates between individuals who did and individuals who did not self-identify as being on the autism spectrum?
[RQ6] What prosodic features do listeners associate with sarcasm?
2. Production study
2.1 Methods
2.1.1 Participants
Participants (17f, 1m) were students at a large Midwestern public university. All were in their early twenties, and their first language was English. The gender and age balance reflects the availability of participants. (N.B.: this precludes analysis as a function of age and gender.) All participants were compensated for their time and effort (20.00 USD/h, prorated).
2.1.2 Materials
The stimuli consisted of pairs of context–target English utterances constructed by the authors. Speakers were given contextual information to aid them in producing, in as natural a way as possible, the utterances with the appropriate attitude. The target sentences were similar in structure as those in Mauchand et al. (Reference Mauchand, Vergis and Pell2020). They contained adjectives with positive valence (to be interpreted either as sincere, disbelieving, or sarcastic, depending on the context). Each sentence had the structure of X is really quite a [positive adjective] [noun]. The utterances had an equal number of syllables and similar sonority in the pre-target region, having predominantly voiced segments in the pre-target portion of the utterance so that f0 could be reliably tracked. Each sentence was combined with three contexts: one supporting a sincere interpretation, one supporting a sarcastic one, and one supporting disbelief. The latter condition was included to encourage speakers to attend to the entire context before reading the target sentence and to avoid binary readings. Table 1 below gives a schematic representation of the task for sincerity and sarcasm (more sincere and sarcastic context–utterance pairs are given in Appendix A).
An example of an utterance with three contexts, one conducive to sincerity, one to sarcasm, and one to disbelief

2.1.3 Procedure
Speakers were recorded individually in a sound-attenuated booth with an AKG C4000 B microphone connected to a Focusrite Scarlett Solo. Each speaker entered the sound-attenuated booth where one laptop was set up for recording and one for the presentation of the speech stimuli. The first author was present during recording with each speaker. Prior to recording, participants completed a training session during which they were familiarized with the procedure and the equipment. Following the training session, each speaker was presented first with written contextual information (black background with white text), which they were instructed to read silently. A target sentence was presented in a light orange color, which speakers were asked to produce aloud. They were instructed to take into account the context provided when producing the target sentence. Participants did not receive instruction regarding the prosody of their utterances, but they were asked to repeat an utterance if there was noticeable disfluency in their first production. They were also told that they could repeat an utterance if they were not satisfied with their first attempt.
The recording process was self-paced; participants advanced by right-clicking on the laptop’s touchpad. There were planned short breaks in ten-utterance increments, and participants were also encouraged to take breaks as needed. Context-utterance pairs were each presented twice in pseudo-random order. There were 32 target items, each presented twice with three contexts by each speaker, resulting in 192 utterances per speaker and 3,456 utterances in total. Recording took approximately 45 minutes per speaker. The authors acknowledge concerns of ecological validity regarding the recording procedure of semi-acted affect; however, given the constraints on the stimuli for the perception part of the study, the number of syllables in the utterances and utterance fragments had to be controlled; therefore, completely spontaneous utterances were not a possibility.
2.1.4 Phonetic analysis
Phonetic analysis focused on a random subset of eight speakers due to time constraints resulting from time-intensive annotation procedures. Given the imbalance in gender, only female speakers were selected for analysis. The selection was random after participants were screened for potential issues (disfluencies, giggling, experimental error, creakiness in the pre-target region, etc.). The first repetition of each utterance was analyzed, unless there was disfluency, in which case the second repetition was used. In total, 512 utterances (32 sentences × 2 affect conditions × 8 speakers) were included for analysis in Praat (Boersma & Weenink, Reference Boersma and Weenink2023). Participants were coded as P1–P8. The pre-target part of the utterances comprising X is really quite a was extracted for analysis and also for use as stimuli in the perception task. The end point for the fragments was the end of the schwa segment as identified in the spectrogram based on formant structure and drop of amplitude of the following segments.
Acoustic features measured in Praat included speech rate (measured as average syllable length within the first five syllables, X is really quite a), and f0 range (calculated from f0 minimum and f0 maximum, which are reported in Appendix B, Table B1 along with f0 mean). F0-variability was quantified in terms of wiggliness (Wehrle et al., Reference Wehrle, Cangemi, Krüger and Grice2018; Wehrle, Reference Wehrle2022, Reference Wehrle2023), that is, for the number of changes in slope direction per time period. The pitch track was first manually corrected for any errors in tracking, and interpolated over creakiness before f0 measurements were taken.
For measuring wiggliness, the utterances were stylized to a resolution of two semitones, which is suggested to be an appropriate measure for noticeable differences in pitch perception (Wehrle et al., Reference Wehrle, Cangemi, Krüger and Grice2018; Wehrle, Reference Wehrle2022; Niebuhr et al., Reference Niebuhr, Reetz, Barnes, Yu, Gussenhoven and Chen2020). The number of f0 slope direction changes were counted manually. Note that our analysis differed from that detailed in Wehrle et al. (Reference Wehrle, Cangemi, Krüger and Grice2018) and Wehrle (Reference Wehrle2022), where wiggliness is defined as the number of turns in f0 slope per second. In the present study, the number of turns per utterance fragment were measured. The motivation behind this change was that the fragments were not long (often under one second in duration) and were of equal length in syllables and had the same syntactic structure (X is really quite a).
The unique contribution of wiggliness as an index of f0 variability is that it allows the researcher to measure directly how much the f0 contour changes over time, rather than rely on averaged values of f0 or the two end points of f0 minimum and maximum (which do not contain information about variability per se). Wehrle et al. (Reference Wehrle, Cangemi, Krüger and Grice2018, Reference Wehrle, Cangemi, Hanekamp, Vogeley and Grice2020) found greater wiggliness (along with greater f0 range and greater spaciousness, a measure of maximum f0 slope excursion, introduced in the same work) in the speech of German speaking individuals on the autism spectrum, which the authors interpreted as indicative of a more melodic intonation style compared to that of the general population. The use of this prosodic feature has not yet been examined as a marker of sarcasm, but it is possible that a more ‘flat’ intonation (as in ‘deadpan’ sarcasm) might correspond to reduced wiggliness (as opposed to a more ‘melodious’ intonation with greater wiggliness), and a more exaggerated sarcastic intonation might correspond to greater wiggliness.
2.1.5 Production statistical analysis
Average measured values and standard deviations for each prosodic measure for each speaker in both affective conditions were calculated. Table 2 presents data on the correlation between these measures.
Pairwise correlations between the acoustic measures

Measures were centered and wiggliness was scaled by a factor of 100 to bring it to within an order of magnitude of duration and f0 range. Prosodic feature associations were analyzed via Bayesian hierarchical modeling, with average syllable duration, f0 range, and wiggliness as predictor variables and sarcastic intent as the dependent variable. Speaker and Sentence type were included in the model as random intercepts and random slopes for each were included for all three prosodic measures. Models were fitted using Stan (2.32.6) via the brms package in R; fixed effect priors were set to $\mathcal{N}$
(0, 1) for the Intercept and to
$\mathcal{N}$
(0, 1) for the Intercept and to $\mathcal{N}$
(0, 3) for the other regression coefficients, the random variance prior was set to Exp(1) and all other priors were set to the brms defaults; 4,000 samples were taken from four MCMC chains (following 1,000 warm-up samples per chain).
$\mathcal{N}$
(0, 3) for the other regression coefficients, the random variance prior was set to Exp(1) and all other priors were set to the brms defaults; 4,000 samples were taken from four MCMC chains (following 1,000 warm-up samples per chain).
Statistical analyses were carried out in R (v4.2.1; R Core Team, 2022) The R packages used were: bayesplot (Gabry & Mahr, Reference Gabry and Mahr2024), brms (Bürkner, Paul-Christian, Reference Bürkner2017), brmstools (Vuorre, Reference Vuorre2018), data.table (Barrett et al. Reference Barrett, Dowle, Srinivasan, Gorecki, Chirico and Hocking2024), devtools (Wickham et al., Reference Wickham, Hester, Chang and Bryan2022), dplyr (Wickham et al., Reference Wickham, François, Henry, Müller and Vaughan2023), forcats (Wickham, Reference Wickham2023), ggplot2 (Wickham, Reference Wickham2016), stan (Stan Development Team, 2024), rstanarm (Goodrich et al., Reference Goodrich, Gabry, Ali and Brilleman2024), seriation (Hahsler, Buchta, & Hornik, Reference Hahsler, Buchta and Hornik2024), stringr (Wickham, Reference Wickham2022), tidybayes (Kay, Reference Kay2023), tidyr (Wickham, Vaughan, & Girlich, Reference Wickham, Vaughan and Girlich2023), and tidyverse (Wickham et al., Reference Wickham, Averick, Bryan, Chang, McGowan, François, Grolemund, Hayes, Henry, Hester, Kuhn, Pedersen, Miller, Bache, Müller, Ooms, Robinson, Seidel, Spinu, Takahashi, Vaughan, Wilke, Woo and Yutani2019).
Centered data by speaker (P1–P8) in the sincerity and sarcasm conditions. The black points correspond to the individual means; error bars indicate standard error of the mean.

2.2 Production study results
2.2.1 Systematic distinctions (RQ1) and speaker differences (RQ2) in pre-target prosody
The first question regarding production was whether speakers make a systematic distinction in the early portion of their production of sarcastic and sincere utterances. Features measured were f0 range (Hz) (from f0 minimum and maximum), wiggliness (f0 slope direction changes in the pre-target region), and average syllable duration (in milliseconds). Average measured values and standard deviations for the prosodic measures for each speaker in both affective conditions (sincere and sarcastic) are given in Appendix B, Table B1.
Figure 1 above plots the means and standard errors of the means of f0 range, average syllable duration, and wiggliness, as well as the centered data points of each speaker in the sincerity and sarcasm conditions. The figure indicates that most speakers produce sarcasm with a higher average syllable duration (that is, with lower speech rate). This measure appears to be systematic across speakers, while f0 range and wiggliness show overlap and are quite variable. Regarding wiggliness, differences between the two affective conditions appear to be rather small for most speakers, and the direction of the difference is variable with reduced wiggliness in sarcasm for three speakers (P1, P3, P4), and greater wiggliness for two speakers (P7, P8). Sarcasm does not appear to be marked by wiggliness in the speech of the remaining speakers (P2, P5, P6). Similarly to wiggliness, there appears to be greater overlap between the two affective conditions in f0 range, and only four speakers maintain some distinction (see for example P1 and P5, who produce sarcasm with smaller and sincerity with higher f0 range, and P3 and P6 who show the opposite pattern). The standard errors of the mean overlap for the remaining speakers (P2, P4, P7, P8). It thus appears that two speakers (P1, P3) utilize all three measures, three speakers (P4, P7, P8) the measures of wiggliness and speech rate, two speakers (P5, P6) the measures of f0 range and speech rate, and one speaker (P2) speech rate only. Overall, for most speakers, sarcasm and sincerity appear to be most readily distinguishable in average syllable duration.
We employed Bayesian hierarchical modeling to statistically evaluate the distinctions. Model parameters confirm that average syllable duration is the most robust predictor of sarcasm across speakers, with an effect size of 0.09 (95% CI: 0.05, 0.13). Although wiggliness and f0 range both show slight negative correlations with sarcasm, both effects show 95% CIs that span above and below zero and thus we conclude that neither reliably predicts sarcasm (f0 range: –0.00, 95% CI: –0.01, 0.00; wiggliness: –0.01, 95% CI: –0.01, 0.00).
Turning to how each individual speaker utilizes the different prosodic features, Figure 2 below shows the fitted model broken down by speaker. For each speaker, higher average syllable duration (that is, lower speech rate) appears to correspond to sarcasm and lower average syllable duration (higher speech rate) to sincerity (Panel A). The strategies regarding wiggliness seem more variable (Panel B). In the speech of P1, P3, and P4, lower wiggliness appears to more likely correspond to sarcasm and higher wiggliness to sincerity. Less clear is the pattern for the remaining speakers, P2, P5, P6, P7, P8, who are not showing as strong a correspondence between wiggliness and the affect conditions. Finally, f0 range (Panel C) does not appear to correspond to sarcasm for most speakers, but some relation can be observed in the production of speaker P5, where lower f0 range seems to show some correspondence to sarcasm and higher f0 range to sincerity. Note that in the panels of both wiggliness and f0 range, the credibility intervals are quite wide, whereas for average syllable duration, they are considerably narrower.
Model-predicted regressions lines by speaker. On the y-axis is affect (1=sarcasm, 0=sincerity), and on the x axes are the phonetic measures.

In summarizing the results of the production study, we observe that speakers maintain differences in their production of sarcasm and sincerity from the outset of the utterance, specifically in the pre-target portion. Furthermore, individual differences seem to emerge in the utilization of measured prosodic features, with greater average syllable duration being the prominent feature associated with sarcastic speech.
3. Perception study
We next turn to a series of questions about how listeners make use of these acoustic cues in deriving sarcastic and sincere intent: [RQ3] Do listeners recognize sarcasm from the ‘pre-target’ part? [RQ4] Are different speakers recognized at similar rates? [RQ5] Is there a reliable difference in sarcasm recognition accuracy rates between individuals who did and individuals who did not self-identify as being on the autism spectrum? [RQ6] What prosodic features do listeners associate with sarcasm?
3.1 Methods
3.1.1 Perception study participants
Participants (n=123) were recruited primarily through online recruitment via Prolific (n=116). This recruitment occurred in two phases: first, participants were recruited from a filtered pool of individuals who indicated being on the autism spectrum in their self-determined Prolific profile, and second, from a filtered pool of those who did not indicate this. An additional seven participants who identified as being on the spectrum were recruited via an email flier distributed by an anonymous autism center. Participants were excluded from analyses due to providing incomplete data (n=13), choosing the same response throughout (n=1), and failing to complete the tasks in under 60 minutes (n=3).
At the end of the Qualtrics survey, all participants were asked if they self-identified as being on the autism spectrum; the question was phrased as follows: Do you identify as being on the autism spectrum? (You can skip this question if you prefer not to respond.) Participants were not asked to disclose whether or not they had a clinical diagnosis in the survey. Of those who were not excluded, 51 participants self-identified as being on the spectrum (henceforth ASC self-id group) and 44 identified as not being on the spectrum (henceforth no-ASC self-id group). 11 participants did not respond to the question and were excluded from all analyses.
After exclusions (n=28), analyses were conducted with the data of 95 participants. Five of these participants were recruited from the autism center and self-identified as being on the autism spectrum, and 90 were Prolific participants. According to their Prolific information, the 90 participants self-reported the following: clinical diagnosis n=16 (as an adult n=11, as a child n=5); seeking a diagnosis n=3; not diagnosed but self-identifies as being on the autism spectrum n=24, no known ASC and not seeking diagnosis n=47. In our analyses, however, we respected participants’ responses to the self-identification question (regarding it as the most up to date considering the subjective nature of self-identification) and grouped them accordingly, as described above.
In a brief questionnaire at the outset of the Qualtrics survey, participants were asked if they were over the age of 21, if they currently lived in the United States, if they spent most of their time before the age of 18 in the United States, and if they spoke English as their primary language. All participants fit these inclusion criteria. To gain more information about participants’ autistic traits independently of self-identification, all participants took the Autism Spectrum Quotient questionnaire (Baron-Cohen et al., Reference Baron-Cohen, Wheelwright, Skinner, Martin and Clubley2001), and following Broadbent, Galic, and Stokes (Reference Broadbent, Galic and Stokes2013) and Baron-Cohen et al. (Reference Baron-Cohen, Wheelwright, Skinner, Martin and Clubley2001), the suggested threshold of 29 was chosen to indicate the presence of considerable autistic traits as measured by the AQ. 45 participants scored at or above 29 (henceforth over threshold group), and 50 participants scored below the threshold (henceforth under threshold group). Within the ASC self-id group, twelve participants scored under the threshold (23.5%) and within the no-ASC self-id group, six participants scored above the threshold (13.6%). All participants were compensated for their time and effort (18.00 USD/h through Prolific or the same amount in Amazon Gift cards).
3.1.2 Perception study materials
The study comprised three parts: (i) a perception, (ii) a sarcasm check, and (iii) an AQ section.
(i) The listening material consisted of the sarcastic and sincere ‘pre-target’ utterance pairs (X is really quite a) from the eight speakers that were analyzed in the production study. Each speaker contributed 64 utterance fragments (32 sarcastic–sincere pairs), thus there were altogether 512 sound files (.wav extension). To reduce participant fatigue, the utterance fragments were grouped into eight lists of 64 utterances each. Each list included 16 fragments from four different speakers with eight sincere and eight sarcastic utterances per speaker. There was no overlap in the 16 utterances within or between speakers (that is, no speaker contributed sincere and sarcastic utterance pairs with the same original full wording and no list included the same token (same original full utterance) from different speakers). Thus, each participant listened to 64 utterance fragments from four speakers, and each token was heard by 12–15 listeners. The lists were randomized in Qualtrics in two ways: (1) participants were assigned to a random list (while being balanced in number among the lists), and (2) the utterance fragments within the lists were presented in a random order to participants. The structure of the lists is given in Appendix C, Table C1 and Table C2.
(ii) The sarcasm check established the sarcasm comprehension ability of each participant independent of their affective prosody perception abilities. This section consisted of ten context–comment pairs. The contexts were constructed such that they were conducive to either sarcasm or sincerity. The comments were identical in structure to the original full sentences that were recorded in the production study. See Appendix C for the materials. (Note that the first question was excluded from the analysis, as it included a typo that may have caused confusion among participants.)
(iii) The AQ section of the study included the Autism Quotient Questionnaire (Baron-Cohen et al., Reference Baron-Cohen, Wheelwright, Skinner, Martin and Clubley2001). The AQ comprises 50 statements which participants evaluated. Based on their self-assessment, participants indicated whether they ‘strongly agree’, ‘slightly agree’, ‘slightly disagree’, or ‘strongly disagree’ with each statement. The statements and response options were presented to participants unmodified, in blocks of ten.
3.1.2.1 Perception study stimuli validation
A pilot study was conducted in order to confirm that the stimuli are reliably identified as sarcastic.
Pilot Participants: Pilot participants were recruited online through Prolific. To make sure that the listening sessions were not excessively long, but each token was heard by at least five listeners, data was collected from 58 participants who were assigned to a random list of tokens (how the lists were assembled is explained in Appendix C, Table C1 and Table C2). Pilot participants were asked if they were over the age of 21, if they currently lived in the United States, if they spent most of their time before the age of 18 in the United States, and if they spoke English as their primary language. Nine pilot participants’ data was excluded from the statistical analysis, as the listeners either did not respond correctly to the attention check questions or gave conflicting information regarding their first language. 49 participants’ data was retained. Pilot participants were compensated for their time and effort (18.00 USD/h).
Pilot Materials: The pilot included the listening materials as described in Section 3.1.2; it did not include the sarcasm check and the AQ sections. Each token was heard by six to seven speakers.
Pilot Procedure: In a two-alternative forced-choice listening task, participants evaluated the utterances with respect to the attitude they perceived them to convey via an online speech perception survey. This pilot study was administered through Qualtrics. Participants were asked to use headphones twice (once on the Prolific listing of the study and once in the information sheet that detailed the study to participants). Each participant was assigned to a random list. Prior to the start of the survey, participants were familiarized with the format in a training session. In the survey, participants were presented with the recorded utterance fragments in blocks of eight. Each audio file within a block was clickable in embedded audio players, and participants could control the volume. Directly below each audio player a transcript of the file was included (e.g. Lynn is really quite a…). After listening to an utterance, participants were instructed to identify the conveyed attitude (either sincerity or sarcasm) by selecting the appropriate button corresponding to the affect. The task was worded in the following manner for each utterance fragment: ‘Listen to the audio, then decide whether the speaker sounded sincere or sarcastic to you.’ After listening to eight utterance fragments separately and completing the corresponding task, participants moved on to the next page (there were eight such pages, altogether 64 utterance fragments). The utterance fragments were randomized across the eight pages. The objective of this task was to reveal the degree to which participants are able to identify spoken sarcasm in isolation; that is, to see if participants recognize the attitude of encoders without context when only prosodic characteristics differentiate between utterances. To ensure that participants were paying attention, attention check questions were included. In these, participants were presented with a set of nouns (the sets were of varying cardinality) and were asked to pick out the noun in nth place (which varied by question) from the given multiple-choice options. For instance, if a set consisted of the words apple, orange, lemon, melon, papaya, and the question asked for the third word, the correct answer was lemon, which was to be picked out of the options given. As with the production study, the authors acknowledge possible concerns regarding the ecological validity of the perception task, as it is not naturalistic on at least two counts: (1) participants are asked to make a binary choice between sarcasm and sincerity (as opposed to the many possible interpretations in real life), and (2) they are asked to make this choice based on partial utterances. This, however, was unavoidable, given the research questions of the study.
Pilot statistical analysis: The pilot perception data were analyzed for average accuracy rate in sarcasm and sincerity recognition for all speakers taken together. Results indicate that most listeners could identify both sarcasm and sincerity above chance, although the sarcasm recognition rate was low and notably lower than that of sincerity (of the 49 listeners, only eight have higher accuracy rates for sarcasm.). As Figure 3 shows, participants’ average accuracy rate was 0.63 (SE=0.18) in the sarcasm condition and 0.82 (SE=0.18) in the sincerity condition.
Sarcasm and sincerity recognition rates. The large points correspond to the individual means; error bars indicate standard error of the mean.

Means of pilot listeners’ (n = 49) accuracy rates

To investigate if the difference is reliable, using the R Statistical Software (v4.2.1; R Core Team 2022), Bayesian hierarchical modeling was carried out with Accuracy as the dependent variable, and Affect as the independent variable (levels: sarcasm, sincerity), Pilot participant, Speaker, and Sentence type as random intercepts, along with random slopes for affect by Listener, Speaker, and Sentence type. Models were fitted using Stan (2.32.6) via the brms package in R with the same parameters specified in Section 2.1.5. Our results indicate that the observed difference is reliable with an effect size of 1.12 and a 95% CI spanning 0.07 to 2.22.
Table 3 reports the summary statistics of overall accuracy with listeners’ data aggregated and without taking speaker identities into account. 75% of the listeners’ accuracy rates for both sarcasm and sincerity were above chance level (sarcasm: above 0.56, sincerity: above 0.75). Mean accuracy for sarcasm was on the lower end of recognition rates reported in prior studies (Rutherford et al., Reference Rutherford, Baron-Cohen and Wheelwright2002; Voyer, Bowes, and Techentin, Reference Voyer, Bowes and Techentin2008; Voyer & Techentin, Reference Voyer and Techentin2010; Loevenbruck et al., Reference Loevenbruck, Jannet, d’Imperio, Spini and Champagne-Lavau2013; Braun & Schmiedel, Reference Braun and Schmiedel2018; Li et al., Reference Li, Gu, Liu and Tang2020); however, this is perhaps not surprising, as listeners were not presented with complete utterances. Based on these pilot observations, the stimuli were deemed acceptable for the perception study. As there is no consensus on what sarcastic prosody really is, and the acoustic analysis reports individual strategies (Figure 2) in addition to pooled ones, the decision was made to include speakers whose sarcasm is expressed potentially differently despite differences in perception.
3.1.3 Perception study procedure
Participants completed an online survey comprising three parts: (i) perception, (ii) a sarcasm check, and (iii) an AQ section. The experiment took 16 minutes to complete on average.
(i) Part 1, the perception task, was identical to the pilot task detailed above (two-alternative forced-choice). Each individual token was heard by 12–15 listeners, and each speaker was heard by 50–51 listeners overall.
(ii) In Part 2, participants were presented with ten sarcastic and sincere statements with supporting context, all in written form. The task was to judge whether the statement was sarcastic or sincere, given the context. Underneath each statement were two buttons with the two affect choices (sarcasm, sincerity) spelled out. To indicate their judgment, participants clicked on the appropriate button. All context–statement pairs were displayed on the same page.
(iii) Part 3 was the Autism Quotient Questionnaire. Questions were presented in blocks of ten in a Likert-type matrix format. Participants were asked to click on the appropriate answer based on their self-assessment.
3.1.4 Perception study statistical analysis
The perception data was analyzed in the following aspects: (1) overall recognition rate with all speakers conflated, (2) accuracy rate of each individual speaker (recognition rate by speaker), and (3) recognition rate by listeners’ autism spectrum self-identification. An additional analysis was conducted by listener groups based on AQ scores (i.e. whether a participant scored at and above or below 29 on the AQ); this analysis yielded qualitatively similar results to that by self-identified ASC status, as discussed below. The data were analyzed via Bayesian hierarchical modeling with ASC self-identification group, Affect, and the interaction of ASC self-identification group (levels: ASC self-id, no-ASC self-id) and Affect (levels: sarcasm, sincerity) as predictor variables and Perception accuracy as the dependent variable (the auxiliary analysis replaced ASC self-identification group with AQ-based group). Listener, Speaker, and Sentence type were included in both models as random intercepts, along with random slopes for affect by Listener, Speaker, and Sentence type, and for ASC group by Speaker and Sentence type. Models were fitted using Stan (2.32.6) via the brms package in R; fixed effect priors were set to $\mathcal{N}$
(0, 1) for the Intercept and
$\mathcal{N}$
(0, 1) for the Intercept and $\mathcal{N}$
(0, 3) other regression coefficients, the random variance prior was set to Exp(1) and all other priors were set to the brms defaults; 4,000 samples were taken from four MCMC chains (following 1,000 warm-up samples per chain). As there were no qualitative differences in the results between the two kinds of listener groupings (self-identification based and AQ-score-based), the main text reports results for the groups that are formed based on self-identification. For the groups formed based on participants’ AQ-scores, results are given in Appendix F.
$\mathcal{N}$
(0, 3) other regression coefficients, the random variance prior was set to Exp(1) and all other priors were set to the brms defaults; 4,000 samples were taken from four MCMC chains (following 1,000 warm-up samples per chain). As there were no qualitative differences in the results between the two kinds of listener groupings (self-identification based and AQ-score-based), the main text reports results for the groups that are formed based on self-identification. For the groups formed based on participants’ AQ-scores, results are given in Appendix F.
The prosodic feature associations of the listeners are reported for the groups based on autism spectrum self-identification. These data were analyzed via Bayesian hierarchical modeling with Average syllable duration, f0 range, and Wiggliness as predictor variables and Affect choice (levels: sarcasm, sincerity) as the dependent variable. Listener, Speaker, and Sentence type were included in the model as random intercepts, along with random slopes for the predictor measures by Listener, Speaker, and Sentence type. Models were fitted using Stan (2.32.6) via the brms package in R with the same parameters specified in Section 2.1.5.
Statistical analyses were carried out in R (v4.2.1; R Core Team, 2022). R packages used were bayesplot (Gabry & Mahr, Reference Gabry and Mahr2024), brms (Bürkner, Paul-Christian, Reference Bürkner2017), brmstools (Vuorre, Reference Vuorre2018), data.table (Barrett et al., Reference Barrett, Dowle, Srinivasan, Gorecki, Chirico and Hocking2024), devtools (Wickham et al., Reference Wickham, Hester, Chang and Bryan2022), dplyr (Wickham et al., Reference Wickham, François, Henry, Müller and Vaughan2023), forcats (Wickham, Reference Wickham2023), ggplot2 (Wickham, Reference Wickham2016), stan (Stan Development Team, 2024), rstanarm (Goodrich et al., Reference Goodrich, Gabry, Ali and Brilleman2024), seriation (Hahsler et al., Reference Hahsler, Buchta and Hornik2024), stringr (Wickham, Reference Wickham2022), tidybayes (Kay, Reference Kay2023), tidyr (Wickham et al., Reference Wickham, François, Henry, Müller and Vaughan2023), and tidyverse (Wickham et al., Reference Wickham, Averick, Bryan, Chang, McGowan, François, Grolemund, Hayes, Henry, Hester, Kuhn, Pedersen, Miller, Bache, Müller, Ooms, Robinson, Seidel, Spinu, Takahashi, Vaughan, Wilke, Woo and Yutani2019).
3.2 Perception study results
This study asks [RQ3] if listeners can recognize sarcasm from the pre-target portion of an utterance (X is really quite a…), [RQ4] if different speakers are recognized at similar rates, [RQ5] if there is a reliable difference in sarcasm recognition accuracy rates between individuals who did and individuals who did not self-identify as being on the autism spectrum, and [RQ6] what prosodic features listeners associate with sarcasm.
To ascertain that participants understand the concept of sarcasm, a task to measure written sarcasm perception accuracy when utterances are presented with supporting context was included. Mean sarcasm accuracy is 0.98 (SE = 0.01) in the ASC self-id group, and 0.96 (SE = 0.01) in the no-ASC self-id group. Welch’s two-sample t-test indicates that the difference is not statistically significant (t(80.2) = 1.16, p = .25). Mean sincerity accuracy is 0.95 (SE = 0.01) in the ASC self-id group, and 0.995 (SE = 0.005) in the no-ASC self-id group. Welch’s two-sample t-test indicates that the difference is statistically significant (t(62.1) = –2.81, p < .05). As the difference in the sarcasm condition is not statistically significant, and both groups perform above chance level in both conditions, we conclude that participants understand the concept of sarcasm.
3.2.1 Sarcasm perception in individuals who did and individuals who did not self-identify as being on the autism spectrum
3.2.1.1 Sarcasm recognition rates (RQ3 and RQ5)
Overall affect recognition accuracy (RQ3): Results show that participants are able to reliably recognize both sincerity and sarcasm in these auditory sentence fragments, but they are more accurate in recognizing the former. Overall accuracy rates are .62 (SE = 0.016) for sarcasm and .84 (SE = 0.013) for sincerity (see Appendix D, Table D1 for the summary statistics). These observations are supported by the results of the Bayesian hierarchical modeling, where accuracy is reliably predicted to be lower in the sarcasm condition with an effect size of –1.18 (CI: –2.19, –0.23).
Accuracy rates for the ASC self-id and no-ASC self-id groups (RQ5): Figure 4 shows that the mean accuracies across the groups are above chance and similar across ASC groups for both affective conditions, but more variation can be observed in the ASC self-id group. The summary statistics of the accuracy rates for the self-identification groups are given in Appendix D, Table D1. Participants’ sarcasm recognition accuracy in the ASC self-id group is .6 (SE = 0.024) and it is .66 (SE = 0.021) in the no-ASC self-id group. Note though that there is a trend for more individuals in the ASC self-id group in the sarcasm condition to perform at or below chance level than in the no-ASC self-id group (ASC self-id: 33%, no-ASC self-id: 14%). As for sincerity, the groups perform similarly at 84% (ASC self-id SE = 0.019, no-ASC self-id SE = 0.017) accuracy. These observations are supported by the results of the Bayesian hierarchical modeling, which show that self-identification-based ASC grouping does not reliably predict accuracy rates. In sum, we find that participants can recognize sarcasm in the pre-target utterance fragments, and recognition accuracy does not appear to be modulated by self-identified ASC condition. Individual accuracy rates are given in Appendix E, Table E1.
Accuracy for sarcasm and sincerity by self-identified ASC grouping. The large points correspond to the group means; error bars indicate standard error of the mean.

Affect recognition accuracy by ASC diagnosis as reported by Prolific participants.

Due to the variable accuracy observed across participants, we examined accuracy rates broken down by diagnosis condition for listeners recruited through Prolific. Since the recruitment process was not designed with this specific aim in mind, the possibility for conducting a comprehensive statistical analysis is consequently constrained. In Figure 5 above, participants are grouped into the following categories based on their Prolific data: (1) self-identifies as not being on the spectrum and has no official diagnosis (‘no diagnosis, self-id: no’); (2) self-identifies as being on the spectrum but received no diagnosis (‘no diagnosis, self-id: yes’); (3) was diagnosed as an adult (‘diagnosed (as adult)’); (4) was diagnosed as a child (‘diagnosed (as child)’); was diagnosed but shared no age range (‘diagnosed (no data when)’); and (5) participants who self-identified as being on the spectrum and are seeking a diagnosis (‘no diagnosis – seeking’). Participants’ accuracy rates appear to be rather similar in the sincerity condition. In the sarcasm condition, however, there is a notable difference between (1) the groups of participants diagnosed as children versus as adults and (2) participants diagnosed as adults on the one hand and participants who are undiagnosed and who did not report seeking a diagnosis on the other hand. The present figure is meant to serve solely as a preliminary exploration of potential differences, as due to the imbalance between groups with respect to the number of participants, statistical analysis is not possible. These differences might be worth exploring in a larger study.
3.2.1.2 Are different speakers recognized at similar rates? (RQ4)
Next, we examined how perception accuracy may vary across the set of eight speakers. Figure 6 plots mean accuracy (black points) as well as the predicted estimates of the Bayesian model for each speaker in the two affect conditions given the two self-identification-based ASC groups (colored error bars). Mean accuracy results show variability in how well individual speakers’ intended affect is recognized, particularly in the sarcasm condition. Rate of recognition in the sarcasm condition is below chance for three speakers (P3, P5, and P6), but for the remaining five speakers, affect recognition is above chance in both conditions. For the by-speaker values conflated by listener group, see Appendix D, Table D2. There appear to be no differences in how well each speaker is perceived in the two listener groups; see Appendix D, Table D3 for the by-speaker means, separated by listener group.
Affect recognition accuracy by speaker and self-identified ASC grouping. Black points indicate grand-average accuracy while colored points and error bars indicate posterior mean and 95% CI per speaker.

3.2.2 Prosodic features in perception (RQ6)
Next, we examined how listeners utilize prosodic features in sarcasm perception. Note, importantly, that this analysis does not test accuracy; rather, it evaluates which acoustic features were more likely to be perceived as sarcastic by the listener (regardless of speaker intent). Bayesian hierarchical modeling indicates that it is only average syllable duration (our measure for speech rate) that reliably predicts affect choice with an effect size of 0.04 and a 95% CI that excludes zero (0.03, 0.05). The effect for f0 range is very close to zero (–0.00, 95% CI = –0.00, 0.00) and the effect for wiggliness, while negative, has a wide CI that spans below and above zero (–0.13, 95% CI = –0.30, 0.04). The results thus suggest that speech rate is the most reliable cue to sarcasm among the measured prosodic features.
4. Discussion
The goal of the present study was to answer questions about the production and perception of sarcasm. In terms of production, the questions were whether speakers use prosody to mark sarcasm already in an early, five-syllable ‘pre-target’ portion of an utterance, before a ‘target’ word that is most closely associated with sarcastic intent is produced, and whether individuals vary in the prosodic features they associate with sarcasm at this stage (with one of the features of interest being wiggliness following Wehrle et al. (Reference Wehrle, Cangemi, Krüger and Grice2018) and Wehrle (Reference Wehrle2022, Reference Wehrle2023)). In terms of perception, the study asked whether listeners can recognize sarcasm from the ‘pre-target’ part only, whether listener accuracy varies by speaker, and self-identified autism condition or Autism Spectrum Quotient score (Baron-Cohen et al., Reference Baron-Cohen, Wheelwright, Skinner, Martin and Clubley2001). The study also investigates what prosodic features listeners associate with sarcasm when given a binary choice between sarcasm and sincerity.
4.1 Production: speakers’ prosodic strategies
Prosody has been suggested to be one of the cues to sarcasm, and the present study’s production results showed that most speakers do indeed systematically distinguish sarcasm and sincerity even quite early on in the utterances.
We examined speech rate (quantified as average syllable duration in milliseconds), f0 range, and wiggliness. With respect to speech rate, there were robust differences in the identically worded pre-target utterance fragments for all speakers on this dimension with speakers using a slower speech rate to mark sarcasm. Regarding f0 range and wiggliness, we found that speakers utilize them in different ways (see Figure 1 and the per-speaker summary statistics in Appendix B). Statistical modeling indicated that, of the three measures, speech rate is the only reliable predictor of sarcasm at the group level. The three measures are discussed below in turn.
4.1.1 Speech rate
A numerical difference was found in average syllable duration between the two conditions, with sarcasm being spoken more slowly in each speaker’s production. The difference in speech rate was shown to be reliable for all eight speakers: slower speech rate is a robust predictor of sarcasm. This finding accords with most previous studies (Rockwell, Reference Rockwell2000; Cheang & Pell, Reference Cheang and Pell2008, Reference Cheang and Pell2009; Bryant, Reference Bryant2010; Scharrer & Christmann, Reference Scharrer and Christmann2011; Loevenbruck et al., Reference Loevenbruck, Jannet, d’Imperio, Spini and Champagne-Lavau2013; Niebuhr, Reference Niebuhr2014; González-Fuente et al., Reference González-Fuente, Escandell-Vidal and Prieto2015; González-Fuente et al., Reference González-Fuente, Prieto, Noveck, Barnes, Brugos, Shattuck-Hufnagel and Veilleux2016; Mauchand et al., Reference Mauchand, Vergis and Pell2018; Chen & Boves, Reference Chen and Boves2018; Mauchand et al., Reference Mauchand, Vergis and Pell2020; Jansen & Chen, Reference Jansen and Chen2020), with the exception of Kumwapee & Jitwiriyanont (Reference Kumwapee and Jitwiriyanont2020).
4.1.2 F0 range
Only a few of the speakers maintained a distinction between sincerity and sarcasm on the f0 range dimension, and the direction of the difference varied as well with f0 range being greater in some speakers’ sarcastic speech and smaller in others’. Statistical modeling does not indicate f0 range in either direction to be a reliable predictor of sarcasm at the group level. This result is perhaps unsurprising, given the individual variability in the present study, as well as reports in prior studies where the direction of change – where substantial – is not uniform. Some report on larger f0 range in sarcasm (for instance, Jansen & Chen (Reference Jansen and Chen2020) for Dutch, Gonzáles-Fuente et al. (Reference González-Fuente, Prieto, Noveck, Barnes, Brugos, Shattuck-Hufnagel and Veilleux2016) for French, and Anolli et al. (Reference Anolli, Ciceri and Infantino2002) for Italian), while others report reduced f0 range (Niebuhr (Reference Niebuhr2014) for German, Cheang & Pell (Reference Cheang and Pell2009) for Cantonese). However, considering studies that examined sarcasm in different varieties of English (American English in Bryant & Fox Tree (Reference Bryant and Fox Tree2005), British English in Chen & Boves (Reference Chen and Boves2018), and Canadian English in Mauchand et al. (Reference Mauchand, Vergis and Pell2018, Reference Mauchand, Vergis and Pell2020) and Cheang & Pell (Reference Cheang and Pell2008)) and found reduced f0 range, it is important to emphasize that such a clear pattern did not emerge in the present study. Conceivably, this difference could have arisen due to the genre of speech examined (radio talk, exchange between acquaintances, context–target sentences individually recorded), speaker identity (actors, public speakers, radio hosts, and individuals without such training or experience), and types of sarcasm elicited (deadpan versus exaggerated sarcasm, for example).
4.1.3 Wiggliness
Previous studies proposed that (some varieties of) sarcasm may be spoken with a ‘flat affect’ (Rockwell, Reference Rockwell2000; Attardo et al., Reference Attardo, Eisterhold, Hay and Poggi2003; Bryant & Fox Tree, Reference Bryant and Fox Tree2005; Cheang & Pell, Reference Cheang and Pell2008, Reference Cheang and Pell2009; Rakov & Rosenberg, Reference Rakov and Rosenberg2013; Niebuhr, Reference Niebuhr2014; Chen & Boves, Reference Chen and Boves2018; Braun & Schmiedel, Reference Braun and Schmiedel2018; Leykum, Reference Leykum2020), but their observations were based on either reduced f0 range or smaller standard deviation around the f0 mean, which alone are not equal to having flat affect. Understanding ‘flat’ as having fewer shifts in f0 direction (high to low, low to high), the present study is first to apply the method developed in Wehrle et al. (Reference Wehrle, Cangemi, Krüger and Grice2018) and Wehrle (Reference Wehrle2022, Reference Wehrle2023) to sarcastic speech. The raw data showed that wiggliness was smaller in sarcasm for three of the eight participants, approximately equal for three further participants, and greater in sarcasm for two participants. These results warrant further study into the usefulness of the metric in differentiating between (carefully targeted) deadpan and exaggerated sarcasm types, wherein the former may be produced with reduced and the latter with increased wiggliness and spaciousness (a metric of the magnitude of f0 movements, averaging the two greatest movements in a given unit of interest (Wehrle et al., Reference Wehrle, Cangemi, Krüger and Grice2018; Wehrle, Reference Wehrle2022, Reference Wehrle2023)). Regarding the present data, however, statistical analysis showed that although there are indications of variability in individual speakers’ strategies and wiggliness shows a slight negative correlation with sarcasm, it is not a reliable predictor overall in the pre-target region on the utterances. Granting individual variation, it may be the case that the type of f0 variability measured by wiggliness is better analyzed for sarcastic affect as unfolding over an entire utterance (see Tatár et al., Reference Tatár, Brennan, Krivokapić and Keshet2024 for such an analysis).
While it is difficult to evaluate whether speakers use substantially different prosodic strategies in the pre-target region with a small sample size of eight speakers (and as noted in the methods, due to the gender and age balance of the participants, dimensions of variation related to these factors are not examined here), visual inspection of the plotted data and the model-predicted estimates suggest that (1) all speakers have a slower speech rate in sarcastic speech, and (2) speakers vary in whether and in what way they employ f0. The results are, in essence, consistent with most prior studies regarding speech rate and f0 range in that the former is consistently reported as slower in sarcasm, and the latter is reported as either higher or lower in different contexts. Wiggliness results cannot be directly compared to previous research on sarcasm. Note however, that although the metric was designed for longer utterances (Wehrle et al., Reference Wehrle, Cangemi, Krüger and Grice2018; Wehrle, Reference Wehrle2022, Reference Wehrle2023) and may be more meaningfully applied as such, the present results demonstrate that wiggliness can be employed to examine shorter utterance fragments as well. A drawback of the present study is the limited number of metrics included: a more complete picture of pre-target prosody may emerge in future research with the inclusion of voice quality measures, as well as intensity.
4.2 Perception
4.2.1 Do listeners recognize sarcasm from ‘pre-target’ prosody only?
‘Pre-target’ region: Although numerous studies report on the prosodic characteristics of sarcastic speech (Rockwell, Reference Rockwell2000; Anolli et al., Reference Anolli, Ciceri and Infantino2002; Bryant & Fox Tree, Reference Bryant and Fox Tree2005; Voyer, Bowes, & Techentin, Reference Voyer, Bowes and Techentin2008; Cheang & Pell, Reference Cheang and Pell2008, Reference Cheang and Pell2009; Bryant, Reference Bryant2010; Scharrer & Christmann, Reference Scharrer and Christmann2011; Loevenbruck et al., Reference Loevenbruck, Jannet, d’Imperio, Spini and Champagne-Lavau2013; Niebuhr, Reference Niebuhr2014; González-Fuente et al., Reference González-Fuente, Escandell-Vidal and Prieto2015; González-Fuente et al., Reference González-Fuente, Prieto, Noveck, Barnes, Brugos, Shattuck-Hufnagel and Veilleux2016; Mauchand et al., Reference Mauchand, Vergis and Pell2018; Chen & Boves, Reference Chen and Boves2018; Braun & Schmiedel, Reference Braun and Schmiedel2018; Mauchand et al., Reference Mauchand, Vergis and Pell2020; Kumwapee & Jitwiriyanont, Reference Kumwapee and Jitwiriyanont2020; Li et al., Reference Li, Gu, Liu and Tang2020; Jansen & Chen, Reference Jansen and Chen2020), no previous study reports on the prosodic characteristics of ‘pre-target’ (or its equivalent) fragments in particular. Despite speaker variation, the overall results of our production study support the hypothesis that there is indeed enough information a listener can use already in the pre-target region.
Overall sarcasm recognition accuracy: The present study tested whether listeners recognize sarcasm from an early, five-syllable ‘pre-target’ portion of an utterance in a two-alternative forced-choice perception task. Our data showed that the majority of listeners could identify sarcasm from the fragments (62%), but there was much variation in how well each participant perceived sarcasm. In comparison, sincerity recognition accuracy was higher on average (84%), and variation among listeners was smaller. Perhaps unsurprisingly, as listeners did not hear complete utterances, the average rate of accuracy is on the lower end of recognition rates reported in previous studies (Rutherford et al., Reference Rutherford, Baron-Cohen and Wheelwright2002; Voyer, Bowes, and Techentin, Reference Voyer, Bowes and Techentin2008; Voyer & Techentin, Reference Voyer and Techentin2010; Loevenbruck et al., Reference Loevenbruck, Jannet, d’Imperio, Spini and Champagne-Lavau2013; Braun & Schmiedel, Reference Braun and Schmiedel2018; Li et al., Reference Li, Gu, Liu and Tang2020).
Recognition accuracy by speaker: We further tested whether sarcasm was recognized at a similar rate from each speaker’s production. There was a considerable difference in how well individual speakers were perceived, with rates of recognition ranging from an average of 35% to 84% in sarcasm and 70% to 92% in sincerity for different speakers. As five of the eight speakers were perceived correctly above chance in both affective conditions, however, the results overall support earlier findings from Mauchand et al. (Reference Mauchand, Caballero, Jiang and Pell2021).
Note, however, that in comparing the prosodic marking strategies of the speakers with how well their affect was perceived, we do not find a readily discernible pattern. Inasmuch as all speakers employed speech rate in marking sarcasm and speech rate was a relevant factor in perception, all speakers could have been perceived at similar rates, but that is not what the results show. Furthermore, the additional relevance of wiggliness and/or f0 range in a few of the speakers’ speech does not appear to fully explain the differences in perception (and wiggliness and f0 range were not good predictors of sarcastic choice at the group level). Two speakers, P1 and P3 appeared to mark sarcasm with all three measures, yet while P1 had a perception rate of 84% for sarcasm, P3’s was only 50%. P2, on the other hand, marked sarcasm with speech rate only (of the measured acoustic properties, that is), yet had a sarcasm perception rate of 77%, which is above the average 62%. The remaining five speakers (with their average sarcasm perception rates given in parentheses), each seem to mark sarcasm with speech rate and one of the f0 variability measures: P4 (63%), P7 (74%), and P8 (69%) with speech rate and wiggliness, and P5 (35%) and P6 (47%) with speech rate and f0 range. In addition to speech rate, wiggliness, although it did not emerge as a reliable predictor of sarcasm perception accuracy at the group level, may co-occur either with better perception, or with a measure that is reliable in sarcasm perception. It does appear that generally the presence of multiple cues improves perception (as was reported in González-Fuente et al. (Reference González-Fuente, Prieto, Noveck, Barnes, Brugos, Shattuck-Hufnagel and Veilleux2016) and Peters et al. (Reference Peters, Wilson, Boiteau, Gelormini-Lezama and Almor2016)), however, as we did not directly examine the effect of the number of cues, we cannot make firm conclusions about the added utility of wiggliness in perception. Further, given the limited number of metrics included in the present study, we cannot say with certainty if greater accuracy rate is a corollary of marking sarcasm with wiggliness, or if it is rooted in the presence of other phonetic correlates of sarcasm not measured in the present study. Therefore, further metrics, such as those related to intensity and voice quality ought to be examined in the future as they relate to sarcasm production and recognition in the utterance region of concern in the present study.
Recognition accuracy by self-identification-based ASC grouping: We asked if there was a reliable difference in recognition rates between listeners who self-identify as being on the autism spectrum (ASC self-id n = 51) and listeners who do not (no-ASC self-id n = 44). There was no statistically reliable difference in accuracy rates between the groups in either affect condition. Our study thus differs from previous reports (e.g. Happé, Reference Happé1993; Martin & McDonald, Reference Martin and McDonald2004; Mathersul et al., Reference Mathersul, McDonald and Rushby2013; Nuber et al., Reference Nuber, Jacob, Kreifelts, Martinelli and Wildgruber2018; Deliens et al., Reference Deliens, Papastamou, Ruytenbeek, Geelhand and Kissine2018; Braun, Schulz, & Schmiedel, Reference Braun, Schulz, Schmiedel, Calhoun, Escudero, Tabain and Warren2019) in that listeners do not differ in sarcasm recognition in relation to whether they self-identify as being on the spectrum or not. The results of the present study do suggest that there is considerable variation between individuals (not only in the ASC self-id group, but also in the no-ASC self-id group). This variation, however, was not found to be related to participants’ AQ scores, suggesting that the presence of autistic traits, as measured either by the Autism Spectrum Quotient or by self-identification, do not capture the variation in sarcasm recognition rate (see Appendix F). Given the amount of variation found, the results further underscore the importance of having larger sample sizes in studies designed to test or compare aspects of cognition in individuals with and without autistic traits (this is presumed to hold regardless of self-identification).
A potential limitation of the study arises from the recruiting process: as listeners were recruited online, via Prolific, the potential pool of participants was restricted to those who were signed up on Prolific (excepting the participants who were recruited online via an autism center). Group differences may have been present had only participants with a confirmed clinical diagnosis been recruited (rather than participants who identified themselves as being on the autism spectrum), and it cannot be claimed that the present results generalize to clinical populations. Further consideration may be given to the modality of the task: our stimuli were presented online rather than in person. Although this choice introduces a level of uncertainty regarding participants’ attention (a concern we addressed via attention-check questions throughout the perception task) and environmental control, removing a social variable could allow for a higher level of comfort for any participant experiencing social discomfort. (Note, however, that in our case, this is a strictly speculated factor, as we did not measure social anxiety or discomfort levels in our participants. See Spain et al. (Reference Spain, Sin, Linder, McMahon and Happé2018) on social anxiety in individuals on the spectrum.)
Additional limitations arise from the drawbacks associated with the specific perception task we employed. The stimuli were not presented to the participants in a conversational context and the task (1) required participants to choose between two alternatives only (whereas in real-life communication, there are no such limitations), and (2) it did not require a within-task conversational response. These concerns regarding ecological validity restrict the interpretation of the study’s results: we cannot claim that our listeners identify sarcasm from such pre-target regions in real life with the same degree of success as they do in the present study. Such limitations potentially explain the difference between reported difficulties with sarcasm in real life and the isolated question of the role of prosodic cues in our forced choice task. Albeit a concern, in this regard, our study is not unique as others have employed similar tasks and nevertheless found group differences (Happé, Reference Happé1993; Martin & McDonald, Reference Martin and McDonald2004; Mathersul et al., Reference Mathersul, McDonald and Rushby2013; Nuber et al., Reference Nuber, Jacob, Kreifelts, Martinelli and Wildgruber2018; Deliens et al., Reference Deliens, Papastamou, Ruytenbeek, Geelhand and Kissine2018).
4.2.2 Listener strategies
The study further examined what prosodic features listeners associate with sarcasm when given a binary choice between sarcasm and sincerity. The cue used most prominently appears to be related to speech rate, as listeners interpreted longer average syllable duration as sarcastic. This aligns closely with the reliability of this cue in the production data. The results regarding speech rate thus corroborate the findings of Augert (2022), Mauchand et al. (Reference Mauchand, Vergis and Pell2018), and González-Fuente et al. (Reference González-Fuente, Prieto, Noveck, Barnes, Brugos, Shattuck-Hufnagel and Veilleux2016), who report reduced speech rate to correspond with sarcasm in perception. In the present study, f0 range and wiggliness did not reliably predict listener choice. Similarly to these results, González-Fuente et al. (Reference González-Fuente, Prieto, Noveck, Barnes, Brugos, Shattuck-Hufnagel and Veilleux2016) find range differences to be relatively less important in judging verbal irony (in French). Our group level findings are in contrast with Mauchand et al. (Reference Mauchand, Vergis and Pell2018), Glenwright et al. (Reference Glenwright, Parackel, Cheung and Nilsen2014), and Voyer et al. (Reference Voyer, Bowes and Techentin2008) who find f0 variability to be a salient perceptual cue to sarcasm, but our individual speaker production and perception accuracy results regarding the potential role of wiggliness may warrant further study. Given the complexity of prosody in sarcasm, it remains to be explored how certain cues relate to each other’s perceptual salience; i.e. whether the unavailability of a salient cues (e.g. speech rate) can modulate the prominence of other cues (e.g. intonational ones) in sarcasm perception.
5. Conclusion
The present study explored the early prosodic marking of sarcasm and how it is perceived in individuals with and without autistic traits (self-reported ASC or inferred from AQ scores).
Our production results showed that most speakers systematically distinguished sarcasm and sincerity in ‘pre-target’ utterance fragments, that is, before the lexical item most closely associated with sarcasm was reached in their production. All speakers marked sarcasm by slower speech rate, but they varied on the extent to which they utilized the measured f0 related features.
Our perception results showed that the majority of listeners recognized sarcasm quite early on in the utterance, that is, from the short stretch of the ‘pre-target’ utterances. Despite overall accuracy, there was much variation in how well each listener perceived sarcasm. This variation however was not modulated by group membership; that is, variability was found in both self-identification-based groups, as well as in the AQ-score-based groups. With respect to levels of perception accuracy by speaker, we found considerable variation as well, but the majority of speakers were perceived above chance level on average in both affective conditions. Thus, variability notwithstanding, we may conclude that there is sufficient prosodic information in the pre-target regions of most speakers for most listeners.
Overall, the present study provides further support for the proposed context-setting role of ‘pre-target’ prosody in sarcasm (as assumed in Mauchand et al., Reference Mauchand, Caballero, Jiang and Pell2021) and suggests that phonetic correlates of prosody in the early part of an utterance are communicatively relevant for listeners who do and listeners who do not self-identify as being on the autism spectrum and for listeners with varying levels of autistic traits, as inferred from AQ scores.
Appendix A
Prosody production stimuli (sample).
Sample production stimuli

Appendix B
Prosody production data.
Summary statistics of speakers’ production data

Appendix C
Perception materials.
Utterance lists keyed by positive adjectives (e.g., brainy stands for Lynn’s really quite a brainy kid, of which the pre-target portion was analyzed, i.e. Lynn’s really quite a)

The structure of the perception study lists. Shaded cells indicate that no item from the participant was included in the corresponding list

The letters code eight utterance fragments each, with A, C, E, and G coding sarcastic utterances, and B, D, F, and H coding the sincere ones. A-B, C-D, E-F, and G-H are identically worded pairwise (see Table C1).
Sarcasm-check questions:
-
1. [N.B. This question was excluded from the analysis due to potentially confusing typo.] Your dog, Buddy, eats part of your brother’s diorama. (Buddy is fine.) The diorama is due tomorrow and counts for 50% of your brother’s grade. He is unfazed. You say to him: He’s a really mellow kid. [sarcastic]
You were being…
-
(a) sarcastic
-
(b) sincere
-
-
2. You and your work team have been trying to solve an issue for hours. The same ideas keep coming back, and when a colleague suggests something that has been considered and rejected many times, you say: That’s a really novel idea. [sarcastic]
-
3. Your friend, Brian, is known to follow every rule at all times; he would never run a red light or turn in homework late for fear of punishment. As you and Brian are walking to class together, Brian proudly tells you that he jaywalked on campus the other day. You say: You’re a really daring man. [sarcastic]
-
4. You are talking to a friend called Jane. She is a lawyer, and she has recently won a big case by confusing the suspect during cross-examination. You say to Jane: You’re a really cunning one. [sincere]
-
5. Your little sister is trying to stick a pretzel up her nose. You say to her: You’re a really brainy kid. [sarcastic]
-
6. It is August, and you are on vacation in Spain. On the first morning of your stay, there’s a thunderstorm going on. You say: It’s a really lovely day. [sarcastic]
-
7. Your friend is organizing a protest on campus to raise awareness about the unfair practice of conducting experiments on animals. You say: That’s a really noble cause. [sincere]
-
8. You and your friend are going to the movies. He wants to see “Extremely Wicked, Shockingly Evil, and Vile”, a movie about serial killer Ted Bundy. You say: That’s a really wholesome movie. [sarcastic]
-
9. Your friend has been really into knitting lately, and he is not half bad. When he gifts you a sweater he made, you say: That’s a really well-made sweater. [sincere]
-
10. You’ve been training your dog, Nell, for a competition that requires the fast and accurate completion of different tasks. She does really well in the competition. You say to your mom: She’s a really nimble girl. [sincere]
Appendix D
Perception study affect recognition rates.
Recognition rates by listener group given in percentage

Recognition rates by speaker given in percentage, with the listener groups conflated

Recognition rates by speaker given in percentage, separated by listener group

Appendix E
Affect recognition accuracy scores.
Individual affect recognition accuracy scores

Appendix F
Results of listeners grouped by Autism Quotient (AQ) Questionnaire scores.
Accuracy rate by speaker and AQ grouping (black points indicate grand-average accuracy while colored points and error bars indicate posterior mean and 95% CI per speaker).

F1. Sarcasm-check questions
With listeners grouped by AQ score, the accuracy rate of the under threshold group was 0.96 (SE = 0.008), and the over threshold group’s accuracy rate was 0.97 (SE = 0.013) in the sarcasm condition. Results of Welch’s t-test indicate that the difference is not statistically significant (t(72) = 1.28, p = 0.2). In the sincerity condition, the average accuracy rate in the under threshold group was 0.98 (SE = 0.013), and in the over threshold group, it was 0.96 (SE = 0.012). Results of Welch’s t-test again indicate that the difference is not statistically significant (t(92.8) = –0.69, p = 0.49).
F2. [RQ4] Are different speakers recognized at similar rates?
By-speaker accuracy rates vary greatly, particularly in the sarcasm condition. When listeners are grouped by AQ score, accuracy rates in the over threshold group range from 30% to 86% in the sarcasm condition, and from 71% to 97% in the sincerity condition. In the under threshold group, sarcasm accuracy rates are between 41% and 83%, and sincerity accuracy rates are between 69% and 89%. Figure F1 above plots by-speaker mean accuracy as well as the predicted estimates of the Bayesian model in the two affect conditions given the two AQ groups. For the accuracy rates for each speaker, see Appendix D, Table D3.
F5. [RQ5] Is there a reliable difference in sarcasm recognition accuracy rates between individuals who score below versus individuals who score above the threshold on the AQ?
The summary statistics of the accuracy rates for the AQ-based groups are given in Appendix D, Table D1. Figure F2 above plots the accuracies by AQ group. In the sarcasm condition, more individuals in the over threshold group perform at or below chance level than individuals in the under threshold (over threshold: 31%, under threshold: 18%). With respect to mean values, however, participants’ sarcasm recognition accuracy is 0.61 (SE = 0.03) in the over threshold group and it is 0.64 (SE = 0.02) in the under threshold group. As for sincerity, the AQ-based groups perform similarly with 0.85 (SE = 0.02) mean accuracy in the over threshold group and 0.83 (SE = 0.02) in the under threshold group.
Accuracy for sarcasm and sincerity by AQ grouping (over threshold, under threshold). The large points correspond to the group means, error bars indicate standard error of the mean.

Both groups thus appear to similarly perform better in sincerity than sarcasm accuracy. These observations are supported by the results of the Bayesian hierarchical modeling, which show that (1) sarcasm affect condition reliably predicts lower accuracy rates as the effect shows 95% CIs that do not cross zero (Affect = –1.48; 95% CI = –2.48, –0.50), and (2) AQ-score based grouping does not reliably predict accuracy rates as the effect shows 95% CI that spans above and below zero (AQ = –0.10, 95% CI = –0.54, 0.34).

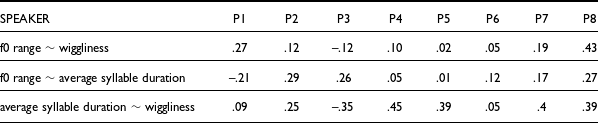


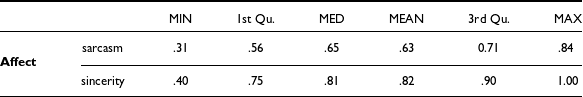


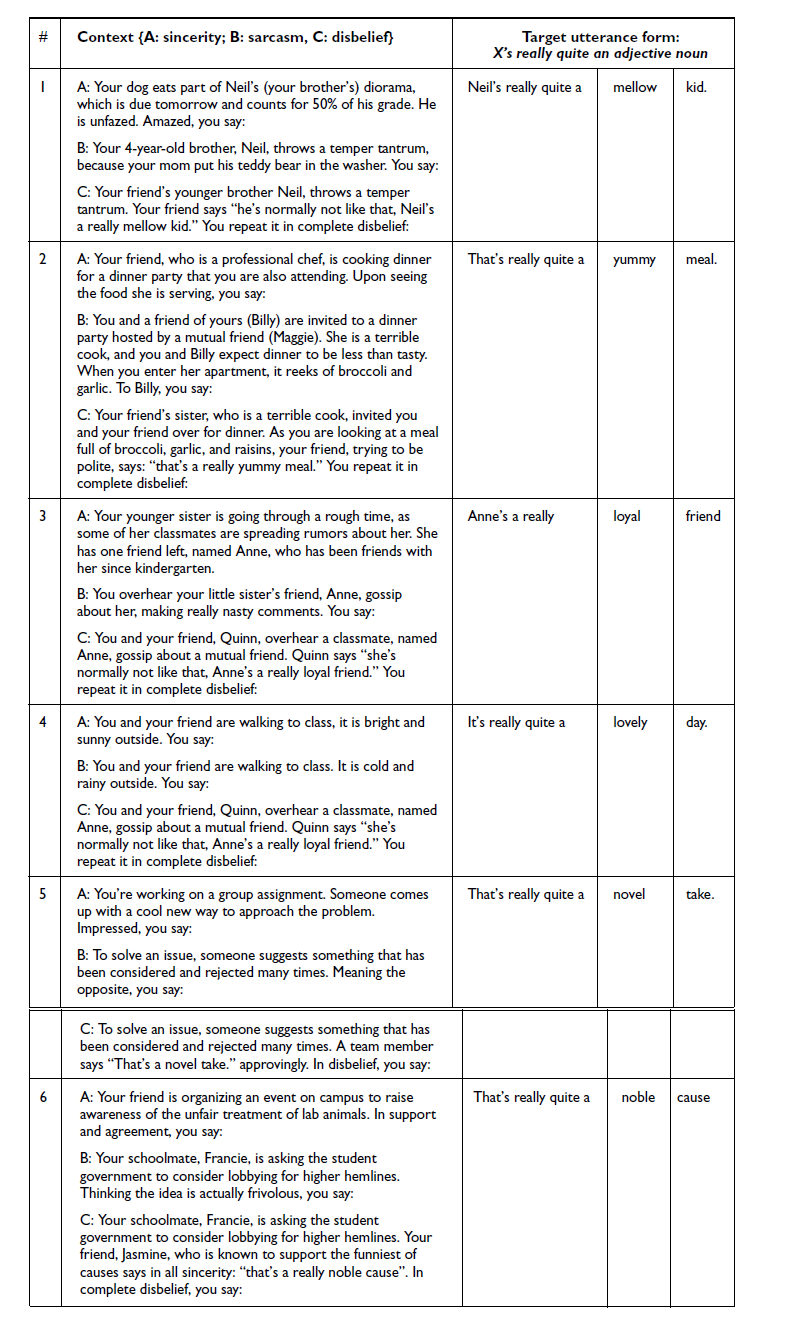
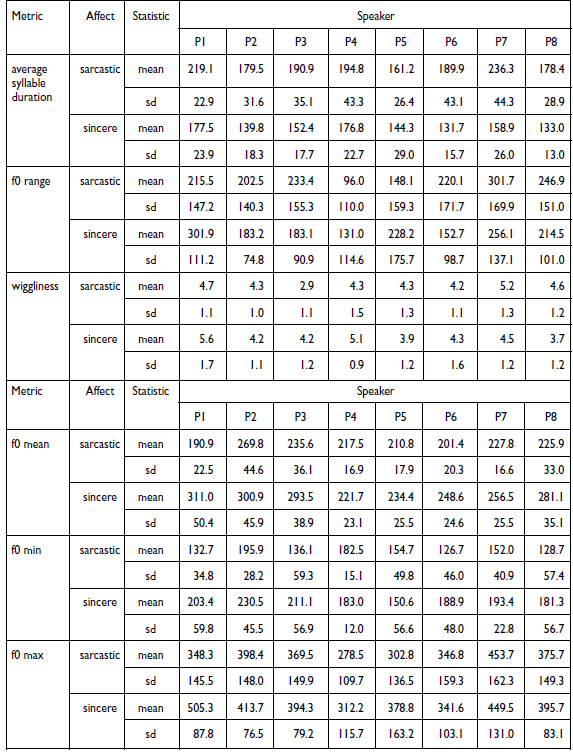
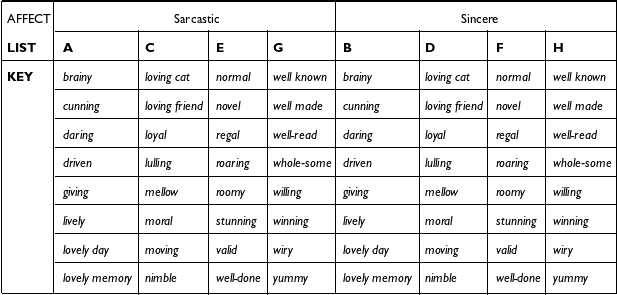
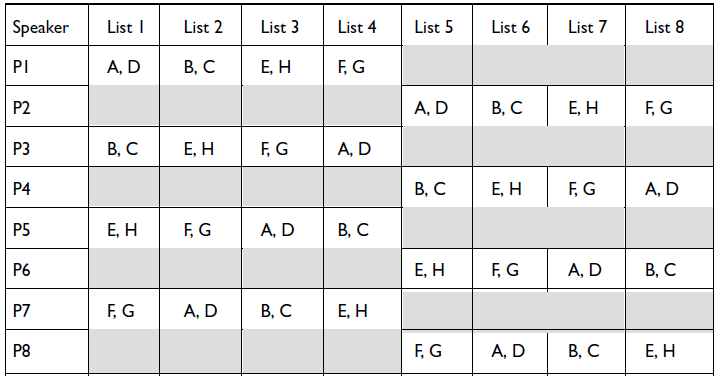
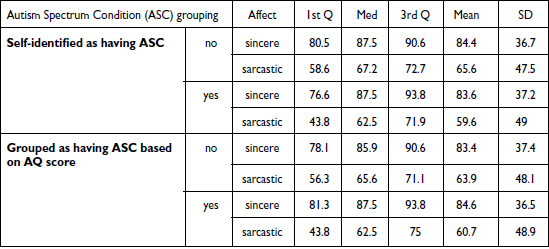
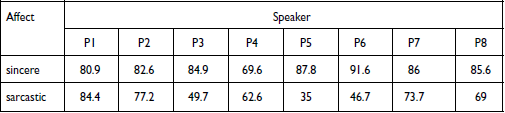
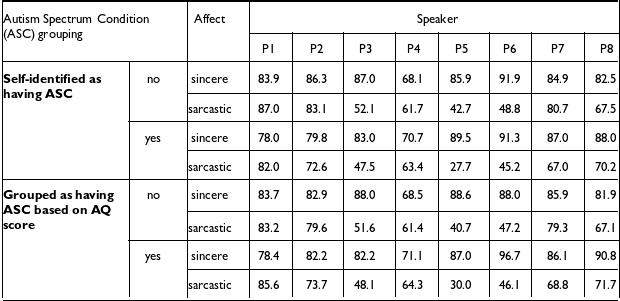
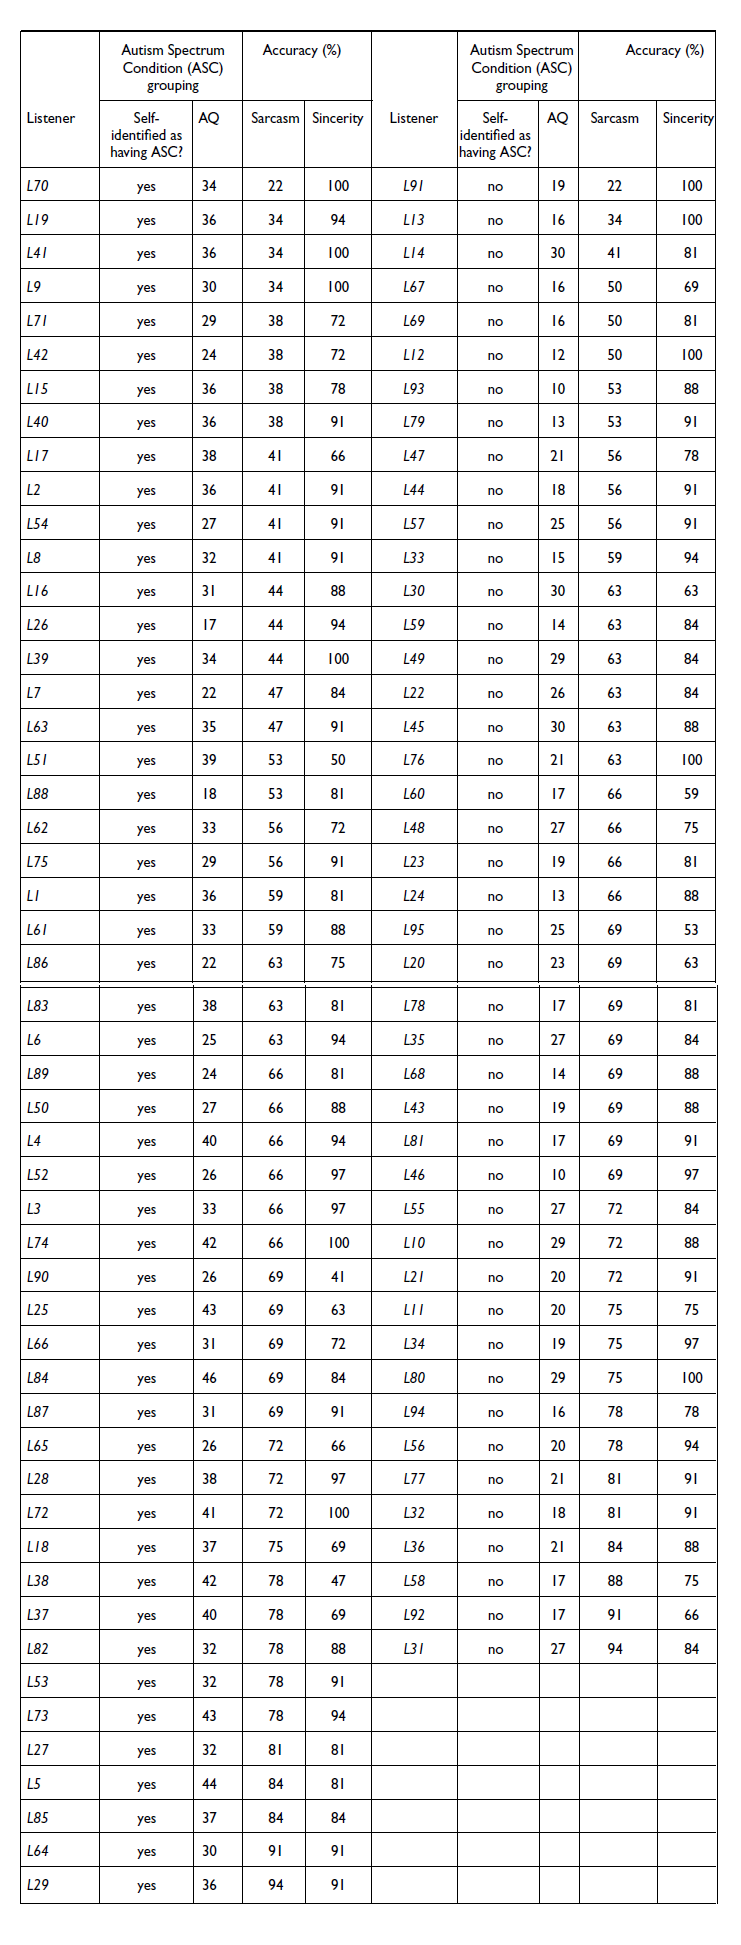
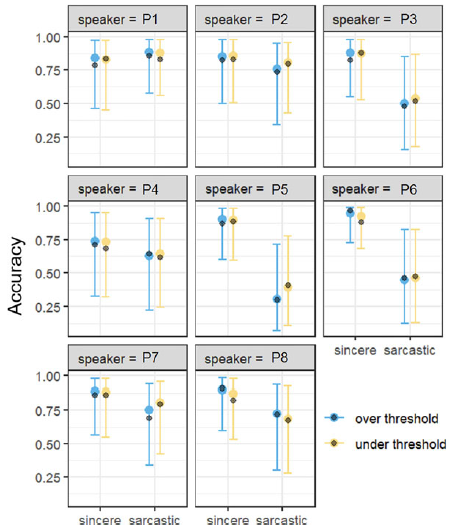


 Open access