


1. Introduction
Mankiyali is an endangered and understudied language situated in the Khyber Pakhtunkhwa Province of Northwest Pakistan, spoken by about 500 people. An impressionistic description states that the language utilizes a complex weight-sensitive stress system (Paramore, Reference Paramore2021). Many studies have covered the subject of stress in the world’s languages, and the use of quantitative measures to determine the acoustic correlates of stress – which most notably began with Fry’s (Reference Fry1955) examination of acoustic correlates of word-level stress in English – has increased significantly in recent years. However, recent work suggests that many phonological descriptions of word-level stress that we do possess – including Fry’s study of English – may unintentionally confound descriptions of prominence at the phrase level with prominence at the word level (Gordon, Reference Gordon, Van Oostendorp, Ewen, Hume and Rice2011, Reference Gordon and Van der Hulst2014; Roettger & Gordon, Reference Roettger and Gordon2017). The present study intentionally teases apart word-level and phrase-level prominence in its experimental design, thereby providing much-needed insights into how the manifestation of prominence at these two separate prosodic levels might differ in Mankiyali. Additionally, this paper provides quantitative evidence supporting the analysis of a five-tier weight-sensitive stress scale in Mankiyali, which, if correct, has important implications for theories of syllable weight.
Beyond enhancing our understanding of the nature of stress in Northwest Indo-Aryan languages and providing quantitative evidence of the stress system, Mankiyali provides fertile ground for the investigation of other current issues surrounding the acoustic analysis of stress. To begin with, Mankiyali possesses a large number of phonemic vowels, along with phonemic distinctions in length. Since duration is perhaps the most persistent acoustic correlate of stress in many of the world’s languages (Van Heuven & Turk, Reference Heuven, Vincent, Turk, Gussenhoven and Chen2021), the question arises as to whether a language like Mankiyali can call upon duration to indicate stress if the language’s phonological system already utilizes the acoustic feature for other means. There is no consensus in the literature on this issue. While Berinstein (Reference Berinstein1979), Hayes (Reference Hayes1995), Gordon & Applebaum (Reference Gordon and Applebaum2010), Vogel et al. (Reference Vogel, Athanasopoulou, Pincus, Heinz, Goedemans and Van der Hulst2016), and others assert that the use of acoustic properties as contrastive features in the lexicon precludes their use as reliable phonetic markers of stress since their use would obscure lexical contrasts – a phenomenon known as the Functional Load Hypothesis (FLH) – Van Heuven & Turk (Reference Heuven, Vincent, Turk, Gussenhoven and Chen2021) conclude that empirical evidence from Swedish (Heldner & Strangert, Reference Heldner and Strangert2001) suggests otherwise. Similarly, Lunden et al. (Reference Lunden, Campbell, Hutchens and Kalivoda2017) did not find any evidence to back up the claims of the FLH in relation to duration in their survey of 140 languages. Nakai et. al. (Reference Nakai, Sari Kunnari, Suomi and Ylitalo2009, Reference Nakai, Turk, Kari Suomi, Ylitalo and Kunnari2012) take a middle ground regarding the FLH, presenting data on utterance-final lengthening in Northern Finnish to show that languages with phonemic vowel length contrasts enforce a “durational ceiling effect” that limits the magnitude of non-phonemic lengthening that can occur. Considering the disparate views on this topic, exploring the status of duration as a reliable acoustic correlate in Mankiyali brings more data and thus further clarity to the debate.
Another topic that has recently received significant attention regarding stress correlates is the role of f0 as a reliable acoustic correlate of word-level stress. Setting aside lexical tone and pitch-accent languages – both of which utilize f0 as a primary correlate to word-level phenomena in different ways – most studies that have examined the acoustic correlates of stress at the word level over the past several decades have included an analysis of f0, and it is often considered one of the primary acoustic correlates to word-level stress (Gordon, Reference Gordon2004 (Chickasaw); Gordon & Applebaum, Reference Gordon and Applebaum2010 (Turkish Karbadian); Garellek & White, Reference Garellek and White2015 (Tongan); a.o.). However, as mentioned above, several recent studies argue that it is likely that many, if not most, acoustic analyses (including the three studies just cited) do not disentangle word-level stress from phrase-level prominence effects, and f0 is often a primary acoustic correlate of phrase-level intonational events rather than of word-level stress (Ortega-Llebaria & Prieto, Reference Marta and Prieto2011; Bruggeman et al., Reference Bruggeman, Louriz, Almbark and Hellmuth2021; Roettger & Gordon, Reference Roettger and Gordon2017; Van Heuven & Turk, Reference Heuven, Vincent, Turk, Gussenhoven and Chen2021). If this is true and the acoustic correlates of these two levels of prominence are often conflated, more studies that control for this conflation are needed.
One final question this paper aims to address is whether any acoustic properties that might correlate with stress, as well as the magnitude of the effect of stress on those properties, differ across syllable types. Yakup & Sereno (Reference Yakup and Sereno2016), in their acoustic study of Uyghur stress, found that stressed/unstressed {CV} syllables showed a higher contrast in duration but a lower contrast in f0 compared to stressed/unstressed {CVC} syllables. This finding indicates that, at least in Uyghur, syllable type may influence the patterning of acoustic correlates of stress between {CV} and {CVC} syllables. With that said, while the Uyghur target words were placed in the non-final position of a sentence frame in this study, they were likely marked with contrastive (phrasal) prominence correlates. As such, the claim that the effect sizes of word-level stress correlates changes across syllable types in Uyghur was potentially confounded with phrasal prominence. In this study, we hope to examine the potential effect of syllable type on phonetic correlates without the confound of focus-related prominence by comparing the magnitude of the change between stressed and unstressed syllables in non-focused positions across all five syllable types relevant to the Mankiyali stress criterion: {CV, CVC, CVCC, CVː, CVːC}. Mankiyali is an apt language in which to explore the impact of syllable type on acoustic correlates, as it is a weight-sensitive stress system reported to have at least a ternary distinction in syllable weight, {CVː(C)} > {CVC(C)} > {CV}, and possibly a five-way distinction.
Notably, the relationship of {CVːC} to {CVː} in terms of weight, as well as the status of {CVCC} in relation to {CVC}, are not clarified in the sole impressionistic description of the Mankiyali stress system (Paramore, Reference Paramore2021). One of the goals of this paper is to explore, using quantitative data, whether these two syllable weight distinctions are warranted. Specifically, this study assumes that if a syllable is phonologically heavier, its attraction of stress will be reflected in greater enhancement of the language-specific phonetic correlates associated with stress (e.g., increased duration, greater intensity, f0, etc.). Under this assumption, we test whether {CVːC} patterns as heavier than {CVː} by examining whether the presence of a {CVːC} syllable in the same word as {CVː} results in phonetic evidence for stress shifting from {CVː}.Footnote 1 For instance, in a word like [ˌbeː.ˌɣı̃ː] ‘rooster.m.pl’ in which both syllables are {CVː}, stress impressionistically falls on the penultimate syllable by default. However, if the final syllable is superheavy {CVːC} – as in [ˌbẽː.ˌɣı̃ːz] ‘rooster.m.pl-dat’ – stress will shift to the final syllable if {CVːC} outweighs {CVː}. By measuring and comparing the acoustic properties of the penultimate syllables in [ˌbeː.ˌɣı̃ː] vs. [ˌbẽː.ˌɣı̃ːz], we can examine whether the acoustic expansion of properties correlating with stress changes in known weight relationships is also present in these words. If the penultimate syllable in [ˌbeː.ˌɣı̃ː] is found to exhibit amplified phonetic properties compared to the penultimate syllable in [ˌbẽː.ˌɣı̃ːz], and the acoustic changes are similar to other weight relationships in the language, this provides good evidence that {CVːC} does indeed outweigh {CVː} for stress. More broadly, if heavier syllables consistently show greater acoustic enhancement under stress, then comparing stressed and unstressed syllables across syllable types offers a direct quantitative test of the hypothesized weight hierarchy in Mankiyali.
The structure of the paper proceeds as follows. In Section 2, we provide a general background for the quantitative study. Sections 2.1 and 2.2 outline previous cross-linguistic work on both word-level stress and phrase-level focus-related prominence, and Section 2.3 supplies an overview of previous acoustic studies of word-level stress and focus-related prominence in Indo-Aryan languages. Section 2.4 gives a brief sketch of the relevant aspects of Mankiyali phonology. A detailed outline of the methodology for the study is given in Section 3, including a description of participants, speech materials, elicitation procedure, and the acoustic and statistical methods used for data analysis. The experiment results are discussed in Section 4, and Section 5 considers the implications of these results. Concluding remarks are given in Section 6.
2. Background
2.1 Previous research on word-level stress and phrase-level focus-related prominence
The usual acoustic suspects that correlate with stress at the word level include some combination of increased duration, intensity, spectral tilt, spectral expansion/vowel quality, and, to a lesser extent, f0 (Van Heuven, Reference Van Heuven, Goedemans, Heinz and Van der Hulst2018). The primary acoustic correlate of phrase-level, focus-related prominence, on the other hand, is generally thought to be a change in f0, which is more directly related to intonational pitch accents associated with phrasally stressed syllables (Van Heuven & Turk, Reference Heuven, Vincent, Turk, Gussenhoven and Chen2021). This change can take the form of a rising f0, a falling f0, or a specific f0 contour. Phrase-level focus-related prominence often falls on the primary stressed syllable of the focused word in a phrase (see Gordon (Reference Gordon and Van der Hulst2014) for a discussion of languages that do not fit this pattern). The term “focus” is used ubiquitously in the literature to refer to a pragmatic concept in which alternatives relevant for the interpretation of a linguistic expression are introduced into a discourse (e.g., Rooth, Reference Rooth1992; Kügler & Calhoun, Reference Kügler, Calhoun, Gussenhoven and Chen2021). Oftentimes, focused constituents are highlighted at the phrase level with some type of prosodic marking, though other methods such as word order are sometimes employed as additional focus markers in languages like Urdu (Jabeen, Reference Jabeen2022). Types of focus include the introduction of new information into a conversation, contrastive focus that highlights a word as contrary to its alternatives, emphasis on a constituent as corresponding to the wh-phrase in a wh-question, and a type of broad focus that applies to large portions of or even whole sentences (Halliday, Reference Halliday1967: 204–207; Ladd, Reference Ladd1980; Feéry, Reference Feéry2013). As will be evident in Section 3, based on our experimental design, the relevant types of focus for this paper include an individual lexical item acting as some combination of new and/or contrastive information, which is typically described as contrastive, narrow focus. Narrow focus refers to a technique used by a speaker to “pragmatically single out” information that is important or new in a discourse (Sbranna et al., Reference Sbranna, Ventura, Albert and Grice2023). Conversely, broad focus does not emphasize an individual portion of an utterance but rather the entire utterance as a unit.
Importantly, narrow focus is usually highlighted by a specific pitch accent corresponding to a change in f0 or an f0 contour, the characteristics of which are usually language-dependent (Jackendoff, Reference Jackendoff1972). Some languages, including certain varieties of Italian, use a falling f0 to indicate different types of narrow focus (Sbranna et. al., Reference Sbranna, Ventura, Albert and Grice2023). Other languages (e.g. Hungarian) rely on a specific f0 contour to highlight the narrowly focused constituent (Vogel et al., Reference Vogel, Athanasopoulou, Pincus, Heinz, Goedemans and Van der Hulst2016: 149). While no comprehensive study of the Mankiyali intonation system has been conducted to date, several other Indo-Aryan languages mark focus with a rising f0. For instance, in Hindi/Urdu, Harnsberger (Reference Harnsberger1994) shows that focused constituents exhibit a marked rise in f0. Similarly, Jabeen (Reference Jabeen2017) found that preverbal nouns with narrow focus in Urdu are optionally marked with a rising f0 across the length of the word. Additionally, Lahiri & Fitzpatrick-Cole (Reference Lahiri, Fitzpatrick-Cole, Kager and Zonnevel1999) showed that constituents with narrow focus in Bengali are consistently realized with a rise in f0.
2.2 Separating word-level stress and phrase-level focus-related prominence
To disentangle word-level stress from focus-related prominence, one must study word-level stress on words in a position without phrasal accent. Target words that appear in a non-focused position of a sentence ideally provide us with a word that is only marked by word-level stress, without the changes in f0 often associated with focus-related prominence described above. Moreover, it is important to place these non-focused words away from phrasal boundaries, which often carry their own variations in pitch that could influence a measurement of word-level stress correlates (Gordon, Reference Gordon and Van der Hulst2014).
In contrast, target words receiving narrow focus in a phrase are associated with both word-level stress and focus-related prominence. In this study, we compare the acoustic properties of a syllable in a non-final, non-focused position with the same syllable in a non-final, focused position to determine what acoustic properties only intensify when a word receives narrow focus; these properties will likely be our acoustic correlates of focus-related prominence. With that said, because not much is known about phrase-level intonation in Mankiyali, it is possible that other confounding effects may still be present, such as f0 downtrend, phrase-level compression effects, or other types of intonational boundary tones. While we attempt to rule these potential confounds out, a thorough examination of phrase-level intonation in Mankiyali is still needed to confirm our results for focus-related prominence.
2.3 Acoustic analyses of word-level stress and focus-related prominence in Indo-Aryan
To our knowledge, a quantitative analysis of stress in Mankiyali, or any phonetic analysis of the language, has never been undertaken. The only literature on the phonology of Mankiyali is the initial impressionistic description of the language’s sound system in Paramore (Reference Paramore2021). Moreover, quantitative analyses of stress systems for other languages in Pakistan also remain scant. As Ohala (Reference Ohala1991) notes, quantitative research on stress in Indo-Aryan languages – which are spoken as first languages by 80 percent of Pakistanis (Cardona & Jain, Reference Cardona and Jain2003) – remains in its infancy compared to phonetic research in other regions of the world, and Abbasi et al. (Reference Abbasi, Pathan and Channa2018) suggest that Ohala’s evaluation still holds true today. Though approximately 80 indigenous languages are spoken in Pakistan, most studies on the acoustic correlates of word-level stress in the region are confined to Hindi-Urdu (Ohala, Reference Ohala, Masica and Sinha1986; Hussain, Reference Hussain1997; Dyrud, Reference Dyrud2001; Nair et al., Reference Nair, Abbi, Gupta and Kidwai2001; Mumtaz et al., Reference Mumtaz, Bögel and Butt2020). The limited number of non-Hindi-Urdu studies include Balti (Caplow, Reference Caplow2016), Gujarati (Shih, Reference Shih2018; Bowers, Reference Bowers2019), Punjabi (Kiranpreet, Reference Kiranpreet2016), Sindhi (Abbasi & Hussain, Reference Abbasi and Hussain2015), and Wakhi (Ivanov & Silanteva, Reference Ivanov and Silanteva2020). Two of these languages do not belong to the Indo-Aryan family but are spoken in Northern Pakistan (Wakhi is Iranian, and Balti is Tibeto-Burman).
Unfortunately, outside of Dyrud’s (Reference Dyrud2001) phonetic analysis of Hindi-Urdu, all the above-mentioned studies seemingly confound word-level stress with various types of phrasal prominence by analyzing the acoustics of target words either in the focus position of a carrier sentence or in isolation. Furthermore, though Hindi-Urdu boasts a weight-sensitive stress system, Dyrud’s study of stress in the language focuses on a small number of minimal pairs in which stress is lexically contrastive rather than weight-sensitive. This means that out of approximately 80 languages currently in use in Pakistan, perhaps only a single study exists that has successfully analyzed the acoustic correlates of word-level stress in a language in the region. Unfortunately, that study focuses on stress as a lexically contrastive linguistic feature rather than analyzing stress in a weight-sensitive system.
Concerning phrase-level prominence, while nothing has been published on Mankiyali phrasal prosody to date, several studies on other Indo-Aryan languages have been conducted examining focus-related prominence. As mentioned above, Harnsberger (Reference Harnsberger1994) studied focus marking on nouns in Hindi/Urdu and concluded that narrow focus is correlated with a LH rise in f0 on the focused constituent. Other work on focus marking in Hindi/Urdu found somewhat similar results but with more variation in the realization of the accent associated with narrow focus. That is, each argument in simple SOV declarative sentences in Hindi/Urdu – similar in shape to the carrier sentences used in the present study on Mankiyali – have been found to act as Minor intonational Phrases (MiP) with a low boundary tone marking the left edge and high boundary tone marking the right edge (Jabeen, Reference Jabeen2019; Jabeen & Delais-Roussarie, Reference Jabeen and Delais-Roussarie2019). Jabeen & Delais-Roussarie (Reference Jabeen and Delais-Roussarie2020) conducted another study examining narrow focus in Urdu and found that words with narrow focus are marked with a rising f0 that is distinct from these MiP boundary markers, though Jabeen (Reference Jabeen2017) reports that this narrow focus marker is optional in some cases. Additionally, Butt & King (Reference Butt and King1996) found that locating a word with narrow focus in the preverbal position in Urdu produces more consistent f0 peaks than when placed post-verbally, indicating that the position of a focused constituent is connected to its acoustic correlates to some degree. In sum, focus-related prominence in Hindi/Urdu generally correlates with a rising f0.
Work on Bengali (Khan, Reference Khan2008, Reference Khan and Jun2014) describes an inventory of various pitch excursions at phrase boundaries and a significant rise in f0 on several different kinds of focused elements. In Tamil (Keane, Reference Keane2007), a Dravidian language, accentual (AP) and intonational (IP) phrases are produced with edge-aligned tonal excursions and an extra AP rising f0 contour on words with narrow focus. To sum up, work on Indo-Aryan and South Asian prosody highlights the consistent presence of phrase-level intonational activity and various degrees of rising f0 on constituents in narrow focus.
As an SOV language with similar flexibility of word movement to languages like Urdu, it is possible that words in pre-verbal position exhibit a more consistent revelation of the acoustic correlates of focus-related prominence in Mankiyali. As such, our stimuli are all elicited in the preverbal position. Additionally, as f0 changes have been shown to act as the primary correlate of narrow focus in other Indo-Aryan languages, we hypothesize that this will be the case in Mankiyali as well and place the target words sentence-medially to avoid potential f0 activity associated with different phrasal boundaries that could be present in the language. However, it should be noted that sentence-medial placement does not guarantee the absence of phrase boundaries, particularly in a language like Mankiyali whose intonational structure remains unstudied. Thus, while sentence-medial position reduces the likelihood of boundary-related f0 movement, it cannot eliminate it entirely.
2.4 Mankiyali phonology
A treatment of Mankiyali phonology can be found in Paramore (Reference Paramore2021). What follows is a summary of the relevant portions of that work. Mankiyali has a 15-vowel system, as depicted in Table 1. Vowels are phonemically distinguished in terms of their length, height, backness, tenseness, and nasality. Crucially, vowel length is a distinctive factor for four places of articulation in the language (/ʌ/ is analyzed as the short counterpart to /ɑː/). Due to the robust utilization of duration in the vocalic inventory, the strict version of the Functional Load Hypothesis mentioned above would predict that the use of duration as an acoustic correlate of stress will be avoided.
Mankiyali vocalic inventory

Table 1 Long description
A table depicting the Mankiyali vocalic inventory with 15 vowels distinguished by length, height, backness, tenseness, and nasality. The table is divided into three main sections: Front, Central, and Back. Each section is further divided into High, Mid, and Low categories. The Front section includes short and long vowels, both tense and lax, as well as long nasal vowels. The Central section includes short and long vowels, both tense and lax, as well as long nasal vowels. The Back section includes short and long vowels, both tense and lax, as well as long nasal vowels. The table lists specific vowel sounds such as tense i, lax I, tense c, lax A, tense o, lax o, and their long and nasal counterparts. The table highlights the phonemic distinctions in Mankiyali, particularly the role of vowel length as a distinctive factor.
Five syllable types in Mankiyali are relevant for determining stress placement: {CV, CVC, CVCC, CVː, CVːC}. Stress in Mankiyali, based on native-speaker judgments, is weight-sensitive and unbounded in that the heaviest syllable in a word attracts primary stress regardless of its position in the word. Moreover, Mankiyali possesses at least a ternary distinction in syllable weight, as demonstrated by the data in (1).

When syllable weight is neutral in Mankiyali – where all syllables in a word are of the same weight – primary stress falls on the penultimate syllable (1a). As is evident from the scale, syllables with long vowels, {CVː(C)}, are the heaviest syllable type (1c), and {CVC(C)} syllables represent the middle level of the hierarchy (1b). Syllables with a short vowel and no coda occupy the lightest position on the scale and only receive primary stress if no other syllable type is present in a word. If there is a tie for the heaviest syllable in a word between two or more syllables, primary stress falls on the rightmost non-final occurrence (1d). Secondary stress does occur in the language and falls on all CVː(C) syllables that do not receive primary stress (1aii, di). Short vowel syllables only receive secondary stress to avoid a stress lapse, two adjacent unstressed syllables (1ai, bi–ii).
Paramore (Reference Paramore2021) notes that the status of {CVCC} in relation to {CVC} and the status of {CVːC} in relation to {CVː} are uncertain in terms of weight distinctions for stress. Most speakers provide impressionistic judgments that primary stress falls on the penultimate syllable in words with two {CVː} syllables like [ˈkɑː.ˌɣɑː] ‘crows’, and they also judge that primary stress shifts to the word-final syllable when the final syllable is {CVːC} in words like [ˌkɑː.ˈɣɑːz] ‘paper’. However, a sizeable minority of speakers provide inconsistent, variable judgments as to whether stress shifts to the word-final position in words of this shape. Regarding the distinction between {CVCC} and {CVC}, Paramore (Reference Paramore2021: 44) cites a single example demonstrating that {CVCC} draws stress from a penultimate {CVC}: [kʌɽ.ˈsʌŋg] ‘a huge heap’. However, this example is a compound word (cf. Urdu [gɑɽ] ‘jumble’ and [sʌŋg] ‘together’), and stress placement in compounds often manifests distinct patterns that deviate from a language’s standard stress system.
Our own intuition is that word-final syllables consistently attract primary stress from the default penultimate position in words like [ˌkɑː.ˈɣɑːz], meaning that {CVːC} is treated as heavier than {CVː} for stress. Furthermore, in most languages in which {CVːC} outweighs {CVː}, {CVCC} (when attested) is also found to outweigh {CVC} (e.g., Kelkar’s (Reference Kelkar1968) examination of Hindi). Based on this, we adopt the strongest possible version of Mankiyali’s weight-sensitive stress system, hypothesizing five distinct weight levels, as shown in (2). To test this hypothesis, we measure and compare the acoustic properties of penultimate syllables when they bear stress versus when stress is attracted to a heavier final syllable. For example, in [ˈmʌ.zʌ], both syllables are {CV}, and the penult is unambiguously stressed. In [mʌ.ˈzʌɽ], on the other hand, speakers indicate that the final {CVC} syllable attracts stress from the penult {CV}. If correct, the penult {CV} in [ˈmʌ.zʌ] should show greater acoustic enhancement than the same syllable in [mʌ.ˈzʌɽ], where it is unstressed. Systematically comparing such minimal pairs across syllable types provides a quantitative means of evaluating the proposed five-level syllable weight hierarchy.
(2) {CVːC} > {CVː} > {CVCC} > {CVC} > {CV}
As discussed in Section 5.4, we argue that the quantitative results of this study support our hypothesis that Mankiyali’s stress system utilizes five levels of syllable weight.
2.5 Predictions
Our experiment aims to examine two aspects of the acoustic correlates of word-level stress. First, we look for acoustic contrasts between stressed and unstressed syllables of the same syllable type. Specifically, we investigate the contrasts of all five syllable types by comparing the acoustic properties of these syllables in a presumably primary stress position to the acoustic properties of the same syllable type in a presumably non-primary stress position. These contrasts should elucidate whether primary-stressed syllables exhibit a significant strengthening of specific acoustic correlates compared to their unstressed counterparts. Our expectation, based on the large body of literature devoted to this topic, some of which was enumerated above, is that primary-stressed syllables will exhibit some combination of increased duration, greater intensity, a flatter spectral tilt, and an expanded vowel space in comparison to unstressed syllables in the same environment. Furthermore, we expect no significant difference in f0 for syllables with word-level stress in a non-focused position of the phrase, as increased f0 is more likely a correlate of narrow focus rather than word-level stress.
Second, we compare the most prominent acoustic correlates of the five different syllable types analyzed in the study to determine the extent to which syllable types differ in their use of specific acoustic correlates. Our prediction is that, just as the use of acoustic correlates used to signify other phonological phenomena will not mitigate their use as acoustic correlates of stress, so too will the acoustic correlates of stress remain unaffected by changes in syllable type. Our reasoning is that for stress to be reliably perceived, its acoustic correlates will remain relatively stable across different contexts within a language. This stability ensures that listeners can consistently detect and interpret stress patterns, regardless of variations in syllable type. Thus, we predict that the only interaction between the acoustic correlates of stress and syllable type will be the magnitude of absolute durational differences between stressed/unstressed short vowels ({CV, CVC, CVCC}) and stressed/unstressed long vowels ({CVː, CVːC}). The reason for this predicted interaction is that long vowels require a greater absolute change in duration between stressed and unstressed syllables compared to short vowels for the change to be reliably heard by listeners (Lunden, Reference Lunden2013; Stevens, Reference Stevens2000). As such, we predict that long-vowel syllables will exhibit greater durational changes as a function of stress compared to short-vowel syllables.
That said, native speaker judgments indicate that all long vowels ({CVː(C)}) receive secondary stress if they do not bear primary stress. Because secondary stress adds a degree of prominence, the durational contrast between primary- and secondary-stressed long vowels may be attenuated. In contrast, short vowels are either fully stressed or entirely unstressed. As a result, comparisons involving long vowels reflect contrasts between primary and secondary stress, while comparisons involving short vowels reflect the more distinct contrast between stressed and unstressed syllables. This asymmetry may obscure the expected durational enhancement in long-vowel syllables – which is precisely what we observe in the results.
Another facet of this study pertains to prominence related to contrastive, narrow focus. We compare the acoustic correlates of stressed syllables in narrow focus to stressed non-focused syllables, where the syllable should be devoid of focus-related prominence as well as pitch excursions commonly present at phrasal boundaries. By so doing, we can ascertain the acoustic correlates of focus-related prominence. Given that narrow focus has consistently been found to correlate with a marked change in f0 in Indo-Aryan languages, we anticipate that Mankiyali focus-related prominence will correlate with a significant change in f0.
3. Methodology
3.1 Participants
Thirty male native speakers of Mankiyali participated in the study. Twenty-seven participants live in Danna or Dameka, two remote mountain villages in Mansehra District, Khyber Pakhtunkhwa, Pakistan, located about 1 kilometer from each other. Three of the participants live in larger cities for work most of the year but grew up speaking Mankiyali and continue to speak with family regularly. All Mankiyali speakers are at least trilingual in Hindko, the predominant language of the region, and Urdu, the national language of Pakistan. Many speak Pashto and/or English as well. The age of every participant (μ = 32, sd = 7.78) was recorded at the time of elicitation.
3.2 Speech materials
As laid out in Section 2.4, the default stress position in Mankiyali falls on the penultimate syllable. Thus, we targeted the penultimate syllable of (mostly) disyllabic words for our acoustic analysis. However, we targeted the final syllable for our analysis of {CVːC} syllables since finding the necessary tokens in which to analyze this syllable type with both primary and secondary stress in the penultimate position is impossible. While this approach may be confounded by word-final lengthening effects, no other approach for analyzing {CVːC} is available. This falls out from the fact that we hypothesize {CVːC} to be the heaviest syllable type in Mankiyali’s stress system, so there is presumably never a case when {CVːC} occurs in the penultimate position in its unstressed form. Consequently, to derive both primary-stressed and secondary-stressed versions of {CVːC} in the same environment, we analyze it in word-final position in both cases.
The complete list of tokens is provided in Table 2. Disyllabic/trisyllabic words with the target syllable in the penultimate position were grouped into near minimal pairs, one of which presumes the target syllable receives primary stress, the other of which presumes the target syllable either receives no stress or secondary stress (depending on syllable type). For languages with contrastive lexical stress, finding identical words in which to compare stressed and unstressed iterations of a syllable is relatively simple. For a weight-sensitive stress language like Mankiyali, on the other hand, primary stress always falls on the heaviest syllable, so finding exact minimal pairs in which to compare the acoustic correlates is not possible. As a result, we settle for near minimal pairs. This approach still enables us to evaluate the acoustic properties of each syllable type, both in stressed and unstressed conditions. By utilizing highly similar segmental environments in our near minimal pairs, we control for other factors, such as coarticulatory effects and inherent differences in acoustic properties across vowel qualities, that could impact the target syllable’s acoustic features. Controlling for the neighboring consonants and target vowel qualities in this way enables us to examine whether the primary vs. secondary/unstressed factor produces measurably significant acoustic differences.
Tokens consist of 25 sets of near minimal pairs (five sets for each syllable type) differing in stress position. The target syllable for each token appears in bold.Footnote 2

Table 2 Long description
A table with five columns labeled CV, CVC, CV, CVCC, and CV:C, each containing rows of tokens. The tokens consist of 25 sets of near minimal pairs, with five sets for each syllable type, differing in stress position. The target syllable for each token appears in bold. The table includes various combinations of consonants and vowels, demonstrating how stress placement varies across different syllable structures. Each row provides examples of words where the target syllable is stressed or unstressed, allowing for comparison of acoustic properties under different stress conditions.
In attempting to analyze the acoustic correlates of a light {CV} syllable, the first word in the near-minimal pair takes the shape {ˈCV.CV}, with stress falling on the penultimate {CV}. To change the position of stress in the second word, we rely on a word with a heavier second syllable, e.g., {CV.ˈCVC}, to draw stress away from the default penultimate position. In both words, the acoustic properties of the penultimate {CV} are analyzed for comparison. The analysis of {CV}, {CVC}, {CVCC}, and {CVː} syllable types was approached in this way. For {CVːC}, we targeted the word-final syllable for the reasons discussed above.
To reduce the possibility of confounding the phonetic correlates of word-level stress with other phonetic correlates, tokens were embedded in a carrier sentence, which made up part of a three-sentence mini-monologue, given in (3). The carrier sentence was identical across tokens. A similar method used to elicit tokens in the non-focused position was first used in Bouchhioua’s (Reference Bouchhioua2008) analysis of stress in disyllabic tokens in Tunisian Arabic and then subsequently by Almbark et al. (Reference Almbark, Bouchhioua and Hellmuth2014) and Bruggeman et al. (Reference Bruggeman, Louriz, Almbark and Hellmuth2021). Each study reports success in deriving the intended changes in focus. Individual mini-monologues were elicited in the order provided in (3) as a whole unit, and participants were instructed to read the units as naturally as possible, pausing briefly between mini-monologues. The second author, a native speaker of Mankiyali, presided over the elicitations and prompted participants to repeat a mini-monologue if speech was unnatural. Since Mankiyali does not have an official writing system, the mini-monologues were presented to participants in the Urdu script, which is often used informally by the Mankiyali speech community.

Embedding the tokens in this construction enables us to isolate the specific acoustic correlates we hope to analyze because the context procured via the mini-monologues disentangles focus-related phrasal prominence from word-level stress. In sentence 1 in (3), the token is new information and thus takes narrow focus in the sentence. We used the tokens in this sentence to analyze focus-related prominence. Sentence 2 sets up the context for the token to appear in non-focused positions in sentence 3; the tokens in sentence 2 were not used in the analysis. The focus in sentence 3 is likely on [t͡soːr] because of the pragmatic context provided by sentence 2. Thus, tokens are non-focused in sentence 3; this is the token in which we analyzed word-level stress.
To confirm that focus indeed falls on [t͡soːr] in sentence 3, rather than on the stressed syllable of the target token, we fit a linear mixed-effects model to predict the mean f0 over the middle 60 percent of the vowel of all target tokens for a single speaker (AZ1). To rule out the possibility that sentence-level f0 differences between the two sentences could account for the observed effect, we included the mean f0 of [sʌŋɡi] as a covariate in the model. The presumed focus status of the target token (focused vs. non-focused) was included as a fixed effect, and a random intercept was added for target token identity: token_Meanf0 ∼ sʌŋɡi_Meanf0 + Focus + (1 | target_token). The model shows that, even after controlling for f0 variability across sentences, target tokens in the non-focused condition (sentence 3) had significantly lower mean f0 than those in the focused condition (sentence 1). Specifically, target f0 was lower by approximately 16 Hz: Est. (non-focused) = −15.81 Hz, 95% CI = [−18.97, −12.65], t = −9.81, p < .001*** (The full model is provided in the appendix). In sum, the model corroborates the expected change in focus-related prominence.
Figure 1 shows sentence pitch tracks for the token [mʌzdɑːr] embedded in sentences 1 and 3, where narrow focus falls on the stressed syllable of [mʌzdɑːr] in sentence 1 but on [t͡soːr] ‘four’ in sentence 3. A visual comparison of the two waveforms shows that the vowel of the stressed syllable of [mʌzdɑːr] in sentence 1 is realized with a rising f0, increased intensity, and a longer duration than the same syllable in sentence 3. This rising f0 indicates that similar to other Indo-Aryan languages mentioned above, Mankiyali signifies new/contrastive information with a rise in f0 on the stressed syllable compared to neighboring non-focused syllables. It is also interesting to note that the relative f0 level of both sentences is similar (except for [mʌnd͡ʒu] in sentence 3), suggesting that, at least for AZ1, f0 downtrend is not a major factor.
f0 tracks overlaid on the waveforms of sentence 1 (left) and sentence 3 (right) for the token [mʌzˈdɑːr] spoken in the second session by AZ1. In sentence 1, [mʌzˈdɑːr] is new information and marked with focus-related prominence, and in sentence 3, [t͡soːr] ‘four’ is marked with focus, and [mʌzˈdɑːr] is not. Breaks in f0 tracks correspond to obstruents in the signal that did not produce a reliable f0. The black arrow points to the vowel of the word-final stressed syllable in [mʌzˈdɑːr].

Figure 1 Long description
Two graphs present f0 tracks overlaid on waveforms of sentences in the Mankiyali language. The left graph shows sentence 1, where the token [mzdr] is new information and marked with focus-related prominence. The right graph shows sentence 3, where [tsor] four is marked with focus, and [mzdr] is not. Breaks in the f0 tracks correspond to obstruents in the signal that did not produce a reliable f0. The black arrow points to the vowel of the word-final stressed syllable in [mzdr]. The x-axis represents time in seconds, and the y-axis represents frequency in Hertz. All values are approximated.
As mentioned above, an added benefit of embedding the token in the middle of a simple declarative carrier sentence is that we avoid the interference of pitch excursions that often occur at phrasal boundaries (Gordon, Reference Gordon and Van der Hulst2014). However, a reviewer notes that sentence 1 has three fewer syllables than sentence 3. Given this, it is possible that the durational effects reported to arise from differences in focus-related prominence in Section 4.2.4 may instead result from polysyllabic shortening within intonational phrases that results from a compression of syllables to fit the prosodic structure. To examine this potential confound, we conducted a Welch’s Two Sample t-test comparing the vowel duration of the penultimate syllable of [sʌŋ.ɡi] in sentence 1 and sentence 3 for one speaker (MY0). If polysyllabic shortening was in effect, we should observe the penultimate syllable of [sʌŋ.ɡi] in sentence 3 to be significantly shorter than that in sentence 1 because of the extra syllables. Nevertheless, results of the t-test show no significant difference between the vowels in these two conditions: t(178.84) = −.84, p = .40, n = 189. As such, assuming data from MY0 is representative of the entire dataset, we conclude that polysyllabic shortening within the intonational phrase is not responsible for any measurable changes in duration between focused and non-focused words in these sentences.
3.3 Elicitation procedure
Elicitations took place in the summer of 2022 in a quiet home in the Mankiyali-speaking villages of Danna and Dameka. A head-worn Audio-Technica BP894X Cardioid Condenser Microphone connected to a Zoom H5 Handy Recorder was used to record the productions. For all participants, the first author positioned the microphone approximately 2 cm from the right corner of the mouth to minimize measurement perturbations from plosive bursts and head movements. Additionally, input gains on the Zoom H5 were calibrated to -12dB for each speaker’s normal voice amplitude before the recording began. Participants were recorded individually and given oral instructions for the task in Mankiyali by the second author, a native Mankiyali speaker. Participants were then shown a document on a laptop containing the mini-monologues discussed in the previous section and were subsequently asked to take five minutes to read through the sentences to familiarize themselves with the stimuli before the session began. Any questions about the content were answered in Mankiyali. Once the session began, participants were told to read the mini-monologues out loud at a normal pace. The order in which the mini-monologues appeared was randomized but fixed across speakers. Each speaker was recorded reading the entire wordlist twice, with two to four days in between sessions. The entire set of audio files collected for this experiment is archived with the Computational Resource for South Asian Languages (CoRSAL), an online repository for under-resourced languages of South Asia (CoRSAL, 2023).
3.4 Acoustic analysis
The segmentation process proceeded as follows. The vowel of each target syllable was labeled in Praat TextGrids (Boersma & Weenink, Reference Boersma and Weenink2015) by the first author. The acoustic intervals associated with vowels were determined according to the first zero crossing of a clear change in periodicity and amplitude at the onset and offset of the vowel on a waveform. For tokens lacking an abrupt change in amplitude in the waveform, a change in the finer structure of the wave cycles was used as a boundary cue instead. When neither a change in amplitude nor distinctions in wave cycles were clear, the spectrogram was consulted to determine the location of the onset and offset of a clear F2. An example of the segmentation criteria is shown in Figure 2 for the vowel /eː/.
Representative image of vowel segmentation in Praat for /peːkiːz/ extracted from sentence 1 of the mini-monologue from the second session of speaker MS1.

Figure 2 Long description
The image displays a waveform and spectrogram analysis of the word /pekiz/ in the Mankiyali language. The waveform at the top shows the amplitude of the sound wave over time, with a labeled positive zero crossing indicating the point where the wave crosses the zero amplitude line. Below the waveform, the spectrogram visualizes the frequency spectrum of the sound, with a labeled clear onset of F2, indicating the beginning of the second formant frequency. The spectrogram shows the distribution of energy across different frequencies over time, with darker areas representing higher energy. The image also includes a segmentation of the word /pekiz/ into individual phonetic segments, labeled as p, e, and k.
The duration of target vowels was calculated using the vocalic intervals with the boundaries stipulated above. The intensity for each vowel was calculated in two ways. First, the average intensity over the middle 60 percent of each vowel was measured to avoid transition effects for surrounding consonants at vowel edges. This was computed using the built-in Praat intensity calculator, which computes the total intensity accumulated over the specified timeframe, from t1 to t2, and divides by that timeframe to determine the mean: $\frac{1}{{\left( {{t_2} - {t_1}} \right)}}\mathop \smallint \nolimits_{{t_1}}^{{t_2}} x\left( t \right)dt$
. In addition, the peak intensity over this interval was extracted. Results from average and peak intensity were similar, so we only report the statistical results of peak intensity.
$\frac{1}{{\left( {{t_2} - {t_1}} \right)}}\mathop \smallint \nolimits_{{t_1}}^{{t_2}} x\left( t \right)dt$
. In addition, the peak intensity over this interval was extracted. Results from average and peak intensity were similar, so we only report the statistical results of peak intensity.
A static measure of f0 was taken in a similar fashion, calculating the mean f0 across the middle 60 percent of the vowel to avoid measurement effects from segments flanking the vowel. Moreover, to include a dynamic analysis of f0, a series of f0 values were extracted at 10 equally spaced time points across the length of each vowel, which permits an analysis of how f0 might change over the course of the vowel.
To examine whether stress vowels are produced with more vocal effort, the spectral tilt of each vowel was also measured, following the method proposed by van Heuven & Turk (Reference Heuven, Vincent, Turk, Gussenhoven and Chen2021: 164) of analyzing the slope of a regression line fit through the long-term average spectrum (LTAS) of a vowel. After the vowel interval was annotated, the LTAS was computed with a bandwidth of 100 Hz; a regression line was then fit to the LTAS with a frequency range of 50 to 4,000 Hz. The spectral tilt corresponds to the slope of the regression line and is reported in dB/Hz.
Vowel space expansion refers to the potential for the quality of a vowel to expand toward the periphery or reduce toward a more neutral schwa-like position, depending on whether a vowel is stressed or unstressed. The relative peripherality of each vowel was calculated as the Euclidean distance of the target vowel from the hypothesized middle of each speaker’s vowel space. To mitigate inter-speaker variation, F1 and F2 formant values were first normalized by taking the ratio of the first two formants compared to F3 (F1/F3 and F2/F3) before calculating the Euclidean distance of a vowel from each speaker’s central point (“neutral schwa”) in this F3-normalized plane. As discussed in Monahan & Idsardi (Reference Monahan and Idsardi2010), using these formant ratio algorithms instead of raw formant values has been shown to remove variation across speakers. Because the vowel space changes from speaker to speaker, the neutral schwa was calculated individually for all 30 participants. This was done in the following way. First, the mean F1/F3 and F2/F3 values of /i/, /u/, and /aː/ were calculated for each participant using the tokens they produced during the experiment. These three vowels were selected because they provide an estimate of the outer bounds of the vowel space in three separate directions away from the center of the vowel space. After the formant ratio values were calculated for each of these three vowels, the F1/F3 and F2/F3 center of gravity between them was pinpointed: F1/F3ə = (μF1/F3i + μF1/F3u + μF1/F3ɑː)/3 and F2/F3ə = (μF2/F3i + μF2/F3u + μF2/F3ɑː)/3. Once the formant ratio values of the neutral schwa were determined for each speaker, the Euclidean distance of every target vowel token from each speaker’s neutral schwa was then computed in the F3-normalized vowel space on a speaker-by-speaker basis. Comparing the Euclidean distance of stressed and unstressed vowels allows us to explore potential differences in the vowel space between the two stress conditions.
3.5 Statistical analysis
Statistical analysis was carried out using linear mixed-effects models in R (R Core Team, 2016) with the lme4 package (Bates et al., Reference Bates, Maechler, Bolker and Walker2023) and lmerTest (Kuznetsova et al., Reference Kuznetsova, Brockhoff and Christensen2017). For each of the five acoustic properties examined in this study, a series of models was run. Full model specifications are outlined in detail in the corresponding results sections. In general, each analysis begins with a complex lmer model including main effects and interactions, followed by a series of pairwise comparisons extracted using the emmeans() function in R (Lenth, Reference Lenth2024). Bonferroni corrections to p-values were applied based on the number of comparisons made using the adjust = ‘bonferroni’ option in emmeans. Given the relatively small effect sizes found in this study, the Bonferroni correction was chosen to provide a conservative adjustment and reduce the risk of Type I error in multiple comparisons.
Additionally, it is well known that speech rate, f0, and intensity baselines vary widely across speakers. To avoid unintended effects of speaker variation in the statistical models, duration, intensity, spectral tilt, and f0 values were converted to speaker-specific z-scores. To remove outliers, values greater than 2.5 units from the mean for both z-scored variables and Euclidean Distance were removed before the complex lmer models were run. The number of tokens trimmed in this process is provided in Table 3.
Number of outliers removed from each model

Table 3 Long description
The table presents the number of outliers removed from each model for various measures, comparing unstressed versus stressed and non-focused versus focused conditions. It consists of five rows and three columns. The columns are labeled 'Measures', 'Unstressed vs. stressed', and 'Non-focused vs. focused'. The rows are labeled with different measures: Duration, Intensity, Spectral Tilt, f0, and Euclidean Distance. Each cell contains the number of outliers removed and the percentage of total outliers in parentheses. Notable trends include a higher number of outliers removed for Intensity and Euclidean Distance in the unstressed versus stressed condition, and a significantly higher number of outliers removed for f0 in the non-focused versus focused condition.
Because the magnitude of the effect of stress and focus-related prominence on the different acoustic properties are crucial for understanding the results and ensuing discussion in this paper, we chose to report pairwise comparisons in raw measurements rather than z-scored values. Using raw values makes interpreting the effect sizes more straightforward.
Finally, while vowel quality is known to impact duration, our experimental tokens lack a balance in vowel quality across syllable type conditions, which arose from difficulty in identifying near-minimal pairs with varying vowel qualities. If included as a random effect, the disparity in vowel quality across syllable type conditions might cause vowel quality to erroneously soak up some of the variation accounted for by the effect of syllable type. Thus, it was excluded as a predictor in the models. Random effects for both speaker and target syllable were included where appropriate. Including speaker as a random effect helps the model to account for inherent differences in f0, speaking rate, etc., across participants, and including random slopes and intercepts for target syllable (e.g., /kʰʌ/, /mus/, /kɑː/, etc.) ensures inherent variability across near-minimal word pairs does not deleteriously alter the estimated coefficients.
All visual plots are presented using normalized values throughout the paper to avoid different speaker baselines obscuring the visuals.
Number of tokens for each syllable type used in the analysis of word-level durationFootnote 3

Table 4 Long description
The table presents the number of tokens for each syllable type used in the analysis of word-level duration. It includes data for primary stress, secondary/no stress, and the total per syllable type. The table has five rows and four columns. The columns are labeled Primary stress, Secondary/no stress, and Total per syllable type. The rows are labeled CV, CVC, CVCC, CV, and CVC. The data shows the following: CV has 291 tokens for primary stress, 306 for secondary/no stress, and a total of 597. CVC has 181 tokens for primary stress, 242 for secondary/no stress, and a total of 423. CVCC has 226 tokens for primary stress, 322 for secondary/no stress, and a total of 548. The second CV row has 269 tokens for primary stress, 292 for secondary/no stress, and a total of 561. The second CVC row has 284 tokens for primary stress, 306 for secondary/no stress, and a total of 590. The totals across all syllable types are 1,251 for primary stress, 1,468 for secondary/no stress, and 2,719 overall.
4. Results
4.1 Word-level stress correlates
This section presents results for the impact of word-level stress on the acoustic properties of the signal. Crucially, as discussed in Section 3, all tokens included in the analysis of word-level stress correlates are presumably devoid of phrase-level prosodic effects since the tokens are neither focused nor utterance-final. As such, this section compares word-level primary-stressed syllables to word-level secondary-stressed/unstressed syllables, both embedded in the third sentence of the mini-monologues described above.
4.1.1 Duration
With 30 speakers producing each of the 50 tokens twice, the total possible tokens from the dataset was N = 3,000 (1,500 stressed and unstressed). 173 of these 3,000 tokens were discarded due to poor recording quality, reading errors, or unnatural pauses. In addition, tokens from the near-minimal pair, [belti]∼[beltiːz], were removed entirely because the [e] in the initial syllable of both words was consistently produced as a long vowel rather than a short vowel by all speakers, thereby impacting the predicted stress location. After removing these items, the resulting token set included an actual total of N = 2,719 words used in the analysis. Furthermore, possibly because Mankiyali has no official writing system, participants sometimes misread a token from the “stressed” category as a token from the “unstressed” category (e.g. [ˈmus.ki] was sometimes read with a long vowel in word-final position: [mus.ˈkiː]). Importantly, long vowels are approximately double the length of short vowels in Mankiyali, so spotting these errors is straightforward. Therefore, rather than discarding these tokens, they were recategorized based on their actual productions under the appropriate stress condition; 95 tokens were recategorized in this way. Altogether, a total of 1,251 tokens with primary stress on the target syllable and 1,468 tokens lacking primary stress on the target syllable were included. Table 4 details the exact token quantities broken up by stress condition for each of the five syllable types used in the duration analysis.
Table 5 summarizes the outcome of the effects-coded lmer model testing the effects of stress, syllable type, and their interaction on duration. As is evident, the effect of stress on duration is significant, and, out of the interaction of stress with each of the five syllable types, only {CVːC} reached significance. This means that, in general, syllables exhibit a significant change in duration between the stressed and unstressed conditions that is similar across syllables types. That is, the use of duration as an acoustic correlate of stress in Mankiyali is relatively constant across the five syllable types. The significant interaction between stress and the {CVːC} syllable type on duration is likely an artifact of the experimental design. Because stressed and unstressed {CVːC} syllables were compared, by necessity, in word-final position, word-final lengthening effects presumably increased the mean duration of the vowel in both stressed and unstressed tokens. Additionally, comparisons in the final position likely result in a greater absolute effect size because a greater proportional difference in absolute duration must be achieved between two vowels in the word-final position for the difference to be perceptible (Hogoboom, Reference Hogoboom2013).
z-scored lmer model showing the effect of stress and syllable type on vowel duration: Duration∼stress*syllable type + (1 + stress|speaker) + (1|target.syllable)

Table 5 Long description
The table presents a z-scored linear mixed-effects model analyzing the impact of stress and syllable type on vowel duration. It includes factors such as Intercept, stressed, CV, CVC, CVCC, and their interactions. Each factor is associated with an estimate in z-scored milliseconds, a ninety-five percent confidence interval, a t-value, and a p-value. Notable trends include significant effects of stress on duration and a significant interaction between stress and the CVC syllable type. The table highlights that syllables generally exhibit a significant change in duration between stressed and unstressed conditions, consistent across syllable types. The significant interaction between stress and the CVC syllable type is likely due to word-final lengthening effects.
Considering these word-final lengthening effects, it is safe to conclude that our study found no evidence that syllable type alters the use of duration as an acoustic correlate of stress. Furthermore, while we expected to see an interaction effect of syllable type and stress that distinguished long vowels from short vowels for duration, only {CVːC}, and not {CVː}, was found to exhibit a significant difference in durational effect size. This is likely because syllables with long vowels always receive some degree of stress compared to short vowel syllables, which are either stressed or unstressed in the tokens used for this experiment.
As the pairwise comparisons in Table 6 show, the presence of stress correlated with a mean vowel length increase between 10–15 ms (10–19 percent), with t- and p-values indicating a significant difference between the two stress conditions for all syllable types.
Figure 3 displays boxplots of tokens categorized by stress and syllable type. As shown in the plot and the associated model summaries, stressed syllables are consistently longer than their unstressed counterparts, and the effect size remains relatively stable across all syllable types.
Pairwise comparisons showing the effect of stress on vowel duration for each of the five syllable types in the experiment: emmeans(lmer, ∼ stress | syllable type)

Table 6 Long description
The table presents data on the effect of stress on vowel duration for five syllable types: CV, CVC, CVCC, CV:, and CV:C. It includes columns for unstressed estimates in milliseconds, 95% confidence intervals, stress effects in milliseconds and percentage, stress effect 95% confidence intervals, t-values, and p-values. The CV syllable type has an unstressed estimate of 56 milliseconds, a stress effect of 11 milliseconds (19%), and a p-value of less than 0.001. The CVC syllable type has an unstressed estimate of 57 milliseconds, a stress effect of 11 milliseconds (18%), and a p-value of less than 0.001. The CVCC syllable type has an unstressed estimate of 60 milliseconds, a stress effect of 10 milliseconds (17%), and a p-value of less than 0.001. The CV: syllable type has an unstressed estimate of 112 milliseconds, a stress effect of 11 milliseconds (10%), and a p-value of less than 0.001. The CV:C syllable type has an unstressed estimate of 128 milliseconds, a stress effect of 15 milliseconds (11%), and a p-value of less than 0.001. All syllable types show significant differences between stressed and unstressed conditions.
Boxplots grouped by syllable type depicting z-scored vowel duration differences between word-level stressed and unstressed syllables.

Figure 3 Long description
The box-and-whisker plot displays the distribution of z-scored vowel durations for stressed and unstressed syllables across different syllable types. The x-axis represents the target syllable types: CV, CVC, CVCC, CV:, and CV:C. The y-axis shows the duration in z-scores over milliseconds, ranging from -2 to 2. Each syllable type has two box plots, one for unstressed syllables in yellow and one for stressed syllables in blue. The boxes indicate the interquartile range (Q1 to Q3), with the median (Q2) marked by a line inside each box. The whiskers extend to the minimum and maximum values within 1.5 times the interquartile range, and outliers are shown as individual points beyond the whiskers. The unstressed syllables generally have lower median durations compared to the stressed syllables across all syllable types. The CV: and CV:C syllable types show the most significant differences in duration between stressed and unstressed syllables, with stressed syllables having higher median values and a wider range of durations. All values are approximated.
4.1.2 Intensity
The number of tokens used in the lmer model for intensity equaled the number used in the duration model. As shown in Table 7, stress had a small but statistically significant effect on peak intensity. Interactions between stress and syllable type were generally not significant, indicating that the effect of stress on intensity was relatively stable across different syllables. An exception was stressed CVC, which showed a significant but modest increase in peak intensity.
z-scored lmer model showing the effect of stress and syllable type on intensity. PeakIntensity∼stress*syllable type + (1 + stress|speaker) + (1|target.syllable)

Table 7 Long description
The table presents a z-scored lmer model analyzing the effect of stress and syllable type on intensity. It includes factors such as Intercept, stressed, CV, CVC, CVCC, CV, stressed:CV, stressed:CVC, stressed:CVCC, and stressed:CV. Each factor is associated with an estimate (z-scored over decibels), a 95% confidence interval, a t-value, and a p-value. The Intercept has an estimate of 0.42 with a confidence interval of [-0.62, -0.21], a t-value of 3.94, and a p-value of less than 0.001. The stressed factor has an estimate of 0.04 with a confidence interval of [0.02, 0.07], a t-value of 3.26, and a p-value of 0.001. Other factors like CV, CVC, CVCC, and their interactions with stress show varying estimates, confidence intervals, t-values, and p-values, indicating the stability of the effect of stress on intensity across different syllables. Notably, stressed CVC shows a significant but modest increase in peak intensity.
Pairwise comparisons by syllable type of estimated marginal means (EMMs) of peak intensity, provided in Table 8, show that no difference in intensity arose as a factor of stress for any of the syllable types except CVC. Though the interaction of stress and syllable type for CVC syllables does exhibit a significant effect, the estimated effect size is negligible, at approximately 1.4 decibels, and is barely perceptible using wideband noise in highly controlled environments (Moore, Reference Moore2013; Stevens, Reference Stevens2000), let alone for speech with ambient noise. Given this and the lack of significance for the other four syllable types, we conclude that intensity is not a reliable correlate of word-level stress in Mankiyali for any syllable type.
Pairwise comparisons showing the effect of stress on peak vowel intensity for each of the five syllable types in the experiment: emmeans(lmer, ∼ stress | syllable type)

Table 8 Long description
The table presents pairwise comparisons of the effect of stress on peak vowel intensity for five syllable types in an experiment. It includes columns for syllable type, unstressed estimated intensity in decibels with 95% confidence intervals, stress effect in decibels with percentage and 95% confidence intervals, t-value, and p-value. The syllable types are CV, CVC, CVCC, CV, and CVC. Notable findings include a significant stress effect for the CVC syllable type with a 1.4 decibel increase, while other syllable types show negligible or non-significant effects.
The boxplots in Figure 4 provide a visual confirmation that stressed and unstressed syllables tended to have no measurable effect on intensity values across syllable types in this study.
Boxplots grouped by syllable type depicting vowel intensity differences between word-level stressed and unstressed syllables.

Figure 4 Long description
The box-and-whisker plot displays peak intensity over decibels for different syllable types, comparing stressed and unstressed conditions. The x-axis represents target syllables labeled as CV, CVC, CVCC, CV:, and CV:C. The y-axis shows peak intensity in z-scores over decibels, ranging from -2 to 2. Each box plot represents the distribution of peak intensity for a specific syllable type under stressed and unstressed conditions. The boxes indicate the interquartile range (Q1 to Q3), with the median (Q2) marked by a line inside each box. The whiskers extend to the minimum and maximum values within 1.5 times the interquartile range. Outliers are shown as individual points beyond the whiskers. The stressed and unstressed conditions are color-coded in blue and yellow, respectively. The plot reveals variations in peak intensity across different syllable types and stress conditions, with some syllable types showing wider spreads and more outliers. All values are approximated.
4.1.3 Spectral tilt
In many languages, stressed syllables have been found to exhibit a notable increase in intensity in the higher frequency ranges compared to lower frequencies, and this change in spectral tilt is more readily perceived than aggregate spectral changes in overall intensity (Sluijter & van Heuven, Reference Sluijter and van Heuven1996). This asymmetric increase in intensity across the spectrum due to stress causes the spectral slope of stressed syllables to be less steep than that of unstressed syllables. Consequently, fitting a regression line to the intensity values of a vowel’s spectrum and measuring the slope of that line (i.e., the spectral tilt) is an important potential correlate to word-level stress.
The full token set (N = 2,719) was used in the analysis of spectral tilt. The lmer output summary in Table 9 shows the effects of stress and syllable type on the spectral tilt measurements. As is evident, the presence of stress was found to significantly correlate with a flatter spectral tilt, indicating that higher frequencies increase in intensity compared to lower frequencies in stressed syllables. Additionally, the effect of stress on spectral tilt was significantly stronger in CVCC syllables compared to other syllable types.
z-scored lmer model summary showing the effect of stress and syllable type on spectral tilt: SpectralTilt∼stress*syllable type + (1 + stress|speaker) + (1|target.syllable)

Table 9 Long description
The table presents a z-scored lmer model summary analyzing the effect of stress and syllable type on spectral tilt. It includes factors such as Intercept, Stressed, CV, CVC, CVCC, and their interactions. Each factor is associated with an estimate (z-scored over decibels per Hertz), a 95% confidence interval, a t-value, and a p-value. Notable findings include a significant correlation between the presence of stress and a flatter spectral tilt, with higher frequencies increasing in intensity compared to lower frequencies in stressed syllables. The effect of stress on spectral tilt is significantly stronger in CVCC syllables compared to other syllable types. The table lists specific values for each factor, such as an estimate of 0.04 for Stressed with a p-value of less than 0.001, and an estimate of 0.49 for CVCC with a p-value of 0.04. Interactions between stress and syllable types are also detailed, with stressed:CVCC showing an estimate of 0.05 and a p-value of 0.03.
Despite the main effect of stress found in the complex model, pairwise comparisons in Table 10 and the corresponding boxplots in Figure 5 highlight that a significant change in spectral tilt correlating with stress was only observed for CVCC syllables.
Pairwise comparisons showing the effect of stress on spectral tilt for each of the five syllable types in the experiment: emmeans(lmer, ∼ stress | syllable type)

Table 10 Long description
The table presents pairwise comparisons of the effect of stress on spectral tilt for five syllable types: CV, CVC, CVCC, CV:, and CVC:. It includes columns for unstressed estimates in decibels per Hertz with 95% confidence intervals, stress effect in decibels per Hertz with 95% confidence intervals, t-values, and p-values. The syllable types are listed in rows with their respective data. Notably, the CVCC syllable type shows a significant stress effect with a p-value of less than 0.001, indicating a notable change in spectral tilt due to stress. Other syllable types show varying degrees of stress effect, with some being statistically insignificant.
Boxplots grouped by syllable type depicting spectral tilt differences between word-level stressed and unstressed syllables.

Figure 5 Long description
The box-and-whisker plot compares spectral tilt differences between word-level stressed and unstressed syllables across different syllable types. The plot features five vertical box plots grouped by syllable type: CV, CVC, CVCC, CV:, and CV:C. The x-axis represents the target syllable types, while the y-axis represents spectral tilt in z-scores, ranging from -2 to 2. Each box plot shows the distribution of spectral tilt for unstressed (yellow) and stressed (blue) syllables. The median, lower quartile, and upper quartile are indicated within each box. Whiskers extend to the minimum and maximum values, with outliers marked as individual points. The CV syllable type shows a slight difference in median spectral tilt between unstressed and stressed syllables. The CVC syllable type exhibits a more pronounced difference, with stressed syllables having a higher median spectral tilt. The CVCC syllable type shows a wider spread for unstressed syllables. The CV: syllable type has a notable difference in median spectral tilt, with stressed syllables showing a higher median. The CV:C syllable type shows a moderate difference in median spectral tilt. All values are approximated.
To sum up, while the full lmer model revealed a significant main effect of stress on spectral tilt, follow-up pairwise comparisons using estimated marginal means indicated that this effect was limited to CVCC syllables. This suggests that although spectral tilt may weakly correlate with stress in Mankiyali, the effect is restricted and inconsistent across syllable types, limiting its reliability as a robust correlate to word-level stress.
4.1.4 f0
Figure 6 displays two GAM (Generalized Additive Model) curves plotting f0 values separated by stress condition. After the duration of each vowel token in the experiment was calculated, we extracted 10 f0 measurements equally spaced across each vowel’s duration. The curves are fit to these 10 f0 measurements, with each time point averaged across all speakers and vowel tokens. As is evident from the plot, the two curves are almost identical in the change in f0 over time and their f0 values at each timestep.
GAM curves separated into word-level stressed (dark blue) and unstressed (yellow) conditions showing mean vowel f0 across 10 normalized timesteps for all non-focused conditions.

Figure 6 Long description
A line graph displays the mean vowel f0 across 10 normalized timesteps for word-level stressed and unstressed conditions. The x-axis represents timesteps from 1 to 10, while the y-axis represents f0 in z-scores over Hertz. Two lines are plotted: a dark blue line for stressed conditions and a yellow line for unstressed conditions. Both lines show a downward trend, indicating a decrease in f0 over time. The shaded areas around the lines represent the confidence intervals. All values are approximated.
The lmer model output in Table 11 summarizes the interaction between stress and timestep and shows no significant interaction between these two factors. Thus, it is left out of the following models, and a static measure of mean f0 over the middle 60 percent of the vowel is used instead to simplify the statistical interpretations.
z-scored lmer model summary showing the effect of stress and step on f0: f0∼stress*step + (1 + stress|speaker) + (1|target.syllable)

Table 11 Long description
The table presents a z-scored linear mixed-effects model summary examining the effect of stress and timestep on fundamental frequency (f0). It includes ten steps of interaction between stress and timestep. The intercept has an estimate of 0.42 with a 95% confidence interval of 0.56 to 0.28, a t-value of 5.83, and a p-value of less than 0.001, indicating significance. The stressed condition alone has an estimate of 0.01 with a confidence interval of 0.02 to 0.03, a t-value of 0.57, and a p-value of 0.57, showing non-significance. Each stressed step from step 1 to step 10 has estimates ranging from 0 to 0.01, with varying confidence intervals, t-values, and p-values all indicating non-significant interactions. The table concludes that there is no significant interaction between stress and timestep on f0, leading to the use of a static measure of mean f0 for further analysis.
z-scored lmer model summary showing the effect of stress and syllable type on Meanf0. Meanf0∼stress*syllable type + (1 + stress|speaker) + (1|target.syllable)

Table 12 Long description
The table presents a z-scored lmer model summary that examines the effects of stress and syllable type on Meanf0. It includes seven columns: Factors, Estimate (z-scored over Hertz), ninety-five percent Confidence Interval, t-value, and p-value. The table has twelve rows, each representing different factors and their interactions. Key factors include Intercept, stressed, CV, CVC, CVCC, and their interactions. Notable trends include significant p-values for Intercept, CVC, stressed:CVC, and stressed:CVCC, indicating strong effects. The estimates and confidence intervals provide insights into the magnitude and direction of these effects.
The total number of tokens used for the lmer model analyzing mean f0 was 55 less (N = 2,662) than for models analyzing other acoustic properties because these tokens were either too short or too creaky to find a reliable mean f0 across the middle 60 percent of the vowel. Notably, almost 70 percent of these tokens (37) that lacked a measurable f0 were in unstressed conditions. Table 12 summarizes the effect of stress and syllable type on mean f0. The interaction of stress and syllable type was significant for CVC, CVCC, and CVːC, with the effect of stress on f0 increasing for CVC and slightly decreasing for CVCC and CVːC.
As indicated by the pairwise comparisons in Table 13, however, only CVC showed a significant stress effect. Thus, although f0 may weakly correlate with stress in CVC syllables specifically, it does not emerge as a consistent correlate of word-level stress in Mankiyali.
Pairwise comparisons showing effect of stress on mean f0 for each of the five syllable types in the experiment

Table 13 Long description
The table presents pairwise comparisons of the effect of stress on mean frequency for five syllable types in an experiment. It includes columns for syllable type, unstressed estimated frequency in hertz with ninety-five percent confidence interval, stress effect in hertz with ninety-five percent confidence interval, t-value, and p-value. The syllable types are CV, CVC, CVCC, CV, and CVC. Only the CVC syllable type shows a significant stress effect with a p-value of less than point zero zero one. The table indicates that while frequency may weakly correlate with stress in CVC syllables, it does not consistently correlate with word-level stress in Mankiyali.
4.1.5 Vowel space expansion
To quantify the potential effect of stress on vowel quality, we calculated the Euclidean distance of stressed vowel tokens from the hypothetical center of each speaker’s vowel space and compared it to the Euclidean distance of unstressed vowel tokens from this center point. As mentioned above, the Euclidean distance measurements were taken in relation to the F1/F3–F2/F3 plane.
A summary of the pairwise comparisons of estimated marginal means between unstressed and stressed vowels is given in Table 14. Syllable type had no effect on the results, so the findings are reported for each vowel collapsed across syllable types. Stress was not found to significantly impact vowel quality for any of the five vowels. This is visually corroborated by examining the vowel space in Figure 7, which shows the word-level stressed vowels (dark blue) falling almost on top of the word-level unstressed vowels (yellow) in terms of their distance from the neutral schwa in the F1/F3–F2/F3 space. Altogether, the results examining the correlation between word-level stress and vowel quality indicate no relationship between the two variables.
Pairwise comparisons showing the effect of stress on Euclidean distance from a neutral schwa for each vowel quality in the study. Euclidean distance is calculated in an F1/F3–F2/F3 space, so estimates are not in Hertz but with respect to the first two formants as ratios of F3. EucDist∼stress + (1|speaker) + (1|target.syllable)

Table 14 Long description
The table presents pairwise comparisons showing the effect of stress on Euclidean distance from a neutral schwa for each vowel quality in the study. It includes columns for unstressed Euclidean distance estimates, their 95% confidence intervals, stress effect estimates, stress effect 95% confidence intervals, t-values, and p-values. The vowels analyzed are a, e, u, A, and i. The table shows that stress does not significantly impact vowel quality for any of the five vowels, as indicated by the p-values being greater than 0.05. The Euclidean distance is calculated in an F1/F3F2/F3 space, and the estimates are not in Hertz but with respect to the first two formants as ratios of F3. The table includes five rows for each vowel and eight columns for the different metrics.
F1/F3–F2/F3 vowel space showing the mean F1/F3 and F2/F3 ratio values of all 30 speakers for stressed (dark blue) and unstressed (yellow) word-level tokens with the mean hypothetical neutral schwa (gray) across all speakers.

4.1.6 Summary
This section explored the effect of word-level stress on five acoustic properties commonly associated with stress cross-linguistically: duration, intensity, spectral tilt, f0, and vowel quality. No evidence was found indicating that intensity, spectral tilt, f0, or vowel quality covary with stress consistently across syllable types. In contrast, duration emerged as the only robust and consistent correlate: primary stressed vowels were approximately 10–11 ms longer (10–19 percent) than their secondary/unstressed counterparts for {CV}, {CVC}, {CVCC}, and {CVː} syllables and approximately 15 ms longer (11 percent) for {CVːC} syllables. Although the magnitude of this difference increased for {CVːC} syllables, the overall durational effect remained relatively stable when considering word-final lengthening. In short, our findings suggest that duration is the most reliable acoustic correlate of word-level stress in Mankiyali across syllable types.
Weak but statistically significant effects of stress on f0 and spectral tilt were observed for isolated syllable types. Specifically, pairwise comparisons showed a small but significant increase in f0 (3.4 Hz) for stressed CVC syllables, and a significantly flatter spectral tilt for stressed CVCC syllables. Thus, while it is possible that different syllable types in Mankiyali utilize distinct acoustic correlates to signal stress, the evidence for this is weak.
4.2 Focus-related prominence correlates
This section examines the correlates to focus-related prominence by comparing focused tokens (tokens with word-level stress produced in sentence 1 of the mini-monologue) to tokens without focus (tokens with word-level stress produced in sentence 3 of the mini-monologue). Importantly, both groups of tokens are marked with word-level stress, so other than differences in sentence syllable count, the primary difference between the two tokens is the presence/absence of narrow focus. This means that we can attribute any acoustic differences between the two groups to the effects of focus-related prominence. None of the interaction effects for focus*syllable type were significant for any of the acoustic properties measured except for duration, so results in this section are reported with the syllable type predictor dropped from all models except for the lmer model with duration as the independent variable.
4.2.1 f0
Similar to the GAM curves in Figure 6 in Section 4.1.4 for word-level stressed vs. unstressed tokens, Figure 8 shows GAM curves fit to 10 normalized timesteps at which f0 was measured for every stressed vowel in both the focused and non-focused conditions. Whereas the curves comparing word-level stressed and unstressed tokens in Section 4.1.4 were essentially on top of each other (indicating that f0 is not a correlate of word-level stress in Mankiyali), the curves here demonstrate that f0 is substantially higher in the focused condition compared to the unfocused condition across the length of the vowel.
GAM curves separated into focused (dark blue) and non-focused (yellow) conditions showing mean vowel f0 across 10 normalized timesteps for all tokens.

Figure 8 Long description
The line graph displays two data lines representing mean vowel f0 across 10 normalized timesteps. The x-axis is labeled 'timestep' with values ranging from 1 to 10. The y-axis is labeled 'f0 (z-scores over Hz)' with values ranging from -0.5 to 0.5. The dark blue line represents the focused condition, starting at approximately 0.5 and gradually decreasing to around 0.3. The yellow line represents the non-focused condition, starting at approximately 0 and gradually decreasing to around -0.5. All values are approximated.
As shown by the summary of the effects for focus and step in Table 15, the first four timesteps exhibit significant negative effect sizes, but the final four timesteps exhibit significant positive effects. These significant interactions indicate that the effect of focus-related prominence is more pronounced later in the vowel.
z-scored lmer model summary showing the effect of focus and step on f0: f0∼focus*step + (1 + focus|speaker) + (1|target.syllable)

Table 15 Long description
The table presents a z-scored lmer model summary that examines the effect of focus and step on f0. It includes seven columns: Factors, Estimate (z-scored over Hertz), ninety-five percent Confidence Interval, t-value, and p-value. The table has eleven rows, each representing different factors and their interactions. The first row shows the intercept with an estimate of point one one and a confidence interval ranging from negative zero point zero eight to zero point three. The t-value is one point one one, and the p-value is zero point two eight. The second row indicates the effect of being focused, with an estimate of point five one, a confidence interval from zero point four four to zero point five seven, a t-value of fifteen point three six, and a p-value of less than zero point zero zero one, marked with three asterisks. The subsequent rows detail the interactions between being focused and steps one through ten. Notably, steps one through four exhibit significant negative effect sizes, while steps seven through ten show significant positive effects. For instance, focused step one has an estimate of negative point zero five, a confidence interval from negative zero point zero nine to negative zero point zero two, a t-value of negative three point three three, and a p-value of less than zero point zero zero one. In contrast, focused step ten has an estimate of point zero seven, a confidence interval from zero point zero four to zero point one one, a t-value of four point seven six, and a p-value of less than zero point zero zero one. These significant interactions suggest that the effect of focus-related prominence is more pronounced later in the vowel.
Because the effect of focus on f0 changes across the timespan of the vowel, it is important to analyze the differences in effect sizes at different points. To do this, we categorized the 10 timesteps into three bins, roughly corresponding to the beginning third (beg.), middle third (mid.) and final third (end) of the vowel tokens and conducted pairwise comparisons between non-focused and focused syllables within each of these time intervals using the emmeans() function. The results are provided in Table 16, and as the visual suggests, the effect size of focus on f0 increases over the course of the vowel. Specifically, f0 falls from approximately 127 Hz in the first third of the vowel to 121 Hz in the final portion of the vowel. For focused tokens, however, f0 remains relatively steady across the length of the vowel at around 134–137 Hz. These numbers suggest that, as expected, f0 acts as an acoustic correlate of focus in Mankiyali, with focused tokens exhibiting a significantly higher f0 than non-focused tokens.
Pairwise comparisons showing the effect of focus on f0 for three timesteps, corresponding to the beginning, middle, and final third of the vowel tokens: f0∼focus + (1 + focus|speaker) + (1|target.syllable)

Table 16 Long description
The table presents pairwise comparisons showing the effect of focus on f0 for three timesteps, corresponding to the beginning, middle, and final third of the vowel tokens. It includes columns for nonfocused estimates in Hertz with 95 percent confidence intervals, focus effect in Hertz with 95 percent confidence intervals, t-value, and p-value. The rows are labeled as beg for beginning, mid for middle, and end for the final third. The nonfocused estimates decrease from 127 Hertz at the beginning to 121 Hertz at the end, while the focus effect increases from 10 Hertz at the beginning to 13 Hertz at the end. The t-values and p-values indicate significant differences between nonfocused and focused syllables within each time interval.
Boxplots depicting peak intensity differences between non-focused and focused syllables.

Figure 9 Long description
A box-and-whisker plot compares peak intensity between non-focused and focused syllables. The plot features two vertical box plots. The x-axis represents focus type with categories labeled as Non-Focused and Focused. The y-axis represents peak intensity in decibels, ranging from -2 to 2. The Non-Focused box plot has a median around 0, with the lower quartile near -0.5 and the upper quartile around 0.5. It includes outliers below -1.5 and above 1.5. The Focused box plot has a median around 0.75, with the lower quartile near 0.25 and the upper quartile around 1.25. It includes outliers below -1.5 and above 2. The Focused syllables show higher peak intensity with a wider spread compared to Non-Focused syllables.
4.2.2 Intensity
The presence of narrow focus also correlated with a simple main effect on peak intensity (formula = PeakIntensity∼focus + (1 + focus|speaker) + (1|target.syllable), N = 2,546, intercept (non-focused) = 68.95 dB, Est. (focused) = 4.05 dB, 95% CI = [3.53, 4.57], t = 15.48, p < .001***).Footnote 4 As illustrated by the boxplots in Figure 9, focused tokens were, on average, about 1 standard deviation (∼4 dB) louder than non-focused tokens with only word-level stress.
Boxplots depicting spectral tilt differences between non-focused and focused syllables.

Figure 10 Long description
A box-and-whisker plot compares spectral tilt differences between non-focused and focused syllables. The plot features two vertical box plots. The x-axis represents the focus type, with categories labeled as Non-Focused and Focused. The y-axis represents spectral tilt in z-scored decibels per Hertz, ranging from -2 to 2. The Non-Focused box plot has a median around -0.5, with the lower quartile near -1 and the upper quartile around 0.5. The whiskers extend from approximately -2 to 2. The Focused box plot has a median around 0, with the lower quartile near -0.5 and the upper quartile around 1. The whiskers extend from approximately -2 to 2. Both box plots show a similar range of spectral tilt values, indicating variability in spectral tilt for both non-focused and focused syllables. All values are approximated.
4.2.3 Spectral tilt
As shown in Figure 10, the simple pairwise comparison of focused and non-focused syllables showed a significant change in spectral tilt of equal magnitude across all syllable types: formula = SpectralTilt∼focus + (1 + focus|speaker) + (1|target.syllable), N = 2,546, intercept (non-focused) = −.007 dB/Hz, Est. (focused) = .0008 dB/Hz, 95% CI = [.0006, .001], t = 7.83, p < .001***. This means that focused syllables exhibit a greater increase in intensity at higher frequencies (which is the potential cause of the flatter spectral tilt on stressed syllables) in Mankiyali.
4.2.4 Duration
In addition to f0, intensity, and spectral tilt, duration was also significantly impacted by the main effect of focus. As shown by the summary of main effects and interaction effects in Table 5, the interaction of focus and syllable type were significant and positive for both {CVː} and {CVːC} but significant and negative for the three short vowel syllables. These opposite effect sizes indicate that the magnitude of the effect of focus on vowel duration significantly increased for both {CVː} and {CVːC} and likely decreased for the three syllable types with short vowels compared to the main effect of focus across all syllable types. Such interaction effects are unsurprising, given that long vowels need to increase by a greater raw duration between focused and non-focused syllables to maintain a similar proportional increase as short vowels (Hogoboom, Reference Hogoboom2013).
z-scored lmer model showing the effect of focus and syllable type on duration. Duration ∼ focus*syllable type + (1 + focus|speaker) + (1|target.syllable)

Table 17 Long description
The table presents a z-scored linear mixed-effects model analyzing the effect of focus and syllable type on duration. It includes factors such as Intercept, Focused, CV, CVC, CVCC, and their interactions. Each factor is associated with an estimate in z-scored milliseconds, a 95% confidence interval, a t-value, and a p-value. Notable trends include significant positive effects of focus on CV and CVC syllables, and significant negative effects on syllables with short vowels. The interaction effects indicate that the magnitude of the effect of focus on vowel duration increases for CV and CVC syllables and likely decreases for syllables with short vowels.
Interestingly, whereas the interaction of word-level stress and syllable type was not significant between long and short vowel syllables for word-level stress (Table 5), the magnitude of durational differences was significant between long and short vowel syllable types with focus as a main effect. In other words, the inherently longer duration of long vowels led to a larger absolute increase in the effect size caused by the presence of focus-related prominence, but this same effect size was not found for word-level stress.
Table 18 reports pairwise comparisons of duration for each syllable type with corresponding boxplots in Figure 11. The important takeaways for our purposes are that focused and non-focused syllables show a significant mean duration difference of 9–10 ms for short vowel syllables, and this difference is exacerbated by an additional 12–14 ms for long vowel syllables.
Pairwise comparisons showing the effect of focus on vowel duration for each of the five syllable types in the experiment

Table 18 Long description
The table presents pairwise comparisons of duration for each syllable type, with five syllable types analyzed. It includes columns for non-focused estimates in milliseconds, ninety-five percentage confidence intervals, focus effect in milliseconds, focus effect ninety-five percentage confidence intervals, t-values, and p-values. The syllable types are CV, CVC, CVCC, CV colon, and CV colon C. Notable trends include a significant mean duration difference of nine hundred ten milliseconds for short vowel syllables and an additional one thousand two hundred fourteen milliseconds for long vowel syllables between focused and non-focused syllables. The table highlights that focused syllables consistently have longer durations across all syllable types.
Boxplots grouped by syllable type depicting vowel duration differences between focused and non-focused syllables.

Figure 11 Long description
The box-and-whisker plot displays vowel duration differences between focused and non-focused syllables across different syllable types. The plot features five vertical box plots grouped by syllable type: CV, CVC, CVCC, CV:, and CV:C. The x-axis represents the target syllable types, while the y-axis shows the duration in z-scores over milliseconds. Each box plot includes data for both focused and non-focused syllables, color-coded in blue and yellow, respectively. The median values for focused syllables are generally higher than those for non-focused syllables across all syllable types. The CV: and CV:C syllable types show the most significant differences in duration between focused and non-focused syllables. Outliers are present in all groups, with varying distributions. The plot highlights that focused syllables tend to have longer durations compared to non-focused syllables, particularly in the CV: and CV:C syllable types. All values are approximated.
4.2.5 Vowel space expansion
To determine whether the presence of focus-related prominence alters vowel quality, the Euclidean distance of each token from a speaker’s calculated center point in the F1/F3–F2/F3 vowel space was compared across two levels of prominence: focused tokens (N = 1,295) and word-level stressed tokens that lack focus-related prominence (N = 1,251). As summarized by the lmer in Table 19, a main effect of focus was found for /ɑː/, /eː/, /ʌ/, and /i/ but not for /u/. These results are visualized by the F1/F3–F2/F3 vowel space plot in Figure 12. These results suggest that vowel space expansion is a plausible correlate of focus-related prominence in Mankiyali, though its expression may be limited to certain vowel qualities.
Pairwise comparisons showing the effect of focus on Euclidean distance from a neutral schwa for each vowel quality. Euclidean distance is calculated in an F1/F3–F2/F3 space, so estimates are not in Hertz but with respect to the first two formants as ratios of F3. EucDist∼focus + (1|speaker) + (1|target.syllable)

Table 19 Long description
The table presents a comparison of the effect of focus on Euclidean distance from a neutral schwa for each vowel quality. It includes columns for nonfocused estimates, ninety-five percentage confidence intervals, focus effects, focus effect ninety-five percentage confidence intervals, t-values, and p-values. The table has five rows, each representing a different vowel quality: alpha, epsilon, u, A, and i. For each vowel, the nonfocused estimate, focus effect, and their respective confidence intervals are provided. The t-value and p-value indicate the statistical significance of the focus effect. Notable trends include significant focus effects for the vowels alpha, epsilon, and i, as indicated by the p-values being less than point zero five. The vowel u shows no significant focus effect. The table provides a detailed quantitative analysis of how focus-related prominence alters vowel quality in the F1/F3F2/F3 vowel space.
F1/F3–F2/F3 vowel space of the mean formant ratio values of all 30 speakers for stressed focused (dark blue) and non-focused (yellow) tokens compared to the mean formant ratio value of the hypothetical neutral schwa (gray) across all speakers.

Figure 12 Long description
A scatter plot displays the relationship between F1/F3 and F2/F3 ratios for stressed focused (dark blue) and non-focused (yellow) vowel tokens. The plot includes data points from 30 speakers, with the mean formant ratio values of a hypothetical neutral schwa (gray) also shown. The x-axis represents the F2/F3 ratio, while the y-axis represents the F1/F3 ratio. The data points are clustered into three distinct groups, each representing different vowel sounds. The stressed focused tokens are positioned higher on the y-axis compared to the non-focused tokens, indicating a higher F1/F3 ratio. The neutral schwa is centrally located among the data points. All values are approximated.
4.2.6 Summary
This section compared the acoustic properties of word-level stressed syllables in the focused position of a sentence to the acoustic properties of word-level stressed syllables in the non-focused position of a sentence. Whereas duration was the only correlate found to consistently covary as a function of word-level stress, all five acoustic properties measured in the study significantly changed as a function of focus. To sum up, tokens marked with focus-related prominence are not only produced with an increased f0, as predicted, but with the blanket expansion of all phonetic properties measured in the study.
5. Discussion
5.1 Word-level stress correlates
As demonstrated in Section 4.1, duration is the only acoustic property measured in this study found to consistently correlate with word-level stress across syllable types. Nevertheless, while the change is significant for all five syllable types examined, the effect size remains relatively small, ranging from 10–15 ms. Other studies that control for phrasal prominence and cite duration as a correlate to word-level stress have observed much larger effect sizes. For instance, stressed vowels in Papiamentu, a Caribbean creole language with contrastive word-level stress, are, on average, 31 ms (39 percent) longer than their unstressed counterparts (Remijsen & van Heuven, Reference Remijsen and van Heuven2002). This durational difference is more than double the durational difference found between unstressed and stressed vowels in the current study, which may lead one to interpret the results as an effect of something other than stress. Nevertheless, at least three reasons exist to support the interpretation of the detected durational effect as a correlate of word-level stress. First, impressionistic judgments of native Mankiyali speakers strongly and consistently agree on stress placement analyses that support the following scale: CVV(C) > CVC(C) > CV.Footnote 5 And as Hayes (Reference Hayes1995: 9) asserts, if a group of native speakers agrees on a specific linguistic observation (e.g., presence of stress), “we are justified in taking that agreement as a datum.” The reasoning behind this assertion is clear concerning stress: while the acoustic manifestation of prominence may be inconsistent cross-linguistically, the regular identification of its presence provides perceptual evidence in favor of its existence. Moreover, while no controlled experiments have been conducted to confirm these perceptual impressions quantitatively, the potential correlates that correspond with speakers’ judgments must be ascertained before such an experiment can be undertaken. Thus, determining the acoustic correlates of stress is a necessary precursor to a perceptual study. In the meantime, speaker impressions provide support for the presence of stress in Mankiyali.
Second, while the effect of stress on duration is small, the directionality of the effect is consistently positive, statistically significant, and likely perceptually detectable across syllable types. That is, all five syllable types measured in the study show an increase in duration when stress is present. If stress did not exist, we might expect either no effect at all or, at the very least, random directionality where some syllables exhibit a negative effect such that duration decreases in the presence of stress. Furthermore, the durational effects on all five syllable types meet or exceed the Just Noticeable Difference (JND) value as explained by Stevens (Reference Stevens2000: 228–229), which he defines as the minimum proportion of duration a speech sound must change by to be perceived by speakers at least 50 percent of the time. For the unstressed vowels analyzed in this study, the JND is about equal to the square root of the length of the vowel for vowels up to 100 ms. For example, the JND of a 100 ms vowel is approximately $\sqrt {100} $
or 10 ms. For vowels consistently longer than 100 ms, the JND is about 10 percent of the base duration. These JND calculations are reported by Stevens (Reference Stevens2000: 203) to apply cross-linguistically, as they stem from general physiological traits of the human auditory system. Table 20 shows the calculated mean duration of word-level unstressed vowels in Mankiyali, the JND for each syllable type based on that mean duration, and the actual mean durational change between word-level unstressed vowels and word-level stressed vowels observed in this study. The effect size of word-level stress eclipses the JND for all syllable types except {CVː}, which is about equal with the predicted JND. It is possible that, since all {CVː} syllables that do not receive primary stress are marked with secondary stress, the durational difference between primary and secondary stressed {CVː} syllables is diminished compared to the other syllable types. Conversely, for {CVːC}, this attenuation was likely counteracted by the analysis of {CVːC} in the word-final position, which coincides with word-final lengthening effects.
$\sqrt {100} $
or 10 ms. For vowels consistently longer than 100 ms, the JND is about 10 percent of the base duration. These JND calculations are reported by Stevens (Reference Stevens2000: 203) to apply cross-linguistically, as they stem from general physiological traits of the human auditory system. Table 20 shows the calculated mean duration of word-level unstressed vowels in Mankiyali, the JND for each syllable type based on that mean duration, and the actual mean durational change between word-level unstressed vowels and word-level stressed vowels observed in this study. The effect size of word-level stress eclipses the JND for all syllable types except {CVː}, which is about equal with the predicted JND. It is possible that, since all {CVː} syllables that do not receive primary stress are marked with secondary stress, the durational difference between primary and secondary stressed {CVː} syllables is diminished compared to the other syllable types. Conversely, for {CVːC}, this attenuation was likely counteracted by the analysis of {CVːC} in the word-final position, which coincides with word-final lengthening effects.
Results from the present study on word-level stress showing the mean duration of unstressed vowels in each of the five syllable types examined, the predicted JND based on those durations, and the actual durational change correlating with word-level stress

Finally, though 10–15 ms constitutes a relatively small effect of stress on duration compared to effects found for languages like Papiamentu cited above, such an increase is within the normal range of durational differences reported in the literature in studies that control for prominence at different levels. For instance, in Roettger & Gordon (Reference Roettger and Gordon2017) cross-linguistic survey of published studies examining the acoustic correlates of stress, they found that only 19 of 85 studies in the survey successfully measured word-level stress in positions without focus-related prominence and away from phrasal edges where pitch excursions are rampant. Out of those 19 studies, only a single language – Jordanian Arabic (De Jong & Zawaydeh, Reference De Jong and Zawaydeh1999, Reference De Jong and Zawaydeh2002) – utilizes a weight-sensitive stress system, and the durational difference between unstressed and stressed vowels in the non-focused position was ∼12 ms (23 percent) for short vowels and ∼27 ms (14 percent) for long vowels. They do not report that long vowels without primary stress receive secondary stress in Jordanian Arabic, so the difference between their results for long vowels and the ones reported here should be interpreted with this in mind. Taking the effects of secondary stress into account, the impact of word-level stress on duration in Mankiyali is similar in magnitude to the impact of stress on duration in Jordanian Arabic. Thus, it is possible that correlates undergo more dramatic changes for languages in which stress placement plays a role in lexical identification (i.e., lexically contrastive stress languages like Papiamentu). Conversely, in languages with weight-sensitive stress systems like Mankiyali and Jordanian Arabic, where stress placement is predictable, the magnitudes of the correlates of stress are dampened.
Taken together, we assume that the effect size of duration found in this study is large and consistent enough for speakers to rely on as a correlate of word-level stress. Moreover, though a comprehensive survey of various stress systems is needed, the durational effect size in Mankiyali could be small because the stress system is weight-based and predictable as opposed to lexically contrastive.
A strict version of the FLH, predicts that duration should not be called upon as a primary acoustic correlate of prominence in Mankiyali. Contrary to these predictions, not only was duration found to be a significant acoustic correlate of both word-level stress and focus-related prominence, it was also the only acoustic property found to consistently correlate with word-level stress. In light of these results, it seems that the FLH, in its strongest form, does not hold up to scrutiny. Rather, an increase in vowel duration due to word-level stress does not close the gap between short and long vowels in any meaningful way. Specifically, the mean difference between short vowels with word-level stress and long vowels without word-level stress ranges from 38 ms on the low end to 62 ms on the high end, and a durational effect size of ∼10 ms due to word-level stress still allows speakers to easily distinguish between the two vowel types. The use of duration as the primary acoustic correlate of word-level stress in Mankiyali, then, argues against the claim that acoustic properties utilized in phonologically contrastive domains cannot be used to indicate the location of stress.
5.2 Durational differences from word-level stress vs. compression effects
One may argue that the durational differences we have found between stressed and unstressed syllables may, in fact, reflect a compression effect – in which additional segments result in the shortening of other segments – rather than a correlate of stress. The idea, similar to the concept of polysyllabic shortening discussed in Lehiste (Reference Lehiste1972), is that the addition of another segment to a word (e.g., adding a final consonant to a CV.CV word) results in the duration of the other segments compressing to compensate. Since the measurements of the effect of stress on duration in this study were typically examined by adding an additional segment to the final syllable to shift stress, our finding that duration correlates with stress may be confounded with the compression effect. To test whether this is the case, we conducted a pairwise comparison, evaluating the effect of stress on duration between the penultimate vowels in [kʌ.ˈt͡sʌɽ] and [ˈpʌtʰ.re], using every token from sentence three in the mini-monologues for each of these two words from all speakers in the experiment (N = 110).
Both words contain the same number of onsets, nuclei, and codas, so the durational difference should not arise if it was caused by word-internal compression effects. Additionally, the vowel quality of the target syllables is the same, and both vowels are immediately preceded and followed by voiceless stops/affricates. These similarities should mitigate any potential contextual or vowel quality effects on duration. If stress is responsible for the durational difference rather than a compression effect, we expect to observe an effect size similar to the results of the larger lmer models from Section 4.1.1, in which the presence of stress correlated with about a 10 ms increase in vowel duration. Specifically, we expect the stressed penultimate vowel in [ˈpʌtʰ.re] to be about 10 ms longer than the unstressed penultimate vowel in [kʌ.ˈt͡sʌɽ]. Conversely, if compression effects were responsible for the observed effects in Section 4.1.1, this effect size should disappear between these two words.
Moreover, Waals (Reference Waals1999) argues that compression effects can occur syllable-internally, such that, all else equal, closed syllables will exhibit shorter vowel durations than open syllables. If correct, this compression effect at the syllable level would counteract any durational increases due to stress. As such, if penultimate vowels in [ˈpʌtʰ.re] are significantly longer than penultimate vowels in [kʌ.ˈt͡sʌɽ], it is likely that the effect is stress-related rather than caused by a compression effect.
Results of the lmer model are given in Table 21 and highlight that, as predicted if stress were giving rise to the durational increase, the unstressed penultimate vowel in [kʌ.ˈt͡sʌɽ] is indeed approximately 10 ms shorter than the stressed penultimate vowel in [ˈpʌtʰ.re]. This is consistent with the interpretation that stress is the root cause of the durational effect and contradicts the view that a compression effect lies behind the durational differences. In sum, while segments may compress durationally in proportion to the number of segments in a word, compression does not seem to explain the durational effects reported in this study.
Simple pairwise comparison lmer model comparing the effect of stress on duration between unstressed penultimate [kʌ.ˈt͡sʌɽ] and stressed penultimate [ˈpʌtʰ.re]: Duration~stress + (1|speaker)

Table 21 Long description
A table with four columns and two rows. The columns are labeled Factors, Estimate milliseconds, ninety-five percentage confidence interval, t-value, and p-value. The first row shows the intercept with an estimate of fifty-seven milliseconds, a confidence interval of fifty-two point seventy-eight to sixty point sixty-three, a t-value of twenty-eight point thirty-four, and a p-value of less than point zero zero one. The second row shows the effect of stress with an estimate of ten milliseconds, a confidence interval of seven point one one to thirteen point twenty-eight, a t-value of six point forty-eight, and a p-value of less than point zero zero one.
5.3 Correlates of focus-related prominence
Whereas duration was the only acoustic property found to consistently correlate with word-level stress, focus-related prominence correlates include all the acoustic properties measured in this study. We take it that the importance of highlighting new information in a dialogue requires the recruitment of a host of correlates to ensure the information is perceived correctly. While many studies have argued that f0 is the primary correlate of focus, acoustic properties seem to be mobilized across the board in Mankiyali to highlight the words in narrow focus.
Additionally, the difference in f0 between focused and non-focused constituents is smaller than we expected, but the effect size falls in line with other studies that measure the effect of narrow focus on f0. For instance, Greek shows a mean f0 difference of 8 Hertz between non-focused and focused constituents, and Hungarian shows a difference of 17 Hertz (Vogel et al., Reference Vogel, Athanasopoulou, Pincus, Heinz, Goedemans and Van der Hulst2016).
5.4 The Mankiyali stress criterion
As discussed earlier, Paramore (Reference Paramore2021) analyzes the Mankiyali stress system as involving three distinct levels of syllable weight: {CVː(C)} > {CVC(C)} > {CV}. In contrast, the present study hypothesized that Mankiyali stress is sensitive to a more fine-grained, five-level weight hierarchy: {CVːC} > {CVː} > {CVCC} > {CVC} > {CV}. Our goal was to determine whether the acoustic correlates of stress found in previously established weight distinctions (e.g., {CVC} > {CV}, {CVː} > {CVC}) also extend to weight distinctions that have not been previously reported (e.g., {CVːC} > {CVː} and {CVCC} > {CVC}). The results in Section 4.1.1 reveal a systematic relationship between vowel duration and the hypothesized stress scale. Specifically, we found significantly increased duration of penultimate vowels in {ˈCV.CV} words compared to {CV.ˈCVC} words, supporting the claim that {CVC} outweighs {CV}. Similarly, {ˈCVC.CV} words showed greater penultimate vowel duration than {CVC.ˈCVː} words, reinforcing that {CVː} outweighs {CVC}. Finally, {ˈCVː.CVː} words showed significantly greater penultimate vowel duration than {CVː.ˈCVːC} words, aligning with the hypothesis that {CVːC} > {CVː}.
While the magnitude of these durational effects alone is not sufficient to prove the proposed five-tiered stress scale, it does provide added support, especially when coupled with native speaker judgments about the placement of primary stress. This study, then, lends quantitative support to the impressionistic view that the Mankiyali stress criterion employs at least four levels of weight: {CVːC} > {CVː} > {CVCC, CVC} > {CV}.
Unfortunately, we were unable to find near minimal pairs of the shape {ˈCVC.CVC} vs. {CVC.ˈCVCC} to test whether {CVCC} outweighs {CVC}. Nevertheless, we assume that – if superheavy {CVːC} outweighs heavy {CVː} in the language – the same is true of superheavy {CVCC} outweighing heavy {CVC}. In sum, the data provided in this paper provides an empirical basis for analyzing Mankiyali’s stress system as containing five distinct levels of stress: {CVːC} > {CVː} > {CVCC} > {CVC} > {CV}. Such a scale is, to our knowledge, unattested in the world’s languages, so – while further research is needed to confirm these results – the Mankiyali stress system represents a unique system that is highly complex in its weight divisions.
6. Conclusion
This paper reported results from an experiment seeking to determine the acoustic correlates of word-level stress and focus-related prominence in Mankiyali. Tokens were analyzed in two sentence types, one in which the word was focused and the other in which the word was non-focused.
The results from the experiment reveal that duration is the sole acoustic property measured in this study found to consistently correlate with word-level stress across syllable types. For focus-related prominence, all acoustic properties measured covaried with its presence or absence. Moreover, we found weak evidence suggesting that different syllable structures call upon different acoustic properties to varying degrees to signal word-level stress.
Finally, the results of the present study lend support to a five-way stress criterion in Mankiyali: {CVːC} > {CVː} > {CVCC} > {CVC} > {CV}. Such a fine-grained and complex criterion is extremely rare and perhaps otherwise unattested cross-linguistically. As such, while further research is needed to confirm the conclusions drawn here, the Mankiyali stress system may extend the limits of how intricate weight-sensitive stress systems can be.
In terms of future directions, the analysis of focus-related prominence in the present study is limited in scope, exploring acoustic patterns in the domain of the stressed syllable rather than across entire sentences and phrases. In subsequent work, a detailed examination of intonational phrases and their associated boundaries, along with different kinds of focus-related prominence, should be performed. In addition, a perception study examining speakers’ sensitivity to the observed changes in duration in determining word-level stress placement is welcomed to add support to the findings presented here.
Acknowledgments
We are especially thankful to the Mankiyali speech community for working with us on this experiment. Extensive feedback from Ryan Bennett greatly improved the manuscript. Grant McGuire, Amanda Rysling, and the audience at FASAL 13 provided valuable input on the experimental design and analysis. We thank three anonymous reviewers and our editor, Dr. Patrycja Strycharczuk, whose insightful comments and thorough reviews strengthened the analysis, clarified the argumentation, and elevated the overall quality of the work. All remaining errors are our own.
Competing interests
The authors declare none.
Appendix: Token glosses, Leipzig glossing definitions, and full lmer models
Experiment tokens with glosses

Table A1 Long description
The table presents experiment tokens with their corresponding glosses. It is divided into four columns: Word, Gloss, Word, and Gloss. The table contains 33 rows, each row providing pairs of words and their glosses. The first column lists words in a specific language, followed by their glosses in the second column. The third and fourth columns repeat this pattern. Each row provides a unique pair of words and glosses, showcasing various linguistic elements and their meanings. The table aims to provide a clear and organized view of the experiment tokens and their glosses.
Leipzig Glossing Abbreviations
Abbreviations used throughout the paper follow the Leipzig Glossing Rules (LGR, http://www.eva.mpg.de/lingua/resources/glossing-rules.php ) and are summarized below.

Focus change lmer model
The following table provides the full lmer model from the analysis of focus change in Section 3.2 for speaker AZ1.
lmer model showing the effect of sentence type on the mean f0 of target word vowels for speaker AZ1: token_Meanf0 ∼ sʌŋɡi_Meanf0 + Focus + (1 | target_token)

Table A2 Long description
The table presents a linear mixed-effects model (lmer) analyzing the effect of sentence type on the mean fundamental frequency (f0) of target word vowels for speaker AZ1. It includes four rows and five columns. The columns are labeled Factors, Estimate (Hz), 95% CI, t-value, and p-value. The factors analyzed are Intercept (grand mu), Focused target vowel, Non-focused target vowel, and [si] mean f0. The Intercept has an estimate of 152 hertz with a 95% confidence interval of 148 to 156 hertz, a t-value of 67.35, and a p-value of less than 0.001. The Focused target vowel has an estimate of 8 hertz with a 95% confidence interval of 6 to 10 hertz, a t-value of 9.81, and a p-value of less than 0.001. The Non-focused target vowel has an estimate of negative 8 hertz with a 95% confidence interval of negative 10 to negative 6 hertz, a t-value of negative 9.81, and a p-value of less than 0.001. The [si] mean f0 has an estimate of 0.63 hertz with a 95% confidence interval of 0.36 to 0.89 hertz, a t-value of 4.60, and a p-value of less than 0.001.
z-scored lmer models
The following z-scored lmer models correspond to the lmer models analyzing raw values of peak intensity in Section 4.2.2 and raw values of spectral tilt in Section 4.2.3.
z-scored pairwise comparison lmer model showing the effect focus on Peak Intensity: PeakIntensity∼focus + (1 + focus|speaker) + (1|target.syllable)

Table A3 Long description
The table presents a z-scored pairwise comparison linear mixed-effects model analyzing the effect of focus on Peak Intensity and Spectral Tilt. The table has two sections, each with four rows and five columns. The columns are labeled Factors, Estimate (z-scored over dB), 95% CI, t-value, and p-value. The first section focuses on Peak Intensity with factors Intercept (non-focused) and focused. The Intercept (non-focused) has an estimate of .4, a 95% confidence interval of [.63, .16], a t-value of 3.3, and a p-value of .003. The focused factor has an estimate of .89, a 95% confidence interval of [.79, .99], a t-value of 17.08, and a p-value of less than .001. The second section focuses on Spectral Tilt with similar factors. The Intercept (non-focused) has an estimate of .10, a 95% confidence interval of [.43, .23], a t-value of .58, and a p-value of .57. The focused factor has an estimate of .32, a 95% confidence interval of [.25, .40], a t-value of 8.36, and a p-value of less than .001.
z-scored pairwise comparison lmer model showing the effect focus on Spectral Tilt: SpectralTilt∼focus + (1 + focus|speaker) + (1|target.syllable)

Table A4 Long description
The table presents a z-scored pairwise comparison linear mixed-effects model analyzing the effect of focus on spectral tilt. It includes four rows and five columns. The columns are labeled Factors, Estimate (z-scored over dB per Hertz), 95% CI, t-value, and p-value. The rows are labeled Intercept (non-focused) and focused. For the Intercept (non-focused), the estimate is 0.10 with a 95% confidence interval of -0.43 to 0.23, a t-value of 0.58, and a p-value of 0.57. For the focused condition, the estimate is 0.32 with a 95% confidence interval of 0.25 to 0.40, a t-value of 8.36, and a p-value of less than 0.001, indicating a statistically significant effect. The model includes random effects for speaker and target syllable.
Visuals and lmers grouped by syllable type and near-minimal pairs for word-level duration
Each plot visualizes a comparison between unstressed vs. stressed near-minimal pairs for one of the five syllable types. The total count of each token is provided above the corresponding boxplot. Near-minimal pairs are labeled based on their similar target syllable, as shown in Table A5. Pairwise comparison lmer tables for each set of near-minimal pairs in a syllable type are provided below each plot. The following model specification was used for all lmer models comparing near-minimal pairs: Duration∼stress + (1|speaker).
Twenty-five sets of near-minimal pairs. The target syllable for each token is in bold, and the notation used in the below plots and lmers for each set of near-minimal pairs is placed to the left of each set

Table A5 Long description
A table presenting twenty-five sets of near-minimal pairs of syllables, focusing on unstressed versus stressed variations. Each set is labeled with a specific notation and includes a target syllable in bold. The table is divided into sections for different syllable types: CV, CVC, CV:, and CV:CC. Each row lists the syllable pairs and their corresponding statistical analysis using linear mixed-effects models (lmers). The table provides a detailed comparison of syllable durations under different stress conditions, with each token's count indicated. The analysis aims to highlight the differences in duration between stressed and unstressed syllables across various syllable structures.
Boxplots comparing stressed and unstressed CV syllables within near-minimal pairs.

Figure A1 Long description
The box-and-whisker plot compares stressed and unstressed CV syllables within near-minimal pairs. The x-axis represents different CV near-minimal pairs labeled as jΛ, kᵊʰΛ, kΛ, mΛ, and tsu. The y-axis represents the duration in z-scores over milliseconds, ranging from -2.0 to 0.5. Each pair has two box plots: one for unstressed syllables in yellow and one for stressed syllables in blue. The unstressed syllables generally have lower median values compared to the stressed syllables. For jΛ, the unstressed median is around -1.0, while the stressed median is around -0.5. For kᵊʰΛ, the unstressed median is around -1.5, and the stressed median is around -1.0. For kΛ, the unstressed median is around -1.0, and the stressed median is around -0.5. For mΛ, the unstressed median is around -0.5, and the stressed median is around 0.0. For tsu, the unstressed median is around -1.5, and the stressed median is around -1.0. Outliers are present in several categories, particularly in the unstressed jΛ and kΛ pairs. The plot highlights the differences in duration between stressed and unstressed syllables across various CV pairs.
Pairwise comparisons showing the effect of stress on CV syllables within near-minimal pairs.

Table A6 Long description
The table presents pairwise comparisons of the effect of stress on CV syllables within near-minimal pairs. It includes five factors: kA, kʰA, mA, jA, and tsu, each with an intercept for unstressed and stressed conditions. The table has six columns: Factors, Estimate in milliseconds, 95% Confidence Interval, t-value, and p-value. Each row provides data for unstressed and stressed conditions. For example, the estimate for unstressed kA is 57 milliseconds with a 95% confidence interval of 52.84 to 60.58, a t-value of 28.72, and a p-value of less than 0.001. The stressed kA has an estimate of 7 milliseconds with a 95% confidence interval of 4.87 to 9.61, a t-value of 5.99, and a p-value of less than 0.001. Similar data is presented for other factors, showing the impact of stress on each syllable type.
Boxplots comparing stressed and unstressed CVC syllables within near-minimal pairs.

Figure A2 Long description
A box-and-whisker plot compares stressed and unstressed CVC syllables within near-minimal pairs. The plot features four vertical box plots, each representing different CVC near-minimal pairs. The x-axis labels these pairs as gA[ with values 54 for unstressed and 48 for stressed, kut with values 65 for unstressed and 40 for stressed, mus with values 60 for unstressed and 43 for stressed, and pATh with values 63 for unstressed and 50 for stressed. The y-axis measures duration in z-scores over milliseconds, ranging from -2 to 2. Each box plot shows the distribution of durations for unstressed and stressed syllables, with unstressed syllables in yellow and stressed syllables in blue. The median, lower quartile, and upper quartile are indicated within each box, while the whiskers extend to the minimum and maximum values, excluding outliers. Outliers are marked as individual points beyond the whiskers. The unstressed syllables generally show higher median values compared to the stressed syllables across all pairs. All values are approximated.
Pairwise comparisons showing the effect of stress on CVC syllables within near-minimal pairs

Table A7 Long description
The table presents pairwise comparisons of the effect of stress on CVC syllables within near-minimal pairs. It includes four rows for each syllable type: unstressed and stressed conditions. The columns are labeled Factors, Estimate in milliseconds, ninety-five percentage Confidence Interval, t-value, and p-value. The first row shows the intercept for unstressed gA, with an estimate of seventy-nine milliseconds, a confidence interval of seventy-four point four-seven to eighty-four point zero-one, a t-value of thirty-two point five-six, and a p-value of less than point zero-zero-one. The second row shows the stressed gA, with an estimate of seven milliseconds, a confidence interval of three point nine-seven to nine point one-four, a t-value of four point nine-seven, and a p-value of less than point zero-zero-one. The third row shows the intercept for unstressed kut, with an estimate of forty-three milliseconds, a confidence interval of thirty-eight point eight-seven to forty-six point seven-six, a t-value of twenty-one point two-six, and a p-value of less than point zero-zero-one. The fourth row shows the stressed kut, with an estimate of eleven milliseconds, a confidence interval of eight point four-five to thirteen point nine, a t-value of eight point zero-four, and a p-value of less than point zero-zero-one. The fifth row shows the intercept for unstressed mus, with an estimate of fifty-three milliseconds, a confidence interval of forty-eight point seven-two to fifty-six point nine-four, a t-value of twenty-five point two, and a p-value of less than point zero-zero-one. The sixth row shows the stressed mus, with an estimate of eleven milliseconds, a confidence interval of seven point four-nine to fourteen point six-nine, a t-value of six point zero-three, and a p-value of less than point zero-zero-one. The seventh row shows the intercept for unstressed pAt, with an estimate of fifty-five milliseconds, a confidence interval of fifty point four-eight to fifty-nine point three-nine, a t-value of twenty-four point one-six, and a p-value of less than point zero-zero-one. The eighth row shows the stressed pAt, with an estimate of twelve milliseconds, a confidence interval of eight point four-nine to fourteen point six-two, a t-value of seven point three-nine, and a p-value of less than point zero-zero-one.
Boxplots comparing stressed and unstressed CVCC syllables within near-minimal pairs.

Figure A3 Long description
The box-and-whisker plot compares the duration of stressed and unstressed CVCC syllables within near-minimal pairs. The x-axis represents different CVCC near-minimal pairs, and the y-axis represents the duration in z-scores over milliseconds. There are five pairs of box plots, each pair consisting of a yellow box for unstressed syllables and a blue box for stressed syllables. Each box plot shows the median, lower quartile, and upper quartile values. The whiskers extend to the minimum and maximum values, and outliers are marked as individual points. The unstressed syllables generally have a wider range of durations compared to the stressed syllables. The specific pairs include d3ant, gand, ist, mist, and sang. The numbers above each box plot indicate the sample size for each category. All values are approximated.
Pairwise comparisons showing the effect of stress on CVCC syllables within near-minimal pairs

Table A8 Long description
The table presents pairwise comparisons of the effect of stress on CVCC syllables within near-minimal pairs. It includes eight rows and five columns. The columns are labeled Factors, Estimate in milliseconds, ninety-five percent confidence interval, t-value, and p-value. The rows detail the intercept and stressed conditions for different syllables: d3ant, gand, ist, mist, and sang. Each row provides specific values for the estimate, confidence interval, t-value, and p-value. Notable trends include significant p-values for all stressed conditions, indicating a clear effect of stress on the syllables. The estimates range from seven to fourteen milliseconds for stressed conditions, with corresponding confidence intervals and t-values provided.
Boxplots comparing stressed and unstressed CVː syllables within near-minimal pairs.

Figure A4 Long description
The box-and-whisker plot compares the duration of stressed and unstressed CV syllables within near-minimal pairs. The x-axis represents different CV pairs labeled as be:, de:, ka:, pe:, and tfe:. The y-axis represents the duration in z-scores over milliseconds. Each pair has two box plots, one for unstressed syllables in yellow and one for stressed syllables in blue. The unstressed syllables have median values of approximately 0.5 for be:, 0.3 for de:, 0.4 for ka:, 0.2 for pe:, and 0.3 for tfe:. The stressed syllables have median values of approximately 1.0 for be:, 0.7 for de:, 1.0 for ka:, 0.5 for pe:, and 0.7 for tfe:. The plot shows that stressed syllables generally have higher durations than unstressed syllables. Outliers are present in several categories, indicating some variability in the data. The whiskers and interquartile ranges vary across the different CV pairs, highlighting differences in the distribution of durations. All values are approximated.
Pairwise comparisons showing the effect of stress on CVː syllables within near-minimal pairs

Table A9 Long description
The table presents pairwise comparisons showing the effect of stress on CV syllables within near-minimal pairs. It includes four rows and five columns. The columns are labeled Factors, Estimate milliseconds, ninety-five percentage Confidence Interval, t-value, and p-value. The rows compare the intercept and stressed conditions for different syllables: be, e, ka, pe, and tfe. Each row provides the estimate in milliseconds, the ninety-five percentage confidence interval range, the t-value, and the p-value. Notable trends include significant p-values for all stressed conditions, indicating a clear effect of stress on the CV syllables. The estimates and confidence intervals vary across different syllables, showing the specific impact of stress on each.
Boxplots comparing stressed and unstressed CVːC syllables within near-minimal pairs.

Figure A5 Long description
The box-and-whisker plot compares stressed and unstressed CVC syllables within near-minimal pairs. The x-axis represents different CVC near-minimal pairs, including da:r, nga:r, o(n)da:r, va:ŋ, and zda:r. The y-axis represents the duration in z-scores over milliseconds. Each pair has two box plots: one for unstressed syllables in yellow and one for stressed syllables in blue. The unstressed syllables have median values of approximately 1.0 for da:r, 0.75 for nga:r, 0.75 for o(n)da:r, 0.5 for va:ŋ, and 0.75 for zda:r. The stressed syllables have median values of approximately 1.25 for da:r, 1.25 for nga:r, 1.25 for o(n)da:r, 1.0 for va:ŋ, and 1.25 for zda:r. The interquartile ranges vary, with stressed syllables generally showing a wider range. Outliers are present in some categories, particularly for unstressed syllables. The plot highlights differences in duration between stressed and unstressed syllables across different pairs.
Pairwise comparisons showing the effect of stress on CVːC syllables within near-minimal pairs

Table A10 Long description
The table presents pairwise comparisons of the effect of stress on CVC syllables within near-minimal pairs. It includes eight rows and five columns, with headers labeled Factors, Estimate milliseconds, ninety-five percentage confidence interval, t-value, and p-value. The factors include intercepts and stressed conditions for different syllable types: da:r, nga:r, o n da:r, va:n, and zda:r. Each row provides the estimate in milliseconds, the ninety-five percentage confidence interval range, the t-value, and the p-value for the stressed condition compared to the unstressed intercept. Notable trends include significant p-values for all stressed conditions, indicating a clear effect of stress on the syllables. The estimates range from ten to nineteen milliseconds, with varying confidence intervals and t-values.
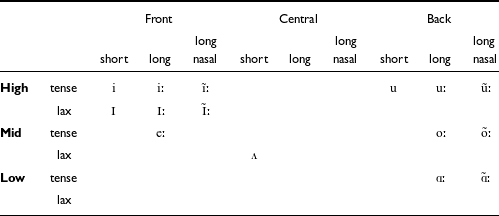
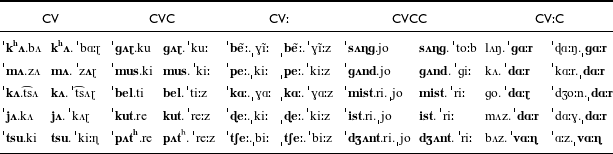

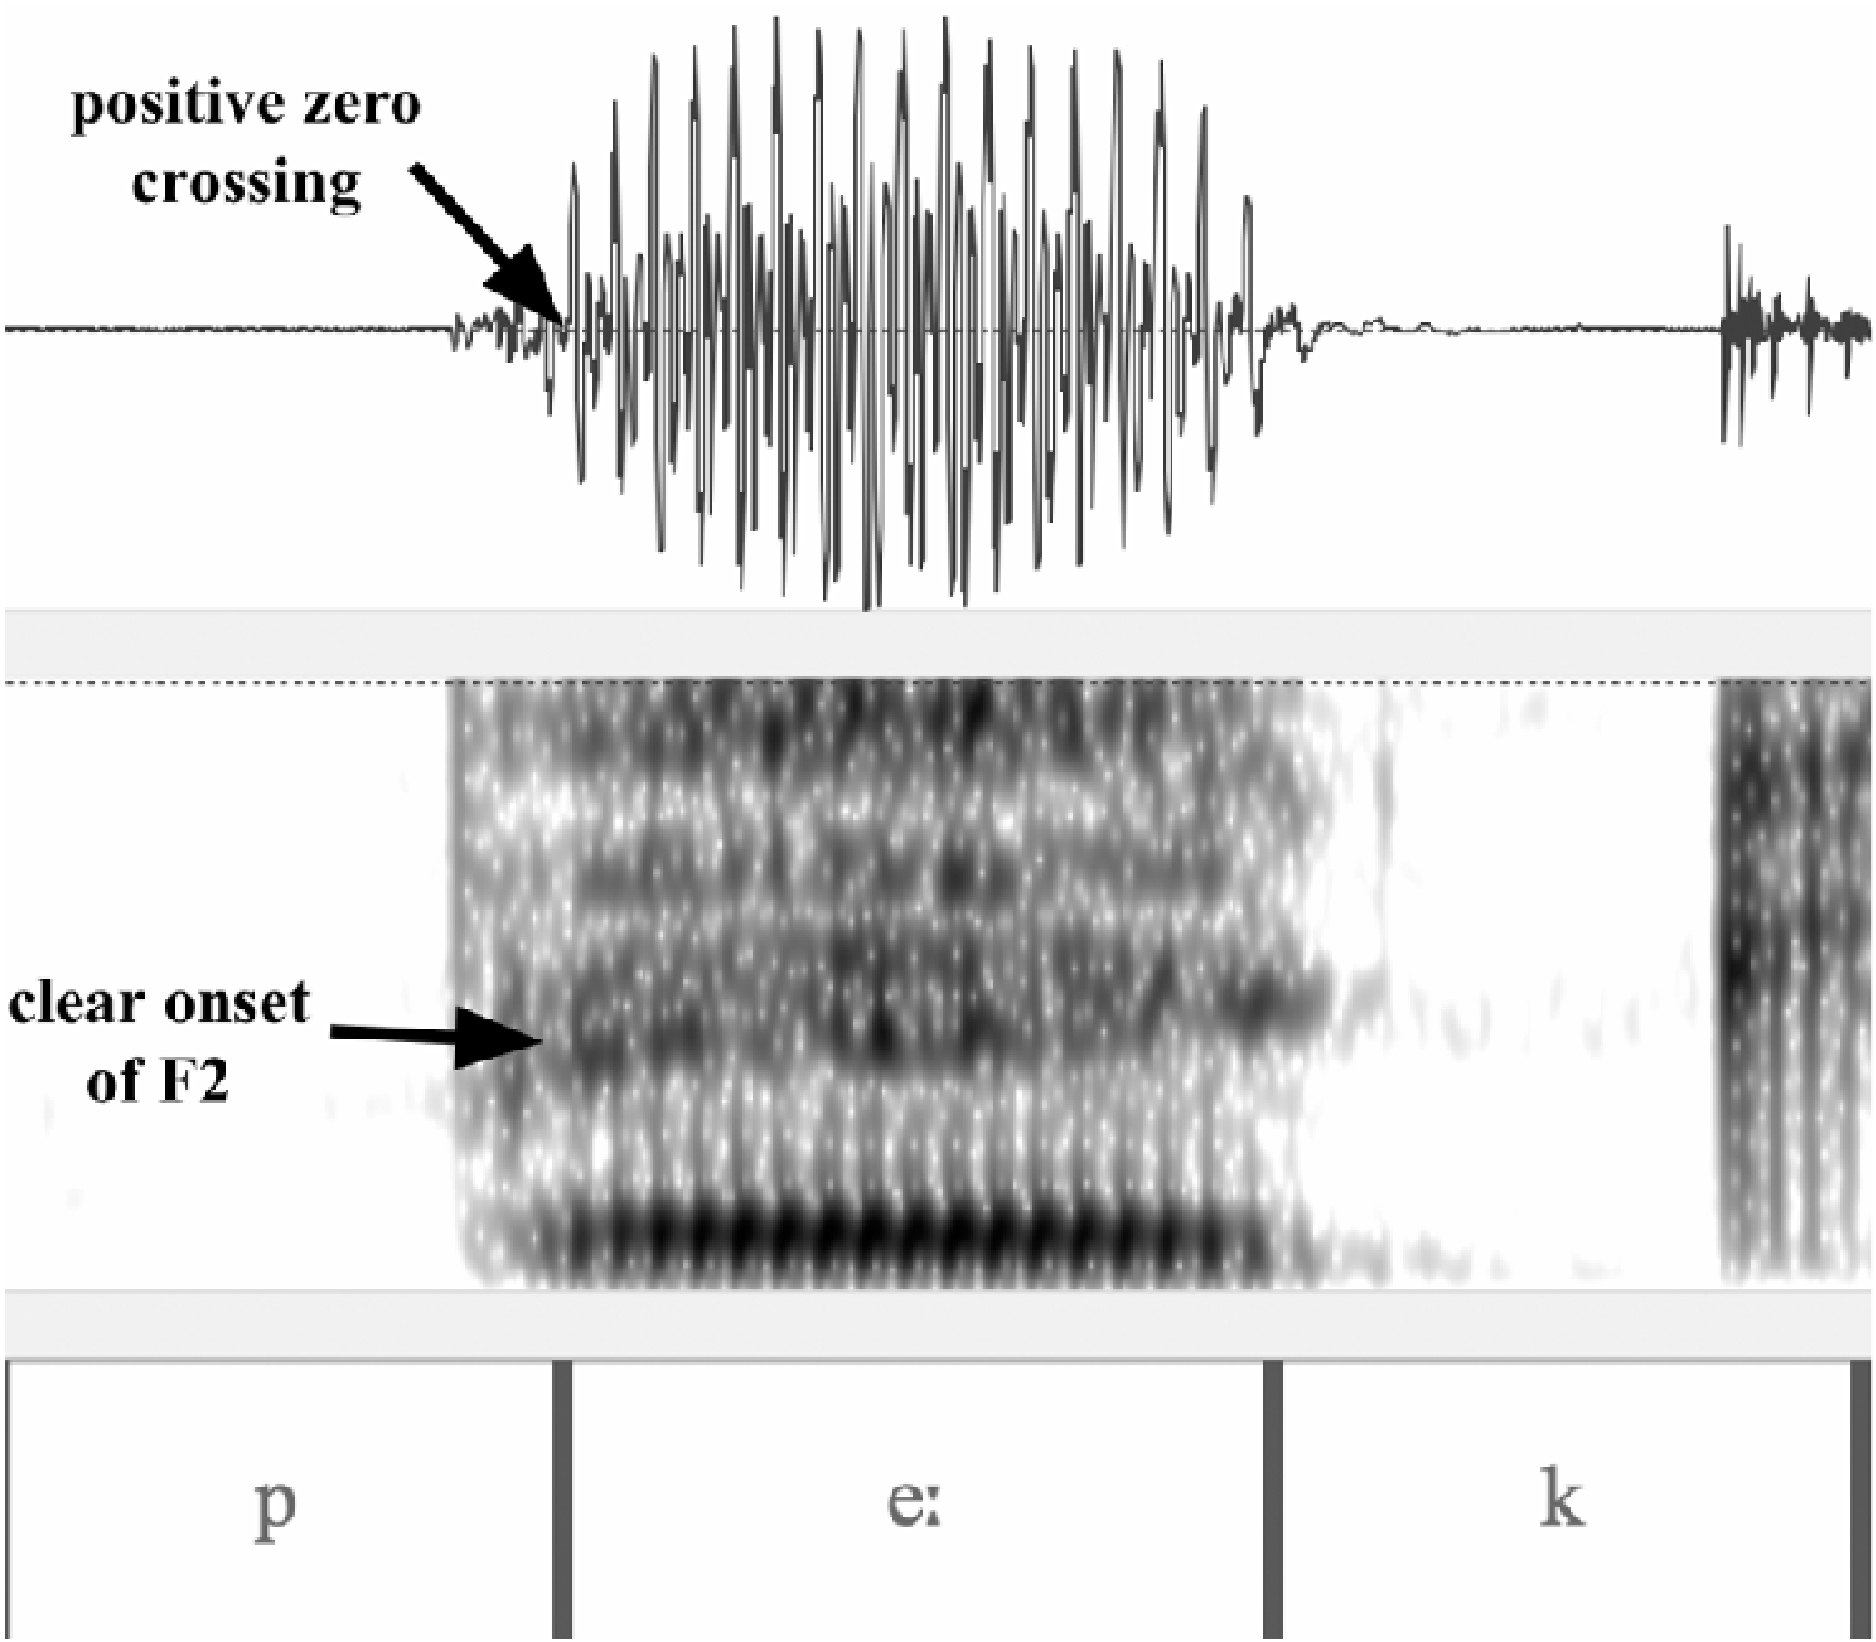
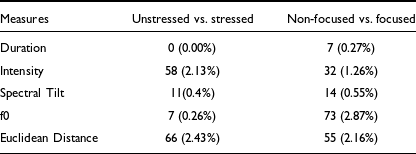
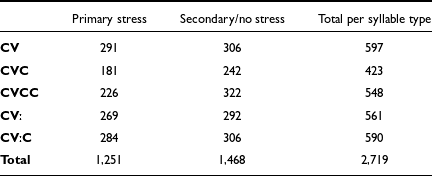
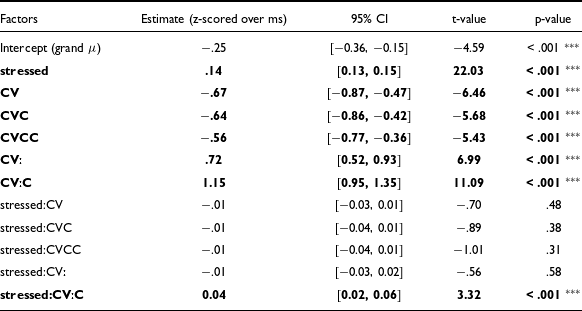
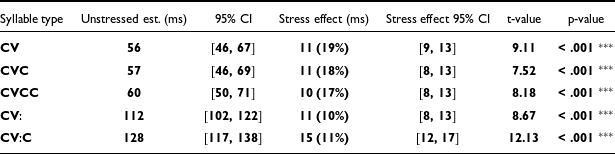

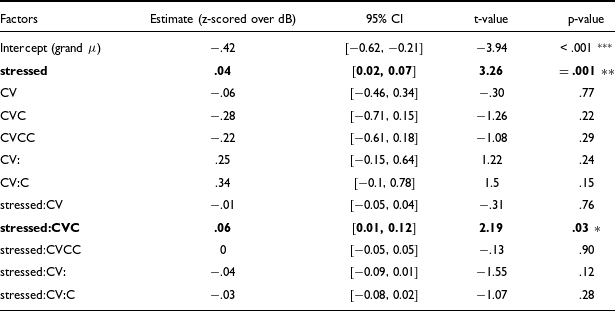
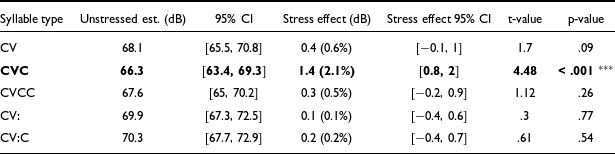

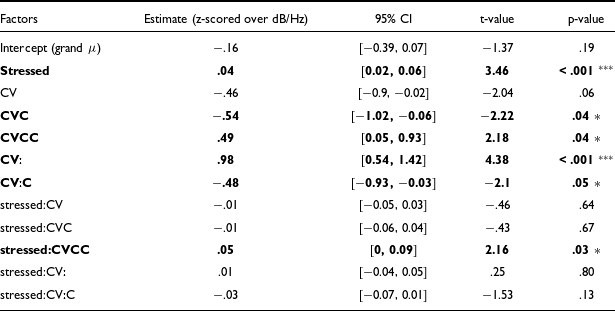
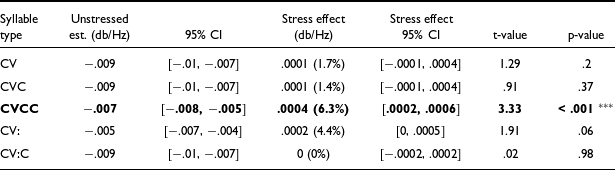


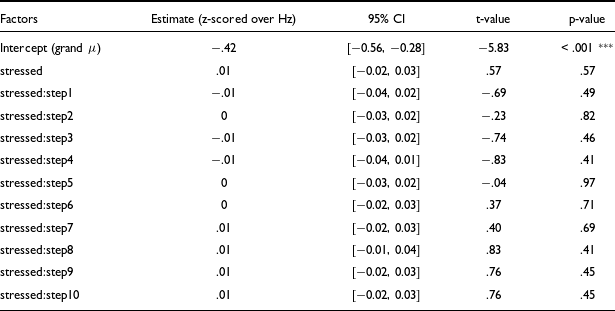
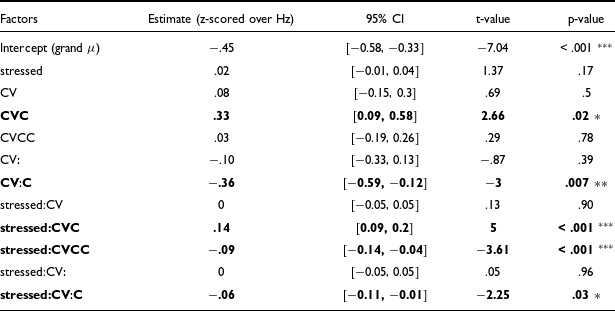
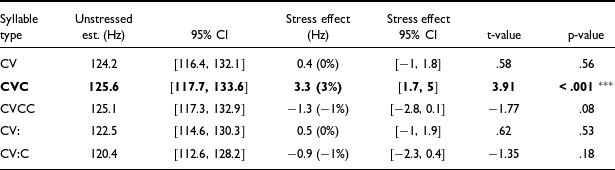
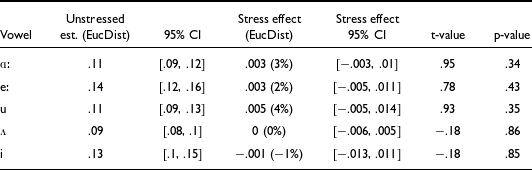


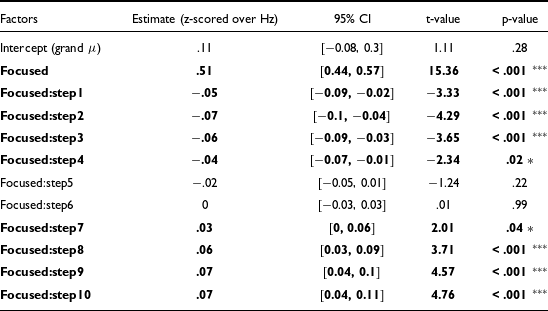
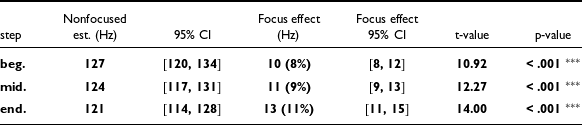


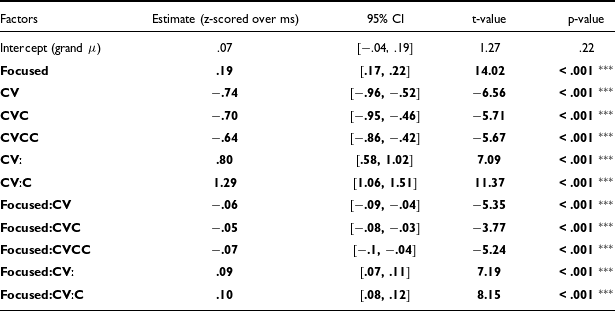
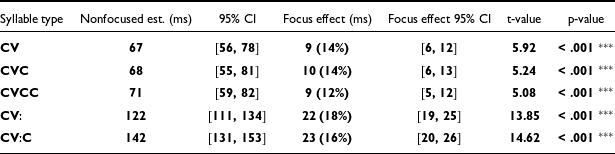

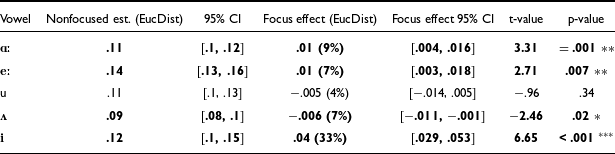

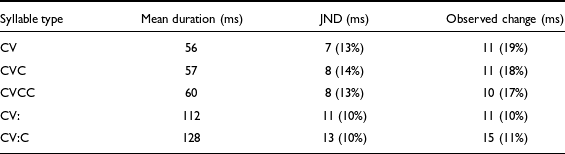
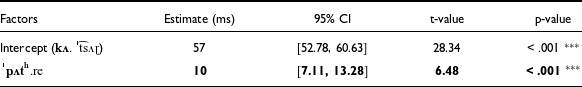
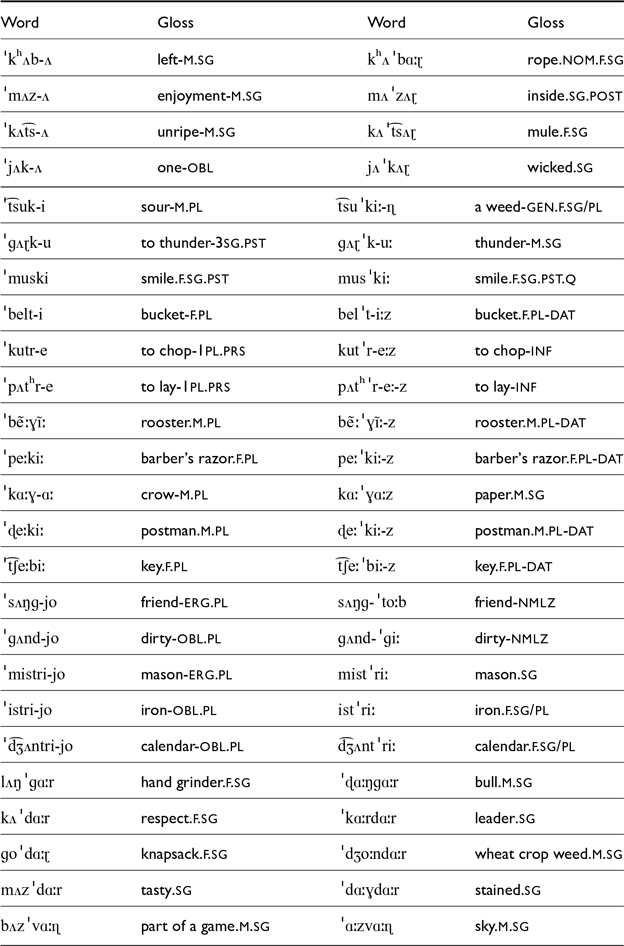
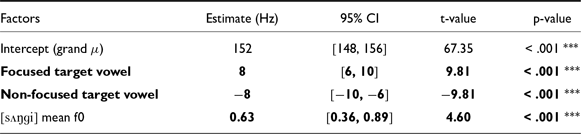
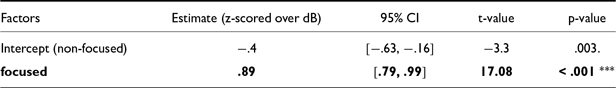
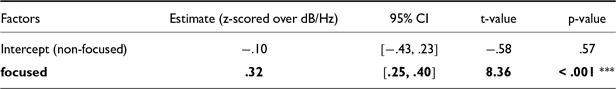
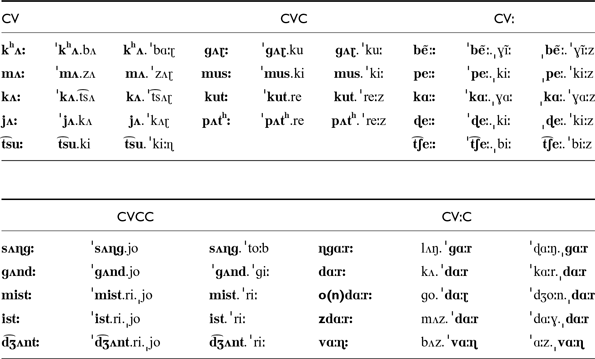
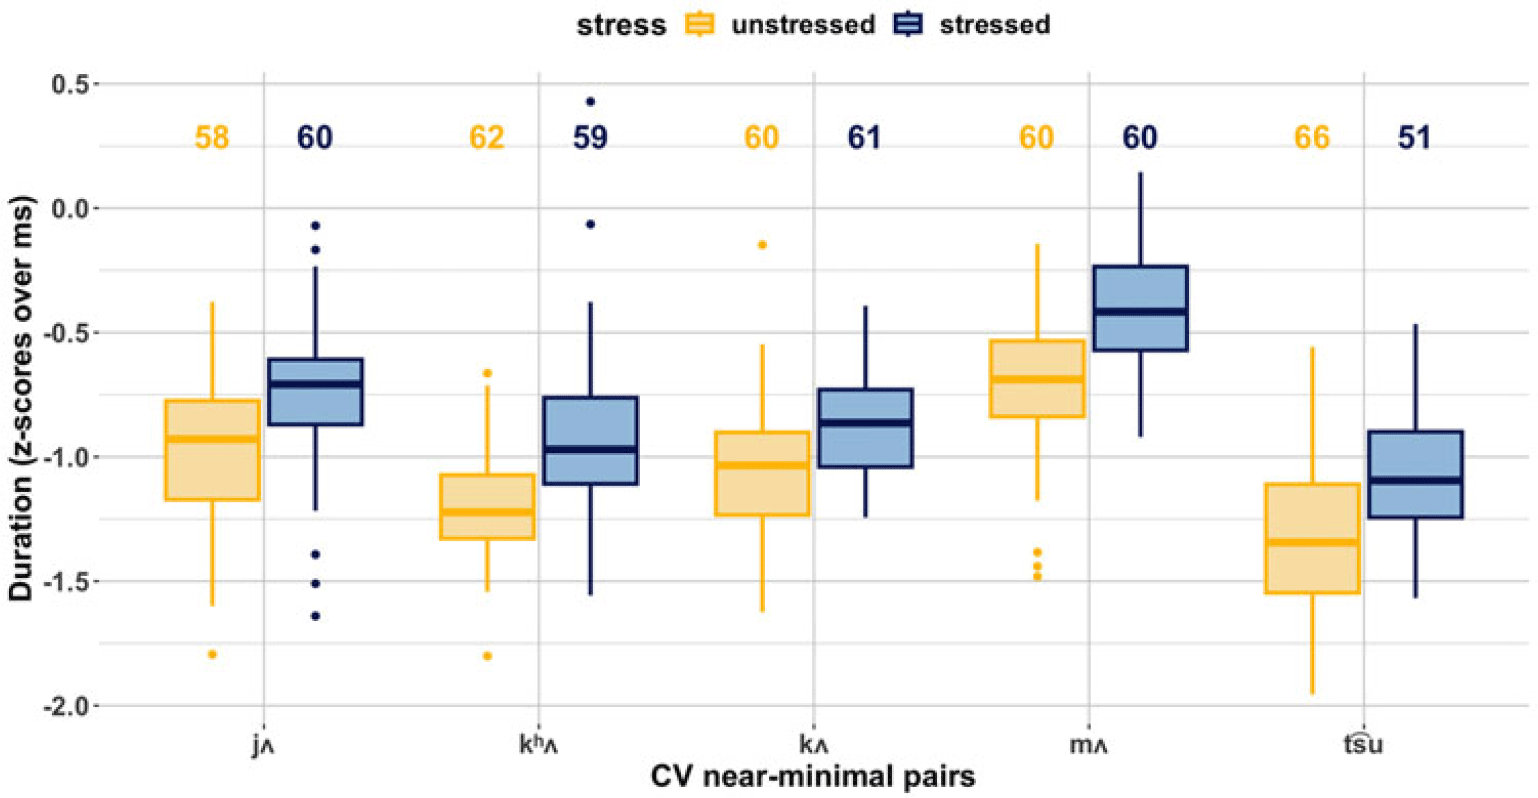
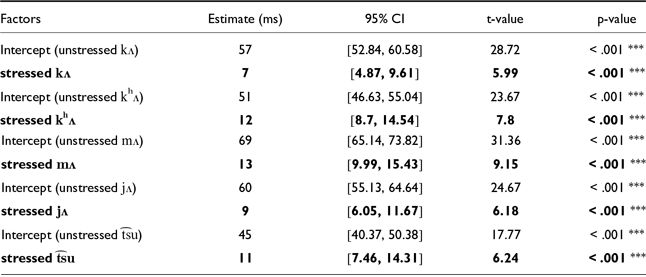
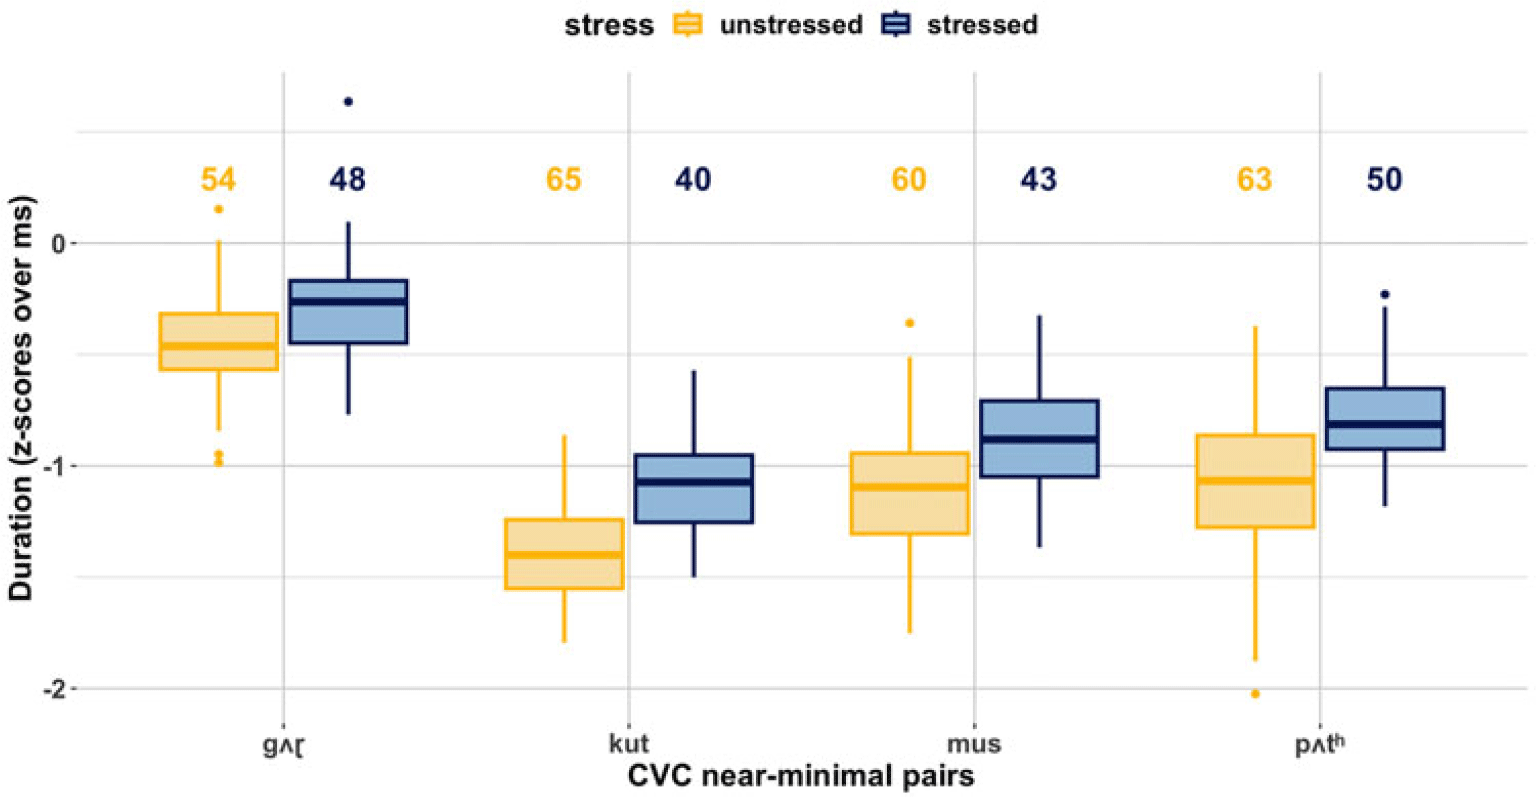
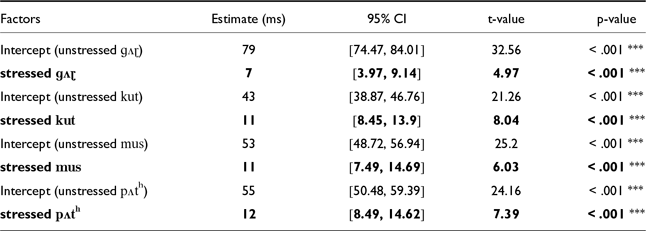
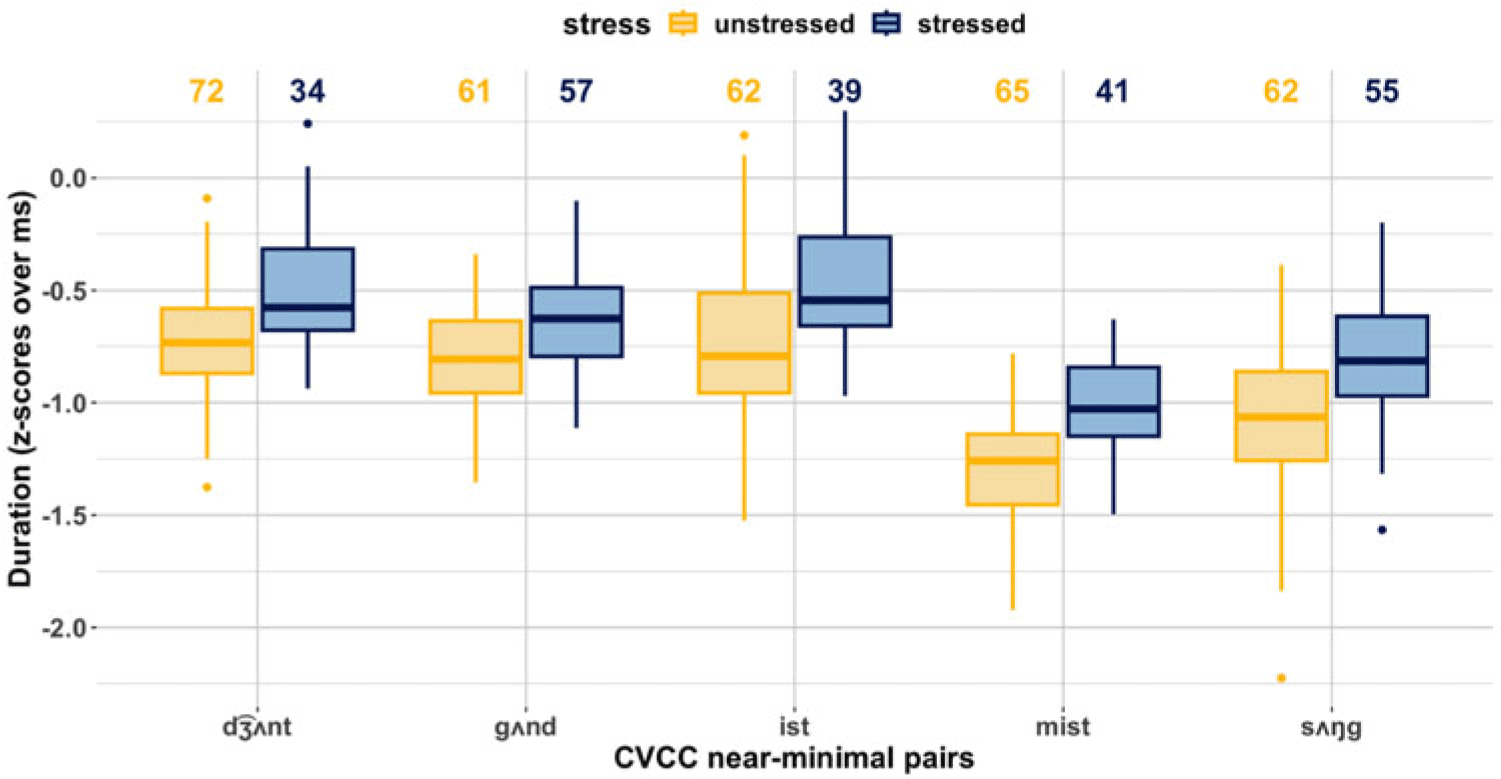
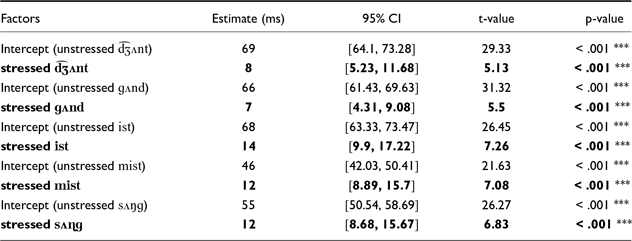
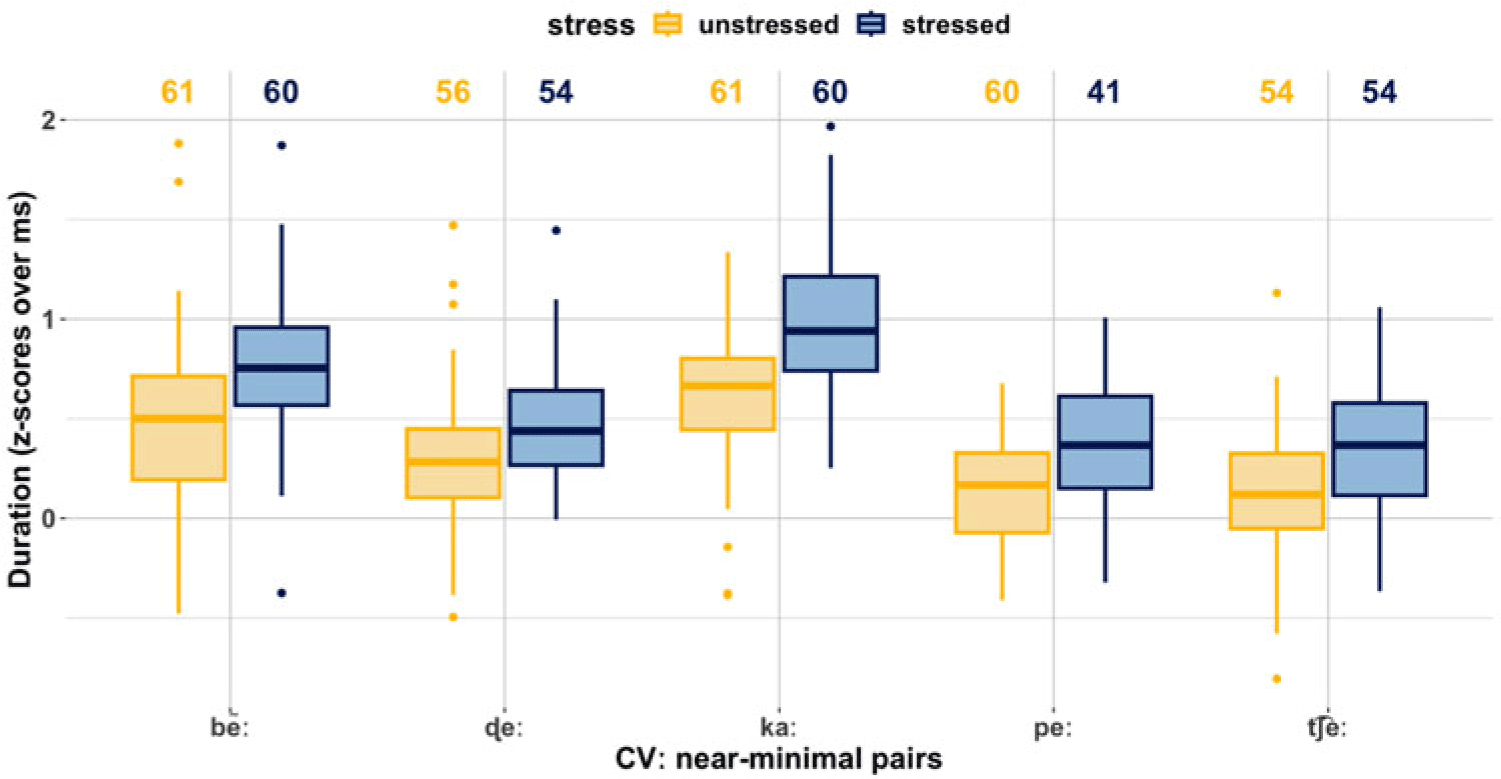
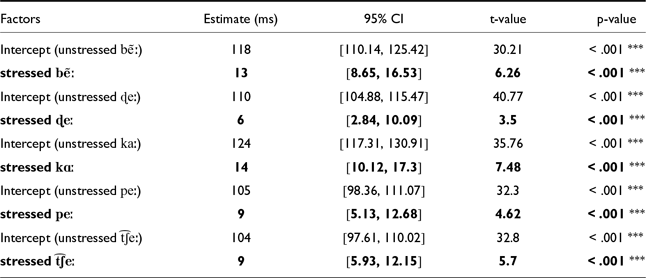
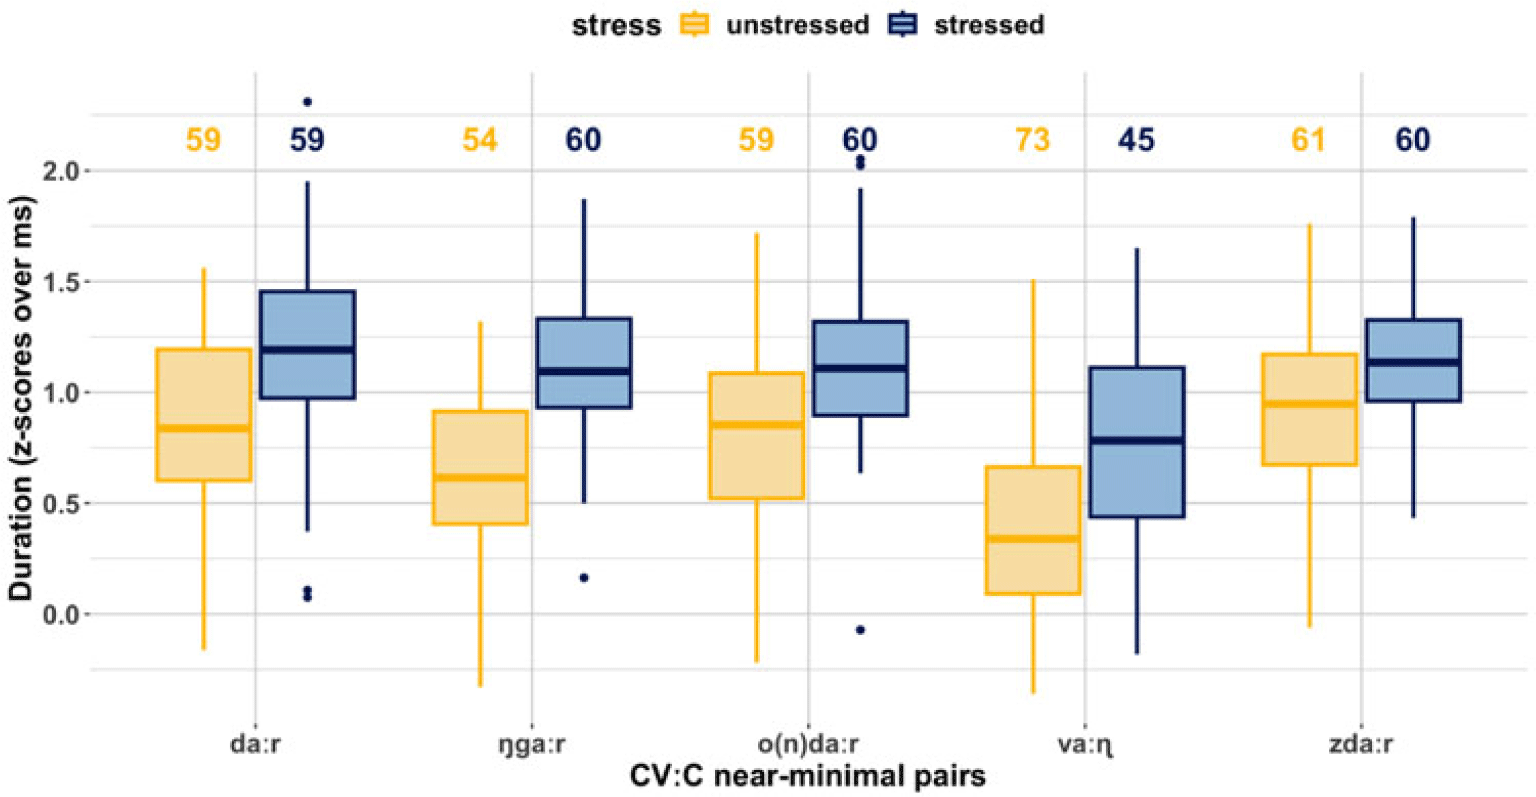
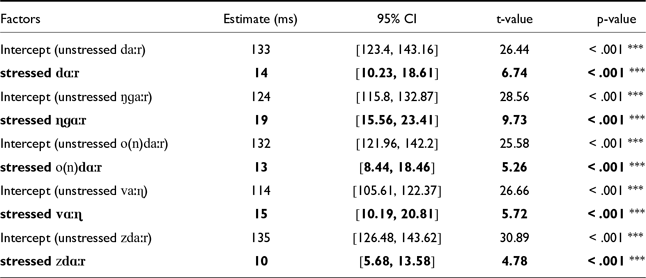

 Open access