

INTRODUCTION
Multiple sclerosis (MS) is a cell-mediated autoimmune demyelinating disease of the central nervous system (Lubetzki et al., Reference Lubetzki, Williams and Stankoff2005; Marrie, Reference Marrie2004) thought to be associated with progressive cognitive decline (Kujala et al., Reference Kujala, Portin and Ruutiainen1997; Rao, Reference Rao1996). Charcot first observed cognitive slowing as a feature of MS in the nineteenth century (Charcot, Reference Charcot1877). Slowed information processing speed is widely reported in the literature as the primary neuropsychological feature of MS (Achiron et al., Reference Achiron, Polliak, Rao, Barak, Lavie, Appelboim and Harel2005; Archibald and Fisk, Reference Archibald and Fisk2000; Brassington and Marsh, Reference Brassington and Marsh1998; De Sonneville et al., Reference De Sonneville, Boringa, Reuling, Lazeron, Ader and Polman2002; DeLuca et al., Reference DeLuca, Chelune, Tulsky, Lengenfelder and Chiaravalloti2004; Marrie, Reference Marrie2004; Parmenter et al., Reference Parmenter, Schucard and Schucard2007; Rao et al., Reference Rao, Aubin-Faubert and Leo1989; Rao, Reference Rao1996; Zakzanis, Reference Zakzanis2000). The neuropathological mechanism is thought to involve widespread cortical and subcortical lesions; total lesion load has been found to be positively correlated with attentional, memory and executive functioning impairments (Hohol et al., Reference Hohol, Guttmann, Orav, Mackin, Kikinis, Khoury, Jolesz and Weiner1997; Kieseier et al., Reference Kieseier, Hemmer and Hartung2005; Walker et al., Reference Walker, Della Malva, Freedman, Tellier and Collins2001). White matter lesion prevalence is thought to potentially account for all of the age-related variance between individuals in tests of speed and executive ability (Rabbitt et al., Reference Rabbitt, Scott, Lunn, Thacker, Lowe, Pendleton, Horan and Jackson2007). As De Sonneville et al. (Reference De Sonneville, Boringa, Reuling, Lazeron, Ader and Polman2002) discuss, the widespread demyelination in MS is likely to interfere with distributed neural networks in both cortical and subcortical structures of the brain. Attentional functions that rely on complex neural circuitry are therefore particularly vulnerable to the impact of demyelination (De Sonneville et al., Reference De Sonneville, Boringa, Reuling, Lazeron, Ader and Polman2002).
Several studies have suggested that impairment of selective attention and executive functioning are common in people with MS (Arnett et al., Reference Arnett, Rao, Grafman, Bernardin, Luchetta, Binder and Lobeck1997; Kujala et al., Reference Kujala, Portin, Revonsuo and Ruutiainen1995; Rao et al., Reference Rao, Leo, Bernardin and Unverzagt1991; Vitkovitch et al., Reference Vitkovitch, Bishop, Dancey and Richards2002). However, the interpretation of these findings is unclear. This is particularly evident in the literature surrounding the reportedly enhanced interference effect in the Stroop paradigm in people with MS. This effect is variously attributed to impairment in information processing (Denney et al., Reference Denney, Lynch, Parmenter and Horne2004, Reference Denney, Sworowski and Lynch2005), selective attention (MacLeod and MacDonald, Reference MacLeod and MacDonald2000; Perlstein et al., Reference Perlstein, Carter, Barch and Baird1998; Vitkovitch et al., Reference Vitkovitch, Bishop, Dancey and Richards2002) or executive functioning (Foong et al., Reference Foong, Rozewicz, Quaghebeur, Davie, Kartsounis, Thompson, Miller and Ron1997).
The Stroop technique was first established in the 1930s (Stroop, Reference Stroop1935) following work in the late nineteenth century into interference and inhibition effects (Münsterberg, Reference Münsterberg1892). Several competing explanations have been offered for defective performance on the Stroop test. According to one interpretation, the test is sensitive to impaired concentration and difficulty in warding off distractions (Lezak et al., Reference Lezak, Howieson, Loring, Hannay and Fischer2004). Other researchers see deficits in this test as indicative of impaired response inhibition/inhibitory control of interference (i.e., an impairment of executive function; Dempster, Reference Dempster, Dempster and Brainerd1995) or impaired selective attention (Vitkovitch et al., Reference Vitkovitch, Bishop, Dancey and Richards2002). Pujol et al. (Reference Pujol, Vendrell, Deus, Junqué, Bello, Martí-Vilalta and Capdevila2001) report neuroimaging evidence that the time variance and interference components of the Stroop test have divergent neuroanatomical correlates.
Myerson et al. (Reference Myerson, Hale, Zheng, Jenkins and Widaman2003), in their research into timed cognition, offer an innovative approach with potential application to investigation of the Stroop phenomenon. They present the “difference engine”: a theory of diversity in speeded cognition in which information processing is seen as a series of generic computational steps. The authors argue that most of the variance in individual speeded performance may be explained by a single general factor on which diverse tasks load approximately equally (Myerson et al., Reference Myerson, Hale, Zheng, Jenkins and Widaman2003). Hale and Jansen (Reference Hale and Jansen1994) previously found that if a task is speeded, its other characteristics may be much less important in predicting the position of an individual's score in standard deviation (SD) units. The key finding from this study, confirmed by Myerson et al. (Reference Myerson, Hale, Zheng, Jenkins and Widaman2003), was that, as the group mean reaction time (RT) for all tasks increases, the difference between the fastest and slowest subgroups of processors also increases. Group mean RT is seen by this approach to indicate task difficulty; as any task increases in difficulty, the group mean RT increases. By this rationale, it could be argued that enhanced Stroop RTs may arise largely as a consequence of slowed information processing, either due to normal ageing or to a disease process such as MS. As Verhaeghen and De Meersman (Reference Verhaeghen and De Meersman1998) suggest, the apparent age sensitivity of the Stroop effect may be an artifact of general slowing. Establishing that elevated RTs for the Stroop test can be predicted by performance on tests of information processing speed could swing the argument in favor of impaired Stroop performance in people with MS being due to a general slowing of information processing rather than impaired executive functioning or selective attention.
An important practical implication of the approach by Myerson et al. (Reference Myerson, Hale, Zheng, Jenkins and Widaman2003) is that it allows RTs on disparate cognitive tasks to be placed on a common scale of “difficulty.” For example, in a study of cognitive slowing in middle age, Myerson et al. (Reference Myerson, Hale, Hischmann, Hansen and Christiansen1989) first administered several complex discrimination tasks to a group of healthy young volunteers, before testing a group of middle-aged participants on the same tasks. The RTs generated by the middle-aged participants were then plotted against the corresponding RTs of the younger “reference” group, revealing strictly linear functions with slopes greater than 1.0. In this method, the RTs of the reference group thus served as a scale of task difficulty, the slope of the linear function providing an index of information processing speed, relative to that of the reference group; the steeper the slope, the slower the relative information processing speed.
Davis et al. (Reference Davis, Langley, Ho, Bradshaw and Szabadi2000a) described a test, the Graded Conditional Discrimination Tasks (GCDT), which they used to evaluate the speed of information processing of 301 healthy volunteers. The test, based on a choice RT paradigm, uses graded complexity to derive a linear function for the performance of each individual participant. The slopes of this linear function were found to be positively correlated with age and negatively correlated with performance on word reading tests. Wogar et al. (Reference Wogar, van den Broek, Bradshaw and Szabadi1998) used the same test in an investigation of organically based and simulated cognitive impairment, and found that organically based impairment, but not simulated impairment, was associated with steepening of the linear RT function. The test has been used clinically by the authors of the present study to evaluate information processing speed in patients with MS.
The present study aimed to replicate previous findings that people with MS have impaired Stroop performance compared with age- and predicted premorbid IQ-matched healthy control participants. A second aim of the study was to evaluate the hypothesis that controlling for information processing speed may eliminate the group difference in RT on the Stroop test between people with MS and age- and predicted premorbid IQ-matched healthy controls.
METHOD
Participants
Twenty-five patients with clinical diagnoses of multiple sclerosis, given by the referring Consultant Neurologist (using McDonald criteria) (McDonald et al., Reference McDonald, Compston, Edan, Goodkin, Hartung, Lublin, McFarland, Paty, Polman, Reingold, Sandberg-Wollheim, Sibley, Thompson, van den Noort, Weinshenker and Wolinsky2001), were selected from a group of 86 consecutive referrals to the Neuropsychiatric Assessment Service, Queen's Medical Centre Nottingham, United Kingdom, over a period of 7 years. Seventeen patients were considered to be suffering from relapsing–remitting multiple sclerosis, while seven were considered to be in the secondary progressive phase. One patient was considered to have primary progressive multiple sclerosis. None of the patients were considered to be suffering from an acute relapse at the time of the assessment. All the patients met the following inclusion criteria. The patients were referred for neuropsychological assessment either because of self-reported cognitive difficulties or because the referring Consultant Neurologist suspected compromised cognition. Patients with current diagnoses of major psychiatric disorders (using DSM-IV criteria) or neurological disorders other than MS were excluded (n = 60). Patients whose first language was not English were also excluded (n = 1). To be included in the sample a patient had to have been tested by one or more of the authors for clinical purposes with a neuropsychological test battery which included the tests listed below. Expanded Disability Status Scale (EDSS; Kurtzke, Reference Kurtzke1983) scores were obtained for all patients. No patients were on anti-depressant or beta-interferon treatment. All nonidentifiable demographic and test data for these 25 patients were entered into an anonymized database.
Healthy control participants were selected from an existing anonymized database of 301 volunteers (Davis et al., Reference Davis, Langley, Ho, Bradshaw and Szabadi2000a). Twenty-five control participants were individually matched to the patient participants for age (± 5 years), sex, and predicted premorbid intelligence (± 5 IQ points) as estimated using the National Adult Reading Test (NART) (Nelson, Reference Nelson1982; Davis et al., Reference Davis, Langley, Ho, Bradshaw and Szabadi2000a). In addition, data from a “reference group” of 86 healthy participants aged 16–25 years were used in the application of the method by Myerson et al. (Reference Myerson, Hale, Zheng, Jenkins and Widaman2003) to the analysis of RTs (see above). The reference group's performance on the GCDT, but not the Stroop test, has been published previously (Davis et al., Reference Davis, Langley, Ho, Bradshaw and Szabadi2000a). Ethics committee approval was granted by the Local Research Ethics Committee.
Neuropsychological Tests
Graded conditional discrimination tasks (GCDT)
The test was identical to that described by Davis et al. (Reference Davis, Langley, Ho, Bradshaw and Szabadi2000a). The stimuli were presented in monochrome on a visual display unit (VDU/monitor) using a microcomputer which also recorded the RTs. A 15-cm-wide box with a sloping front panel containing two push button switches was placed on the participant's desk in front of the VDU screen. Participants completed eight matching-to-sample tasks of graded difficulty. Each trial of each task started with a 100-ms “beep” followed by presentation of a sample stimulus at the top center of the screen and two comparison stimuli at the bottom left and bottom right of the screen. The first button-press following stimulus presentation resulted in removal of the stimuli and, in the case of the first four items of each task, the appearance of the message “CORRECT” or “WRONG” on the screen. The stimuli consisted of letters of the alphabet. The eight tasks, which were presented in the order of increasing complexity, differed from one another in the number of letters included in each stimulus: 1, 2, 3, 4, 5, 6, 8, and 10. In the first five tasks, the letters were presented in a horizontal line, whereas in tasks 6 to 8, they were arranged in two lines of equal length, one above the other. In each trial, one comparison stimulus was identical to the sample stimulus, whereas the other differed from it with respect to one letter, which was positioned randomly in the array, with the constraints that (a) it occurred in each possible position in the array at least once in a series of 24 trials, and (b) in the case of stimuli comprising more than one row of letters, it occurred in each row approximately equally often. The “correct” comparison stimulus was the left-hand stimulus in a random 50% of trials in each task, and the right-hand stimulus in the other 50%. Each task consisted of 24 items, separated by 4-s intertrial intervals; feedback was provided only in the first four trials, which were not used in the data analysis. Successive tasks were separated by 2-min rest periods.
Computerized Stroop test
The stimuli for this test were presented in either red, yellow, green, or blue color on a VDU using a microcomputer which also recorded the RTs. A 26-cm-wide box with a sloping front panel containing four push buttons corresponding to four colored bulbs (red, yellow, green, and blue) was placed on the participant's desk in front of the VDU screen. Participants completed a practice block and two test blocks of trials. In each trial the participant's task was to identify the color in which a stimulus appeared on the screen, by pressing the corresponding button on the panel. The stimuli were either “congruent” (i.e., the stimulus was the name of the color in which the stimulus appeared: for example, “RED” appearing in red lettering on the screen), “incongruent” (i.e., the stimulus was the name of a different color from that in which the stimulus appeared: for example, “YELLOW” appearing in blue lettering), or “neutral” (i.e., the stimulus consisted of four Xs, in blue, yellow, green, or red lettering). “Congruent,” “incongruent,” and “neutral” trials occurred in a pseudorandom sequence, with the constraint that no more than 3 trials of one type occurred in succession, and that the same stimulus or color did not occur more than 3 times in succession. Each trial started with a 100-ms “beep” followed by presentation of the stimulus in the center of the screen. During the practice block of 24 trials, the first button-press following stimulus presentation resulted in removal of the stimulus and the appearance of the message CORRECT or WRONG on the screen. Data for the practice trials were not used in the analysis. Following the practice block, there were two blocks of 60 trials (“test” blocks), with individual trials separated by 3-s intertrial intervals. A 2-min interval was interposed between the test blocks.
Standardized neuropsychological tests
All patients and control participants underwent an assessment of estimated premorbid intellectual functioning with the NART, as part of the matching procedure (see above). Current intellectual level was assessed using Raven's Standard Progressive Matrices (RSPM; Raven, Reference Raven1958). Estimated premorbid RSPM performance was obtained for each participant by substituting age and NART score into the regression function provided by Davis et al. (Reference Davis, Ho, Bradshaw and Szabadi2000b). Memory functioning was assessed using the Doors and People test (Baddeley et al., Reference Baddeley, Emslie and Nimmo-Smith1994) (data from this test are missing for 1 of the 25 control participants). All the patients underwent testing with the Visual Object and Space Perception battery (VOSP) (Warrington and James, Reference Warrington and James1991) as a screen for visuoperceptual/visuospatial impairment.
Procedure
Testing took place in a quiet room. Each participant was tested individually.
Data Analyses
SPSS version 15.0 was used to analyze the data; SigmaPlot version 8.02 was used for graphical representation of the data and computation of regression functions. Demographic data and the results of standardized neuropsychological testing were compared between the patient and matched control groups by paired-samples t test. Paired-samples t test analyses were used in preference to independent-samples t tests as the participants in the two groups were individually matched for age, sex, and predicted premorbid IQ (Coolican, Reference Coolican2004).
The RT data from the GCDT were initially analyzed by a two-factor repeated-measures ANOVA (patient/control, task), followed by multiple comparisons of the patient and control groups at each level of the task factor. Linear functions were then fitted to the data from each participant (Davis et al., Reference Davis, Langley, Ho, Bradshaw and Szabadi2000a);
![$$
{\rm RT} = a \cdot [{\rm number of letters}] + y0
$$](https://static.cambridge.org/binary/version/id/urn:cambridge.org:id:binary:20151007085611210-0467:S1355617708080946jra_eqn001.gif?pub-status=live)
(where a = slope and y0 = y-axis intercept), and the slopes and intercepts of the functions compared between the groups. The slope of the function obtained for each participant was compared with the slope predicted by substituting the participant's age and NART score into the normative regression equation for this test, and the obtained-predicted discrepancy score was converted into a z-score as described by Davis et al. (Reference Davis, Langley, Ho, Bradshaw and Szabadi2000a). Finally, each participant's RT data were plotted against the corresponding data from the “reference group”, and linear functions derived, as described by Myerson et al. (Reference Myerson, Hale, Zheng, Jenkins and Widaman2003):
![$$
{\rm RT} = a \cdot [{\rm RT_{ref. group}}] + y0
$$](https://static.cambridge.org/binary/version/id/urn:cambridge.org:id:binary:20151007085611210-0467:S1355617708080946jra_eqn002.gif?pub-status=live)
The performance measures on the Stroop task (RT in each type of trial), and the absolute and proportional increase in RT in the incongruent trials, compared with the neutral trials ([RTincongruent–RTneutral] and 100 × [(RTincongruent − RTneutral)/RTneutral]) (Vitkovitch et al., Reference Vitkovitch, Bishop, Dancey and Richards2002), were compared between the patient and individually matched control group using t tests for paired samples. Finally, each participant's RTs in the three types of trial of the Stroop test were predicted by substituting the corresponding mean RT of the reference group into the linear equation relating that participant's performance on the GCDT to the reference group's performance on that test (equation 2); discrepancies between predicted and obtained RTs on the three types of trial of the Stroop test were compared between the patient and matched control groups using paired-sample t tests. The method is illustrated by the following example. The regression equation relating patient X's RTs on the GCDT and the corresponding performance of the reference group (equation 2) is RTX = 2.21 × RTref. group − 659. Substituting the reference group's mean RT on the incongruent trials of the Stroop test (832 ms) into this equation yields a predicted RT on the incongruent trials for patient X of 1,180 ms. Patient X's actual RT on the incongruent trials was 1,370 ms; the discrepancy score (RTpredicted − RTobtained) is, therefore, 190 ms. A significance criterion of p < .05 (two-tailed) was adopted in all statistical analyses.
RESULTS
Demographic Data
Table 1 shows the demographic data for the patient and control groups. The two groups were matched for sex. There were no significant differences between the two groups with respect to age [t(24) = 1.2; p > .2] or predicted premorbid IQ [t(24) = 0.7; p > .5]. The mean time since onset of MS symptoms for the patient group was 12.5 years (SD = 8.3; range, 1–28 years). The mean EDSS score for the patient group was 3.80 (SD = 1.61; range, 2.0–7.5).
Demographic data and neuropsychological test scores of the control and patient groups (mean ± SD)

a Computed from NART score.
b n = 24 in each group.
* control vs. patient, p < .05 (see text for analysis).
Standardized Neuropsychological Tests
The mean (±SD) data are shown in Table 1. There was no significant difference between the scores obtained by the two groups on RSPM [t(24) = 0.9; p > .3]. Predicted IQ scores based on age and NART score (Davis et al., Reference Davis, Ho, Bradshaw and Szabadi2000b) did not differ between the two groups [t(24) = 0.7; p > .5], and there was no significant difference between the predicted-obtained RSPM discrepancy scores of the two groups [t(24) = 1.1; p > .2].
Only 24 of the 25 matched pairs were compared for memory functioning,as one of the matched control participants did not complete the Doors and People memory battery. There were significant differences between the control and patient groups with respect to the visual [t(23) = 2.2; p < .05], and global memory indices [t(23) = 2.3; p < .05]. The difference between patients and controls on the verbal index was not significant [t(23) = 1.6; p > .1].
All 25 patient participants completed the VOSP battery as part of their clinical assessment. Every patient passed every subtest of the VOSP.
Graded Conditional Discrimination Tasks
Figure 1 shows the GCDT data for both groups. Two-factor repeated measures ANOVA revealed significant main effects of group [F(1,48) = 14.8; p < .001] and task [F(7,336) = 175.7; p < .001], and a significant group × task interaction [F(7,336) = 10.6; p < .001]. Multiple comparisons showed that the RTs of the patient group were significantly longer than those of the control group on all tasks except the first (one-letter) task [t(24) = 0.7; p > .5].
Relation between RT on the eight tasks of the GCDT and the number of letters in the stimulus array in each task. Ordinate: RT (ms); abscissa: number of letters. Points show group mean data for the MS patient group (open symbols) and matched control group. Lines are best fit linear functions; r 2 = 0.99 (patients) and 0.98 (control group).

Linear functions were fitted to the relation between RT and the number of letters in the stimulus array for each participant. The mean (±SD) values of the parameters of the functions are shown in the upper half of Table 2. The slope of the function was significantly steeper in the patient group than in the matched control group [t(24) = 3.3; p < .01]. The intercepts did not differ significantly [t(24) = 0.6; p > .5]. The mean proportion of variance accounted for by the linear functions was >0.91 in both groups.
Parameters of linear functions fitted to individual participants' performance on the GCDT (mean ± SD)

* Control vs. patient, p < .05 (see text for analysis).
** Control vs. patient, p < .01 (see text for analysis).
The slope obtained for each participant was compared with the slope predicted by substituting his/her age and NART score into the appropriate normative regression function described by Davis et al. (Reference Davis, Langley, Ho, Bradshaw and Szabadi2000a), and the resulting discrepancy score was converted into a z-score (Davis et al., Reference Davis, Langley, Ho, Bradshaw and Szabadi2000a). There was a significant difference between the z-scores obtained for the patient (−1.8 ± 2.1) and the control groups (−0.02 ± 1.0) [t (24) = 3.3; p < .01]. Eleven patients and two control subjects obtained a z-score below the 5% cut-off score (z = −1.65) for an abnormally steep slope.
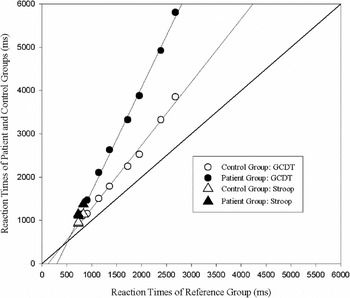
The relationship between the RTs of the patient and control groups and the corresponding RTs of the reference group is shown in Figure 2, and the group mean (±SD) values of parameters derived for the individual participants are shown in the lower half of Table 2. The slope was significantly steeper in the patient group than in the control group [t(24) = 3.4; p < .01] and the intercepts also differed significantly [t(24) = 2.6; p < .05]. The mean proportion of variance accounted for by the linear functions was >0.92 in both groups.
Relation between the patient and control participants groups' RTs on the GCDT and the corresponding RTs of the young “reference group.” Ordinate: RT of the reference group (ms); abscissa: RT of the patient and control groups (ms). Open symbols: control group; filled symbols: patient group. Circles show the RTs on the GCDT; lines are best fit linear functions. Triangles show RTs on the three trial types of the Stroop. Lines are best fit linear functions; r 2 = 0.99 for both groups.

Stroop Test
For each participant, the mean RT was calculated for each type of trial of the Stroop test. Error rates on the GCDT and Stroop tests were very low, with no significant difference between the groups. Table 3 shows group mean data (±SD) for the control and patient groups. To assess whether the Stroop interference effect was greater in the patient group than in the control group, both the absolute increase in RT in the incongruent trials (RTincongruent − RTneutral) and the proportional increase (100 × [RTincongruent − RTneutral]/RTneutral), compared with the neutral trials, were calculated (Vitkovitch et al., Reference Vitkovitch, Bishop, Dancey and Richards2002). The mean RTs on all three trial types were significantly longer for the patient group than for the control group [Congruent: t(24) = 4.0; p < .01; Neutral: t(24) = 3.2; p < .01; Incongruent: t(24) = 3.7; p < .01]. Both the absolute [t(24) = 3.1; p < .01] and proportional Stroop interference effects [t(24) = 2.2; p < .05] also differed significantly between the two groups.
RTs on the three types of trial of the Stroop test, and the Stroop effect, in the patient and matched control groups (mean ± SD)

* Control vs. patient, p < .05 (see text for analysis).
** Control vs. patient, p < .01 (see text for analysis).
Figure 2 shows RTs of the control and patient groups on each type of trial in the Stroop test plotted against the corresponding RTs obtained from the reference group. It is apparent that for both groups, these data points (triangles) lie close to the linear functions relating RT on the GCDT to the corresponding RTs for the reference group (circles, and linear functions defined by equation 2). For each participant, predicted RTs on the three types of trial in the Stroop test were calculated by substitution of the reference group's RTs into the equation relating the individual participant's linear function relating his/her RTs on the GCDT and the corresponding RTs of the reference group (equation 2). Table 4 shows the group mean (±SD) discrepancies between obtained and GCDT-predicted RTs on each type of trial. There were no significant differences between the control and patient groups' predicted and obtained discrepancies for any of the three trial types [Congruent: t(24) = 1.0; p > .3; Neutral: t(24) = 0.2; p > .8; Incongruent: t(24) = 0.6; p > .9].
Discrepancies between obtained RTs on the Stroop test and RTs predicted on the basis of performance on the GCDT (equation 2) (ms, mean ± SD)

Note
Control vs. patient, p < .05 (see text for analysis; no significant differences found).
DISCUSSION
No significant differences were found between the MS patient and healthy matched-control groups with respect to current level of general intellectual functioning, or verbal memory. The patient group performed significantly worse on the Doors and People visual and global memory indices. On all three types of trial of the Stroop test, the MS patients were significantly slower than the matched control participants. The slope of the linear RT function on the GCDT was significantly steeper for the patient group than for the control group, with 11/25 patients and 2/25 control participants obtaining abnormal (<5th percentile) slope values when compared with age- and premorbid intelligence-corrected norms (Davis et al., Reference Davis, Langley, Ho, Bradshaw and Szabadi2000a). These results, taken together, indicate significantly slower information processing for the MS patients than for the age, sex and estimated premorbid IQ-matched control participants.
The absolute Stroop effect (RTincongruent − RTneutral) was significantly enhanced for the patients compared with the controls. Consistent with previous findings (Kujala et al., Reference Kujala, Portin, Revonsuo and Ruutiainen1995; Rao et al., Reference Rao, Leo, Bernardin and Unverzagt1991; Vitkovitch et al., Reference Vitkovitch, Bishop, Dancey and Richards2002), the proportional Stroop effect (percentage increase in RT between neutral and incongruent trials) was also significantly enhanced for the patients compared with the controls. Thus, this study replicated previous findings of an enhancement of the Stroop interference effect in this group.
The second aim of this study was to evaluate the hypothesis that the deficit in performance on the Stroop test in patients suffering from MS may be accounted for in terms of a general slowing of information processing. Using the GCDT to predict Stroop performance, we found that there was no difference between the controls and patients in the discrepancy between predicted and obtained Stroop RTs, despite the two groups differing significantly in obtained RTs on all three Stroop tasks, and in terms of the overall absolute and proportional Stroop effect. This finding appears to support the view that the differences in Stroop RTs between the groups were due to a general slowing of information processing in the patient group, rather than to impairment of executive functioning or selective attention.
The results of this study are consistent with the model of diversity in speeded cognition (the “difference engine”) proposed by Myerson et al. (Reference Myerson, Hale, Zheng, Jenkins and Widaman2003). The speed factor involved in the Stroop test may therefore be far more important than its additional characteristics such as response inhibition. The difference engine predicts that individuals who perform relatively poorly on speeded cognitive tasks (such as people with MS or older adults) are likely to fare worse than healthy, younger individuals on all such tasks, but especially so on more complex tasks. This is consistent with the well documented finding that the difference between the RTs of older and younger subjects on the same tasks increases as a function of task “difficulty” (Cerella, Reference Cerella1985; Hale et al., Reference Hale, Myerson and Wagstaff1987; Myerson et al., Reference Myerson, Hale, Hischmann, Hansen and Christiansen1989; Wogar et al., Reference Wogar, van den Broek, Bradshaw and Szabadi1998), and with reports that patients suffering from degenerative brain disease (Nestor et al., Reference Nestor, Parasuraman and Haxby1991; Rafal et al., Reference Rafal, Posner, Walker and Friedreich1984) or closed head injury (Davis et al., Reference Davis, Langley, Ho, Bradshaw and Szabadi2000a; Wogar et al., Reference Wogar, van den Broek, Bradshaw and Szabadi1998) often show near-normal performance on simple RT tasks while being severely impaired on more complex information processing tasks.
In keeping with the “difference engine” model by Myerson et al. (Reference Myerson, Hale, Zheng, Jenkins and Widaman2003), both the patient group and the matched control group showed slopes greater than 1.0 and intercepts less than 0 when their RTs on the GCDT were plotted against the corresponding RTs of the younger reference group (see Figure 2 and Table 2). A slope of 1.0 and intercept of 0 would indicate that the performance of the patient group was identical to that of the reference group. The slope was significantly steeper and the intercept had a larger negative value in the patient group than in the control group, consistent with a slower rate of information processing in the patient group.
The model by Myerson et al. (Reference Myerson, Hale, Zheng, Jenkins and Widaman2003) provides a basis for placing qualitatively different tasks on a common quantitative scale of task “difficulty,” using the RTs of a healthy young reference group as the measure of relative difficulty. Viewed from the perspective of this model, the Stroop test may simply represent an information processing test that is sensitive to slowed general cognition resulting from disease processes or ageing. Consistent with this interpretation, RTs on the Stroop test were well predicted by linear RT functions derived from the GCDT. Moreover, the significant difference between the patients' and the matched control participants' RTs on the Stroop test disappeared when the difference in slope of their RT functions derived from the GCDT was taken into account.
Rate of progression of neuroaxonal loss, likely to affect commissural and association fibers that subserve attention and information processing speed, has been shown to correlate with cognitive decline in MS (Summers et al., Reference Summers, Fisniku, Anderson, Miller, Cipolotti and Ron2008). Future research might usefully compare the relative lesion load in frontal-subcortical pathways and interhemispheric commissures in patients with MS who have only information processing speed impairment against those who have additional genuine executive functioning impairment.
One limitation of the present is that the patient participants were not selected on the basis of the diagnosed subtype of MS. This is an issue in all research into multiple sclerosis (Comi and Filippi, Reference Comi and Filippi2005; Kieseier et al., Reference Kieseier, Hemmer and Hartung2005; Killestein and Polman, Reference Killestein and Polman2005). There is evidence that slowing of information processing is differentially affected in different subtypes of MS, with slowing being more pronounced in secondary progressive MS than in primary progressive or relapsing-remitting MS (Denney et al., Reference Denney, Sworowski and Lynch2005; Montalban, Reference Montalban2005). It must also be acknowledged that the present patient sample was highly variable with respect to the duration of MS symptoms before assessment.
The relatively small sample size of the present study is nevertheless comparable with other important studies in this field (Parmenter et al., Reference Parmenter, Schucard and Schucard2007). The current results should be replicated in the future with a larger sample size.
The patients were individually matched to control participants for age, sex and estimated premorbid IQ, rendering it unlikely that uncontrolled differences in these variables can account for the observed difference between the MS sufferers and the control group. It may also be noted that the limitations of the present study discussed above are more likely to have attenuated than to have enhanced the between-group differences seen in this study.
Some caution is needed in interpreting the information processing deficit in MS. People with MS are particularly susceptible to the effects of fatigue, and MS is known to affect vision, eye movement, sensorimotor and hand dexterity functioning (De Sonneville et al., Reference De Sonneville, Boringa, Reuling, Lazeron, Ader and Polman2002). Depression is also frequently reported in people with MS and is thought by some to account for their information processing difficulties (Landrø et al., Reference Landrø, Celius and Sletvold2004). A screen of visuospatial/perceptual functioning indicated that these functions were not significantly compromised in the present patient sample. Major depression was an exclusion criterion in this study; however there was no independent assessment of fatigue. The possibility that the information processing deficit seen in our group could have been compounded by fatigue cannot be excluded. However, other researchers have found no covariate effects of fatigue and depression on speed of information processing in people with MS (Archibald and Fisk, Reference Archibald and Fisk2000). It is also significant that, for the first and simplest task of the GCDT, the two groups did not differ significantly in mean RT; this suggests that between-group differences on subsequent tasks were due to the impact of increased task complexity on information processing speed.
The findings of the present study are consistent with the suggestion of Denney et al. (Reference Denney, Lynch, Parmenter and Horne2004, Reference Denney, Sworowski and Lynch2005) that poor performance on the Stroop test may be attributable to slowed information processing alone, and that there may be no need to invoke impaired executive functioning as an explanation of the poor performance of MS patients on this task. From a practical viewpoint, the present study highlights the need for clinicians assessing patients with multiple sclerosis to be particularly cautious in interpreting compromised performance on any time-dependent neuropsychological test in terms of deficits in cognitive functions other than information processing speed. The present results also suggest a viable method, based on the analysis of speeded cognitive performance by Myerson et al. (Reference Myerson, Hale, Zheng, Jenkins and Widaman2003), whereby deficits in information processing speed may be distinguished from impairments in other cognitive domains.
ACKNOWLEDGMENTS
Preliminary results of this research were originally presented at the International Neuropsychological Society, Federation of Spanish Societies of Neuropsychology, Spanish Neuropsychological Society, Spanish Psychiatry Society Joint Mid-Year Meeting July 2007, Bilbao, Spain.