Anterior cranial fossa dural arteriovenous fistulas (DAVFs) are rare, accounting for 1–1.5% of all intracranial malformations and 5.8% of all DAVFs, Reference Lasjaunias, Chiu and ter Brugge1 but they are often associated with angiographic features of increased hemorrhagic risk. Indeed, they often have a clinical presentation with sudden massive hemorrhage, especially in the presence of leptomeningeal draining vein and aneurysmal varix formation. These DAVFs usually receive arterial blood supply from ethmoidal branches of the ophthalmic artery (OA) and drain directly into the frontal cortical veins because there is no dural sinus in this location. The gold standard for the diagnosis and angioarchitectural characterization of DAVFs is cerebral angiography. Endovascular treatment is associated with a greater long-term recurrence rate than surgical treatment and it is preferred for patients at high surgical risk. Reference Giannopoulos, Texakalidis and Alkhataybeh2,Reference Cannizzaro, Peschillo and Cenzato3
Among the ethmoidal branches of the OA, the anterior ethmoidal artery (AEA) is a frequent source of arterial blood supply to DAVF and it passes in the medial third of the orbit from the origin to the entrance in the ethmoidal anterior canal. Reference Seker, Martins and Rhoton4 In its orbital course, the AEA could be theoretically imaged by ultrasound techniques through the ophtalmic window but there are no reports in the literature about the AEA insonation. Ultrasound techniques have the operator-dependency as main limitation and the power output reduction needed for the study through the ophtalmic window might not allow to image OA branches in all subjects.
We present the case of a patient with an ethmoidal DAVF symptomatic for intracranial hemorrhage (ICH) and treated by transarterial endovascular embolization of right AEA because of a high surgical risk for concurrent pulmonary embolism with a diagnosis of antiphospholipid syndrome. Indeed, the surgical treatment has a higher success rate than endovascular approach in these DAVFs but the need of sine die anticoagulation, the active venous thromboembolism and the short-time risk of ICH recurrence are factor in favor of endovascular treatment. The patient underwent a transarterial embolization through selective catheterization of the right AEA origin from the OA using a microcatheter (Sonic 1.2 F) and a microwire (Hybrid 0.007") and injecting an embolic agent (SQUID 18) under visual control to the progressive disappearance of the venous outflow.
AEA was identified using orbital ultrasound, as detailed in Figure 1 comparing ultrasound anatomy to a schematic anatomical drawing of the main vascular content of the orbit (a and b), and the Doppler waveform of both the anterior central retinal artery and AEA (c and d) is sampled. Ultrasound monitoring of AEA was performed on the same timeline as the three angiographic examinations, respectively, for confirming the diagnosis, treating the DAVF and follow-up the 6 months effectiveness of the treatment (Fig. 2). The ultrasound sampling of the AEA showed high flow velocity features of feeding artery to the fistula before treatment (Fig. 2a), “stump flow” features of distal occlusion immediately after treatment (Fig. 2c) and Doppler waveform with high resistance indices at 6 months (Fig. 2e). These findings were coherent with angiographic results in the same timeline (Fig. 2b,d,f), as detailed in the caption. The patient did not develop any further symptom in the follow-up.
a – d : ultrasound orbital imaging. Schematic view of orbital structures with the main arteries and relationship with the optic nerve and the eye globe. Ultrasound image from the right orbital window in B-mode with color-mode, where both the central retinal artery and vein (green *) and the anterior ethmoidal artery (AEA) (red *) are easily identified just behind the optic disc in the optic nerve head (the short longitudinal double line structure). Doppler waveform of the central retinal artery (above the baseline) and vein (under the baseline) with the direct transmission of the arterial pulsatility to the vein; the artery has a Doppler waveform with a normal systolic–diastolic modulation. Doppler waveform of the AEA with a systolic–diastolic pattern similar to the one of the central retinal artery.

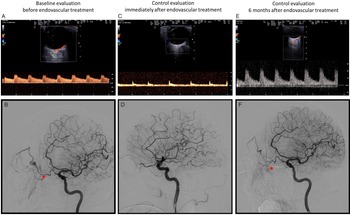
E-l: coeval ultrasound orbital imaging and DSA findings (ipsilateral oblique view of the right internal carotid artery injection) along the timeline of the patient’s history. a and b: right AEA insonation ( a ) with high velocity and low resistance velocity waveform (pulsatility index 0.6) and the corresponding angiographic view ( b ) in left oblique projection showing the right AEA (red *) branching from the OA and supplying the fistula; there is the opacification of the venous outflow with venous pouches and varices in the arterial phase of the angiographic image (starting from above the red *). c and d: ultrasound ( c ) and angiographic ( d ) images, as in figures a and b, taken immediately after endovascular embolization of the DAVF, showing the occlusion of the right AEA («stump flow» in the ultrasound image c) and the exclusion of the DAVF in angiographic image ( d ) (disappearance of the venous opacification in comparison with image a). e and f: ultrasound ( e ) and angiographic ( f ) images, as in figures a-b and c-d, 6 months after endovascular treatment, showing partial low flow recanalization of the DAVF with a good correspondence between Doppler waveform (low velocity and high resistance pattern; pulsatility index 1.3) ( e ) and slow contrast filling at the site of previous treated DAVF (f) but without venous enlargement and with a very low flow shunt free of hemodynamic consequences.

Neuroradiological techniques are usually performed to monitor the effectiveness of AEA but they are sometimes complex to perform in acute noncollaborating patients. The possibility to noninvasively monitor AEA Doppler waveform could help in the follow-up of DAVF treated by endovascular embolization, being ultrasound techniques noninvasive, bedside executable and repeatable. The ultrasound identification of the AEA is easy and it could be a promising noninvasive technique to monitor bedside patients who underwent endovascular treatment in the follow-up besides neuroimaging techniques. However, this approach requires a wider validation and it does not replace the conventional neuroimaging follow-up of these patients.
Supplementary material
The supplementary material for this article can be found at https://doi.org/10.1017/cjn.2023.68.
Disclosure
None.