


1. Introduction
Energy-saving strategies for large transport systems play an important role in mitigating both rising energy costs and increasing carbon emissions. Large transport systems with slender bodies, e.g. ships (Schultz et al. Reference Schultz, Bendick, Holm and Hertel2011) and aircraft (Viswanath Reference Viswanath2002), primarily expend energy to overcome skin-friction drag. An approach for reducing the skin-friction drag is through the use of riblets. Riblets are intentionally roughened surfaces, streamwise-aligned micro-ribs that reduce drag below that of a smooth surface without energy input (Choi, Moin & Kim Reference Choi, Moin and Kim1993; Bechert et al. Reference Bechert, Bruse, Hage, Van Der Hoeven and Hoppe1997; García-Mayoral & Jiménez Reference García-Mayoral and Jiménez2011a; von Deyn, Gatti & Frohnapfel Reference von Deyn, Gatti and Frohnapfel2022). The optimal spacing of riblets on a passenger aircraft is of the order of  $50\unicode{x2013}100\ \mathrm {\mu }{\rm m}$ (Viswanath Reference Viswanath2002). Because of this small scale, the widespread use of riblets today is hampered by the complexity in manufacturing, maintenance and wear (Bushnell Reference Bushnell2003; Choi Reference Choi2013). Currently, it is uncertain whether the performance of imperfectly manufactured or worn riblet surfaces remains acceptable and, ultimately, cost effective across their lifespan. Particularly, the effect of riblet tip erosion on performance has not received enough attention, with two noteworthy experiments by Walsh (Reference Walsh1982, Reference Walsh1990). To address the sensitivity of the performance change due to imperfections, a routine yet highly accurate predictive model is needed. Previously, a model was advanced by Luchini, Manzo & Pozzi (Reference Luchini, Manzo and Pozzi1991) and Luchini (Reference Luchini1996) using the concept of Stokes-flow protrusion heights. The model predicts that riblets with sharp tips generally perform better (García-Mayoral & Jiménez Reference García-Mayoral and Jiménez2011a), consistent with Walsh (Reference Walsh1990). However, the magnitude of optimal drag reduction, which riblets attain at small but non-vanishing sizes, is overpredicted by the model. This is because the model was designed for vanishingly small riblets. Therefore, our aim is to develop a model to predict the optimal drag reduction that accounts for the additional effects of non-vanishing riblet sizes.
The paper is divided into two main parts. The first part (§§ 2–3) uses the present direct numerical simulation (DNS) dataset to assess riblet drag-reduction predictions based on the protrusion-height model by Luchini et al. (Reference Luchini, Manzo and Pozzi1991). The first part provides clear information to the second part (§ 4), which develops a new model that accurately predicts the drag reduction up to the optimal riblet size. Specifically, in § 2, we outline the method to obtain our present DNS dataset comprising several riblet shapes and sizes around the optimal. In § 3.1, we first show that, as expected, the protrusion-height model does not accurately predict the drag reduction for riblets of non-vanishing sizes. However, the DNSs demonstrate that the flow above riblets remains essentially an offset of the smooth-wall flow, as proposed by Luchini (Reference Luchini1996), up to the optimal riblet size. Thus, the drag reduction (log-layer velocity difference  $-\Delta U^+$) can be quantified by the difference between the observed origin offsets of the mean flow $\ell _U^+$ and the turbulence $\ell _T^+$ (Gómez-de-Segura, Sharma & García-Mayoral Reference Gómez-de-Segura, Sharma and García-Mayoral2018b). Further, the DNSs show that the Stokes-flow protrusion height for the streamwise flow $h_\parallel ^+$ remains an accurate prediction of $\ell _U^+$, whereas the protrusion height for the spanwise flow $h_\perp ^+$ becomes an increasingly inaccurate estimate of $\ell _T^+$ for larger riblets (for notation, see table 1). In § 3.2, we demonstrate that the effect of wall-normal transpiration above non-vanishing riblets is crucial to predicting $\ell _T^+$ accurately, as the $\ell _T^+$ values of riblets agree with an empirical equation for $\ell _T^+$ proposed by Ibrahim et al. (Reference Ibrahim, Gómez-de-Segura, Chung and García-Mayoral2021) that incorporates the effects of transpiration. However, the empirical equation is developed based on simulations with Robin boundary conditions and applying the empirical equation to riblets requires a posteriori measurements from the DNS. To circumvent the need for riblet DNSs, here, we develop a model that incorporates wall-normal transpiration effects, borrowing ideas and insights from models for quasi-streamwise vortices surveyed in § 3.3. In § 4, we discuss the development, methodology and validation of our present model based on a vortex flow structure representing turbulence to accurately predict $\ell _T^+$ and, hence, the drag reduction up to the optimal size of riblets. In § 5, we conclude and discuss the outlook for the model.
Summary of lengths used in this paper and how they are obtained. For consistency with the literature, we use  $h$ for those quantities proposed by Luchini et al. (Reference Luchini, Manzo and Pozzi1991), and $\ell$ for those from Ibrahim et al. (Reference Ibrahim, Gómez-de-Segura, Chung and García-Mayoral2021).

2. Direct numerical simulation dataset
In this section, we discuss the methodology and validation of our present DNS dataset, which will allow us to assess the limitations of the model by Luchini et al. (Reference Luchini, Manzo and Pozzi1991) in § 3, and to develop the present model in § 4. The DNSs solve the Navier–Stokes equations using a commercial solver Cliff by Cascade Technologies Inc. (Ham, Mattsson & Iaccarino Reference Ham, Mattsson and Iaccarino2006; Ham et al. Reference Ham, Mattsson, Iaccarino and Moin2007). Cliff is a second-order accurate node-based collocated finite-volume incompressible-flow solver on unstructured grids. The code solves the following mass and momentum equations:
 \begin{equation} \boldsymbol{\nabla}\boldsymbol{\cdot}\boldsymbol{{{u}}}=0, \quad \frac{\partial{{\boldsymbol{u}}}}{\partial t}+\boldsymbol{\nabla}\boldsymbol{\cdot}\left({{{\boldsymbol{u}}}{{\boldsymbol{u}}}}\right) =-\frac{1}{\rho}\boldsymbol{\nabla} p + \nu\nabla^2{{\boldsymbol{u}}}-\frac{1}{\rho} \frac{\mathrm dP}{\mathrm{d}\kern0.7pt x}{\boldsymbol{i}}, \end{equation}
where  ${{\boldsymbol {u}}}=(u,v,w)$ are the instantaneous fluid velocities in the streamwise, $x$, spanwise, $y$, and wall-normal, $z$, directions, respectively, $t$ is time, $p$ is the periodic (fluctuating) pressure, $\rho$ is the fluid density, $\nu$ is the kinematic viscosity, ${\text {d} P}/{\text {d}\kern0.06em x}$ is the driving pressure gradient term and $\boldsymbol {i}$ is the streamwise unit vector. The total pressure $p_{T}$ is decomposed into a mean (driving) and periodic pressure, ${p_T(x,y,z,t)=p(x,y,z,t)+P(x)}$, where $P(x)$ is the input into our simulation through a spatially uniform body force. The boundary conditions are a no-slip smooth/riblet wall, periodic $x$ and $y$ boundaries and slip at the top of the domain, thus simulating an open-channel flow.
Conventional DNSs of wall-bounded turbulent flows use fine grids to resolve the small viscous scales, while a large domain is used to capture the large outer-layer motions. To statistically capture the flow behaviour, the size of the domain should be approximately  $L_x=2{\rm \pi} \delta$ and $L_y={\rm \pi} \delta$ (Lozano-Durán & Jiménez Reference Lozano-Durán and Jiménez2014), where $\delta$ is the half-channel height, or in viscous units, $L_x^+\approx 2500$ and $L_y^+\approx 1250$ for a friction Reynolds number ${Re}_\tau =395$, where the ‘ $+$’ superscript is the normalisation with friction velocity and kinematic viscosity $\nu$. For riblets, these simulations are costly because a large number of cells are needed near the wall to resolve the texture. This is typically 28–32 points per riblet spacing $s^+$ for $8\lesssim s^+ \lesssim 50$, resulting in a grid resolution of $0.1\lesssim \varDelta _y^+\lesssim 0.5$, which is denser than a typical smooth-wall DNS ( $\varDelta _y^+\approx 3$). The high computational costs can be reduced through the use of minimal channels, which involves reducing the streamwise and spanwise dimensions of a conventional channel domain. Minimal channels containing the smooth-wall buffer layer turbulence were initially introduced by Jiménez & Moin (Reference Jiménez and Moin1991). Subsequently, Flores & Jiménez (Reference Flores and Jiménez2010) developed the minimal channels containing the smooth-wall logarithmic layer turbulence, which was further extended by Chung et al. (Reference Chung, Chan, MacDonald, Hutchins and Ooi2015) to enable measurements of $\Delta U^+$ for rough walls (MacDonald et al. Reference MacDonald, Chung, Hutchins, Chan, Ooi and García-Mayoral2017) and riblets (Endrikat et al. Reference Endrikat, Modesti, MacDonald, García-Mayoral, Hutchins and Chung2021b). By comparing the mean velocity profiles of minimal channels with those of conventional channels, accurate measurements of drag change can be obtained from a prespecified wall-normal range that extends up to a critical height $z_c^+$, which is proportional to the span of the channel, $L_y^+$ (Flores & Jiménez Reference Flores and Jiménez2010). Suggestions for $z_c^+$ vary in the range of $0.3L_y^+\lesssim z_c^+\lesssim 0.4L_y^+$ (Flores & Jiménez Reference Flores and Jiménez2010; Chung et al. Reference Chung, Chan, MacDonald, Hutchins and Ooi2015; MacDonald et al. Reference MacDonald, Chung, Hutchins, Chan, Ooi and García-Mayoral2017). For the size of our minimal domain, we choose the spanwise length $L_y^+\gtrsim 250$ (same as the smooth-wall reference minimal-channel case). Thus, $z_c^+\gtrsim 100$, so that the log region is accurately captured and $\Delta U^+$ (i.e. the velocity difference in the log region) can be measured. A detailed measurement of $\Delta U^+$ is outlined in Appendix A. We also set the streamwise length $L_x^+\gtrsim 1000$, sufficient to capture the streamwise streaks, as suggested by MacDonald et al. (Reference MacDonald, Chung, Hutchins, Chan, Ooi and García-Mayoral2017).
Table 2 reports the riblet flow cases and the reference smooth-wall cases. All cases are run at a friction Reynolds number of  ${Re}_\tau =395$, except for one smooth-wall case (S1000) at ${Re}_\tau =1000$. The case IDs with an asterisk (*) are from Endrikat et al. (Reference Endrikat, Modesti, García-Mayoral, Hutchins and Chung2021a,Reference Endrikat, Modesti, MacDonald, García-Mayoral, Hutchins and Chungb, Reference Endrikat, Newton, Modesti, García-Mayoral, Hutchins and Chung2022) and Modesti et al. (Reference Modesti, Endrikat, Hutchins and Chung2021). For the larger riblets, for which data overlap permits comparison, these DNSs demonstrate good agreement with experimental results, including spectra and time-averaged flow within the grooves (Endrikat et al. Reference Endrikat, Newton, Modesti, García-Mayoral, Hutchins and Chung2022). For minimal channels (Flores & Jiménez Reference Flores and Jiménez2010; MacDonald et al. Reference MacDonald, Chung, Hutchins, Chan, Ooi and García-Mayoral2017), the largest eddy turnover time, $L_t u_\tau /z_c$, i.e. the simulation time $L_t$ normalised by the characteristic period of the largest resolved turbulent scale $z_c/u_\tau$, is chosen to ensure that the uncertainty in the measured $\Delta U^+$ is small following the guidelines established by MacDonald et al. (Reference MacDonald, Chung, Hutchins, Chan, Ooi and García-Mayoral2017)
 \begin{equation} L_t\frac{u_\tau}{z_c} \approx 6\left({\frac{91.4}{\zeta^+z_c^+}}\right)^2\frac{7.5 z_c}{L_x}\frac{2.5z_c}{L_y}, \end{equation}
where  $\zeta ^+$ is the uncertainty in the measured $\Delta U^+$. Given our minimal domain, gathering statistics for roughly $L_tu_\tau /z_c\approx {300}$ eddy turnover times after transients decay is sufficient to ensure $\zeta ^+\approx \pm 0.1$ (table 2), except for the cases with longer streamwise domain length, $L_x^+\approx 2000$, where $L_tu_\tau /z_c\approx {125}$ eddy turnovers are sufficient. These eddy turnover times based on eddy counts (MacDonald et al. Reference MacDonald, Chung, Hutchins, Chan, Ooi and García-Mayoral2017) are corroborated by a statistical convergence study for riblets by Endrikat et al. (Reference Endrikat, Modesti, MacDonald, García-Mayoral, Hutchins and Chung2021b): statistics that are considered converged based on the $L_tu_\tau /z_c$ criteria above typically exhibited differences of ${\lesssim }1\,\%$ between the measured $(x,y,t)$-averaged shear stress and the linear profile (cf. Vinuesa et al. Reference Vinuesa, Prus, Schlatter and Nagib2016).
Riblet DNS cases. Existing cases (*) are from Endrikat et al. (Reference Endrikat, Modesti, García-Mayoral, Hutchins and Chung2021a, Reference Endrikat, Newton, Modesti, García-Mayoral, Hutchins and Chung2022) and Modesti et al. (Reference Modesti, Endrikat, Hutchins and Chung2021). All cases are run at  ${Re}_\tau =395$, except for S1000 at ${Re}_\tau =1000$. The roughness function, $\Delta U^+$, is measured from the mean velocity difference relative to the smooth wall, averaged in the range $50\lesssim z^+\lesssim 100$, except for case AT15 (marked by $\dagger$), where we average the velocity difference in the range $30\lesssim z^+\lesssim 50$, due to a lower quality grid that causes a small underestimation of the mean velocity above $z^+\approx 50$.

The friction velocity can be obtained from two methods: (i) the nominal friction velocity,  $u_*$, i.e. the drag on the riblet wall per plan area (not wetted area), derived a priori from the force balance of the domain, or (ii) the effective friction velocity, $u_\tau$, measured a posteriori at the virtual origin of turbulence, $z^+=-\ell _T^+$ (Gómez-de-Segura et al. Reference Gómez-de-Segura, Fairhall, MacDonald, Chung and Garcıa-Mayoral2018a; Fairhall, Abderrahaman-Elena & García-Mayoral Reference Fairhall, Abderrahaman-Elena and García-Mayoral2019; Ibrahim et al. Reference Ibrahim, Gómez-de-Segura, Chung and García-Mayoral2021), outlined in detail in Appendix A. For the cases considered in table 2, $u_*$ and $u_\tau$ differ only by a maximum of $1\,\%$. However, $\Delta U^+$ differs by approximately 10 % up to the optimum size based on these two friction velocities. Following the rationale of Ibrahim et al. (Reference Ibrahim, Gómez-de-Segura, Chung and García-Mayoral2021), we use $u_\tau$ when measuring $\Delta U^+$, which we report in table 2.
We carry out additional small riblet simulations, at  $\ell _g^+\approx 5,8$ and 10, where $\ell _g^+$ is the square root of the riblet groove area (see sketches in table 2), to fill the viscous parameter space beyond Endrikat et al. (Reference Endrikat, Modesti, MacDonald, García-Mayoral, Hutchins and Chung2021b). The additional cases also utilise an adaptive mesh refinement tool (Adapt) to refine the mesh near the wall and resolve the riblet texture, while the mesh farther from the wall is coarser for computational efficiency yet sufficiently fine to resolve all turbulent flow scales. Figure 1 illustrates some of the computational grids from the current cases (non-asterisk case IDs in table 2). Near the crests, there are $n_s=41$ points per riblet spacing, resulting in a spanwise grid size in the range of ${0.1\lesssim \varDelta _y^+\lesssim 0.5}$. These grid specifications are similar or more refined than previous riblet DNSs, utilising at least $n_s=24$ points per riblet spacing (Goldstein, Handler & Sirovich Reference Goldstein, Handler and Sirovich1995; Goldstein & Tuan Reference Goldstein and Tuan1998; García-Mayoral & Jiménez Reference García-Mayoral and Jiménez2011b). The mesh is coarsened to $n_s=21$ ( $0.5\lesssim \varDelta _y^+\lesssim 2$), starting from $z^+\approx k^+$ for the blade, trapezoidal and triangular riblets, or starting from $z^+\approx 3k^+$ for the asymmetric triangular riblets (figure 1). Above $z^+\approx 7k^+$, the mesh is still finer than typical smooth-wall DNSs with $1\lesssim \varDelta _y^+\lesssim 3$ ( $n_s=11$). The streamwise grid spacing is approximately the same for all cases in table 2 ( $\varDelta _x^+\approx 6$), finer than typical smooth-wall DNSs. Overall, these grid sizes ( $\varDelta _x^+$ and $\varDelta _y^+$) are also in line with previous riblet DNSs, where $\varDelta _x^+\leqslant 9$ and $\varDelta _y^+\leqslant 4$ (García-Mayoral & Jiménez Reference García-Mayoral and Jiménez2011b, Reference García-Mayoral and Jiménez2012). Furthermore, from the grid convergence study by Endrikat et al. (Reference Endrikat, Modesti, MacDonald, García-Mayoral, Hutchins and Chung2021b), the grid used for T950 ( $n_s=33$, $\Delta x^+=6$ and $0.3\lesssim \Delta y^+\lesssim 7.1$ in table 2) has been previously shown to achieve convergence in terms of the mean velocity, turbulent stresses and energy spectra, by comparing against two coarser grids, and one finer grid than that of T950. The grid resolutions of the present cases are either similar to or finer than that of T950.
Streamwise uniform riblet mesh visualisation near the wall for present (non-asterisk) cases in table 2. Grid-line intersections represent locations of nodes, which are closely packed near the wall ( ${0.1\lesssim \varDelta _y^+\lesssim 0.5}$) and are coarsened further from the wall ( $21$ points per riblet spacing, ${0.5\lesssim \varDelta _y^+\lesssim 2}$), and further coarsened near the top boundary ( $11$ points per riblet spacing, $1\lesssim \varDelta _y^+\lesssim 3$, not shown in figure above). Riblet cross-sectional geometries shown are (a)
 ![]() , (b)
, (b) ![]() , (c)
, (c) ![]() and (d)
and (d) ![]() .
.

The aforementioned computational demands of conventional DNSs, coupled with the requisite fine grids near the wall, resulted in limited studies in the past (e.g. El-Samni, Chun & Yoon Reference El-Samni, Chun and Yoon2007; García-Mayoral & Jiménez Reference García-Mayoral and Jiménez2011a,Reference García-Mayoral and Jiménezb, Reference García-Mayoral and Jiménez2012), although experimental data are available (e.g. Choi Reference Choi1989; Bechert et al. Reference Bechert, Bruse, Hage, Van Der Hoeven and Hoppe1997; Grüneberger & Hage Reference Grüneberger and Hage2011; von Deyn et al. Reference von Deyn, Gatti and Frohnapfel2022). For the previous small riblet DNS cases, Choi et al. (Reference Choi, Moin and Kim1993) reported results for triangle riblets with tip angles of  $60^\circ$ (
![]() ) and
) and  $90^\circ$ (
![]() ), and with
), and with  $\ell _g^+\approx 14$ and $10$, respectively. However, these cases were not fully resolved in the streamwise direction ( $\varDelta _x^+\approx 35$). More recently, El-Samni et al. (Reference El-Samni, Chun and Yoon2007) performed DNSs of thin blade riblets (
![]() ) which showed similar results to experimental data by Bechert et al. (Reference Bechert, Bruse, Hage, Van Der Hoeven and Hoppe1997). García-Mayoral & Jiménez (Reference García-Mayoral and Jiménez2011a,Reference García-Mayoral and Jiménezb, Reference García-Mayoral and Jiménez2012) ran DNSs of thicker blade riblets (
) which showed similar results to experimental data by Bechert et al. (Reference Bechert, Bruse, Hage, Van Der Hoeven and Hoppe1997). García-Mayoral & Jiménez (Reference García-Mayoral and Jiménez2011a,Reference García-Mayoral and Jiménezb, Reference García-Mayoral and Jiménez2012) ran DNSs of thicker blade riblets (![]() ,
,  $k/s=0.5$, $t_r/s=0.25$, $5\lesssim \ell _g^+\lesssim 25$) at ${Re}_\tau =180$ and 550 and reported similar $\Delta U^+$ values (at matched $\ell _g^+$) between the two ${Re}_\tau$. Figure 2 shows that the measured $\Delta U^+$ values from table 2 are in good agreement with numerical data from past studies. Data from García-Mayoral & Jiménez (Reference García-Mayoral and Jiménez2011b, Reference García-Mayoral and Jiménez2012) show similar trends with our present blade riblets. Li & Liu (Reference Li and Liu2019) and Malathi et al. (Reference Malathi, Nardini, Vaid, Vadlamani and Sandberg2022) carried out boundary-layer DNSs for triangular riblets (
![]() and
and ![]() , respectively), the same as DNSs of Choi et al. (Reference Choi, Moin and Kim1993). The percentage drag reduction from Li & Liu (Reference Li and Liu2019) was converted to
, respectively), the same as DNSs of Choi et al. (Reference Choi, Moin and Kim1993). The percentage drag reduction from Li & Liu (Reference Li and Liu2019) was converted to  $\Delta U^+$, whilst $\Delta U^+$ from Malathi et al. (Reference Malathi, Nardini, Vaid, Vadlamani and Sandberg2022) was found directly from their mean profiles. These data agree well with our triangular riblet data (
![]() , figure 2), further validating the present DNS solver, minimal-channel approach and grid resolution choices. Finally, Bannier, Garnier & Sagaut (Reference Bannier, Garnier and Sagaut2015) performed wall-resolved large eddy simulation (LES) on trapezoidal riblets (
, figure 2), further validating the present DNS solver, minimal-channel approach and grid resolution choices. Finally, Bannier, Garnier & Sagaut (Reference Bannier, Garnier and Sagaut2015) performed wall-resolved large eddy simulation (LES) on trapezoidal riblets (![]() ) with
) with  $\ell _g^+\approx 10.7$. They reported $\Delta U^+\approx -1.4$ (
![]() , figure 2), which is larger by 10 % compared with our trapezoidal riblet at
, figure 2), which is larger by 10 % compared with our trapezoidal riblet at  $\ell _g^+\approx 10$. We would expect a smaller percentage difference at matched size. There are no existing data in the literature for comparison for the other geometries (i.e.
 ![]()
![]()
![]() ). Notably, for the two-scale trapezoidal riblet simulations (
). Notably, for the two-scale trapezoidal riblet simulations (![]() ), Endrikat et al. (Reference Endrikat, Newton, Modesti, García-Mayoral, Hutchins and Chung2022) found that the maximum attainable drag reduction is unaffected by the secondary riblet. Endrikat et al. (Reference Endrikat, Newton, Modesti, García-Mayoral, Hutchins and Chung2022) also characterised the appropriate size of
), Endrikat et al. (Reference Endrikat, Newton, Modesti, García-Mayoral, Hutchins and Chung2022) found that the maximum attainable drag reduction is unaffected by the secondary riblet. Endrikat et al. (Reference Endrikat, Newton, Modesti, García-Mayoral, Hutchins and Chung2022) also characterised the appropriate size of  $\ell _g^+$ for these two-scaled trapezoidal riblets.
Riblet drag-reduction performance  $DR$ (right axis) or roughness function $\Delta U^+$ (left axis) as a function of the square root of riblet groove area $\ell _g^+$. Axes on the right show the estimated percentage drag reduction, $DR$ converted from $\Delta U^+$ using (2.6) of Spalart & McLean (Reference Spalart and McLean2011), based on typical laboratory or DNS conditions ( ${{Re}_\tau \approx 500}$), and typical aircraft fuselage conditions ( ${Re}_\tau \approx 50\,000$). In the viscous regime, the smooth-wall turbulent structures are not disrupted by the small textures, apart from their wall-normal displacement relative to the mean flow, and thus $-\Delta U^+$ is the difference between the observed mean-flow origin and the turbulence origin (Gómez-de-Segura et al. Reference Gómez-de-Segura, Sharma and García-Mayoral2018b), which increases with size (Bechert et al. Reference Bechert, Bruse, Hage, Van Der Hoeven and Hoppe1997) up to a shape-independent size of $\ell _g^+\approx 10.7\pm 1$ (García-Mayoral & Jiménez Reference García-Mayoral and Jiménez2011b). Grey markers are data extracted from the mean profiles of (
![]() ) García-Mayoral & Jiménez (Reference García-Mayoral and Jiménez2011b, Reference García-Mayoral and Jiménez2012), (
) García-Mayoral & Jiménez (Reference García-Mayoral and Jiménez2011b, Reference García-Mayoral and Jiménez2012), (![]() ) Bannier et al. (Reference Bannier, Garnier and Sagaut2015) and (
) Bannier et al. (Reference Bannier, Garnier and Sagaut2015) and (![]() ) Malathi et al. (Reference Malathi, Nardini, Vaid, Vadlamani and Sandberg2022). Data from (
) Malathi et al. (Reference Malathi, Nardini, Vaid, Vadlamani and Sandberg2022). Data from (![]() ) Li & Liu (Reference Li and Liu2019) are extracted based on their
) Li & Liu (Reference Li and Liu2019) are extracted based on their  $DR$ values and converted to $\Delta U^+$. Coloured markers are present DNS data from table 2.

3. Drag reduction of riblets in light of DNS data
3.1. Drag reduction in terms of Stokes-flow protrusion heights and observed virtual origins
Luchini et al. (Reference Luchini, Manzo and Pozzi1991) and Luchini (Reference Luchini1996) advanced a model for predicting riblet drag reduction using viscous (Stokes) flow. The model predicts the roughness function  $\Delta U^+$, which is related to the drag reduction $DR$, quantified by the fractional change in skin-friction coefficient $C_f$ relative to a baseline smooth wall, $DR\equiv 1-C_f/C_{f0}$, where subscript 0 refers to the smooth wall. The roughness function $\Delta U^+$ is given by $\Delta U^+=U_{\delta 0}^+-U_\delta ^+$ at matched ${Re}_\tau$, where $U_\delta ^+$ is the mean velocity at the edge ( $z=\delta$) of the wall-bounded turbulence. Since $C_f\equiv 2/{U_\delta ^+}^2$, we can relate $DR$ and $\Delta U^+$ at matched ${\delta ^+={Re}_\tau }$ by ${DR = 1-(1-\Delta U^+/U_{\delta 0}^+)^{-2} \sim -2\Delta U^+/U_{\delta 0}^+}$ for small drag changes, or equivalently, $DR\sim -(2C_{f0})^{1/2}\Delta U^+$ (Spalart & McLean Reference Spalart and McLean2011; Garcıa-Mayoral, Gómez-de-Segura & Fairhall Reference García-Mayoral, Gómez-de-Segura and Fairhall2019). Figure 2 demonstrates the conversion between $\Delta U^+$ and $DR$ for two values of ${Re}_\tau$.
Figure 2 shows  $\Delta U^+$ of conventionally shaped riblets (e.g.
 ![]()
![]()
![]() ), after Bechert et al. (Reference Bechert, Bruse, Hage, Van Der Hoeven and Hoppe1997), and of asymmetrical (
), after Bechert et al. (Reference Bechert, Bruse, Hage, Van Der Hoeven and Hoppe1997), and of asymmetrical (![]() ) and two-scaled (
) and two-scaled (![]() ) geometries as a function of the riblet size. The size is characterised by the square root of the riblet groove cross-sectional area,
) geometries as a function of the riblet size. The size is characterised by the square root of the riblet groove cross-sectional area,  $\ell _g^+$, as defined on the right of figure 2. By using $\ell _g^+$, the optimal (maximum) drag reduction occurs at a shape-independent size of ${\ell _{g,{opt}}^+\approx 10.7\pm 1}$ (García-Mayoral & Jiménez Reference García-Mayoral and Jiménez2011a,Reference García-Mayoral and Jiménezb). For riblets below the optimal size ( $\ell _g^+\lesssim 10.7$), $-\Delta U^+$ increases with $\ell _g^+$. To predict this trend, Luchini et al. (Reference Luchini, Manzo and Pozzi1991) and Luchini (Reference Luchini1996) proposed a linear viscous model for $-\Delta U^+$ designed for vanishingly small riblets ( $\ell _g^+\rightarrow 0$)
 \begin{equation} -\Delta U^+\approx\mu_0(h_\parallel^+-h_\perp^+)=\mu_0(h_\parallel{/}\ell_g-h_\perp{/}\ell_g)\ell_g^+, \end{equation}
where  $h_\parallel$ and $h_\perp$ are the Stokes-flow protrusion heights to locate the virtual origins perceived by streamwise and spanwise motions (velocities), respectively. The protrusion heights scaled by the riblet size, $h_\parallel /\ell _g$ and $h_\perp /\ell _g$, can be routinely obtained from Stokes-flow calculations for a given riblet shape (Luchini et al. Reference Luchini, Manzo and Pozzi1991; Bechert et al. Reference Bechert, Bruse, Hage, Van Der Hoeven and Hoppe1997; Grüneberger & Hage Reference Grüneberger and Hage2011; García-Mayoral & Jiménez Reference García-Mayoral and Jiménez2011a), and the protrusion-height difference ( ${h_\parallel /\ell _g-h_\perp /\ell _g}$) expresses the effect of riblet shape on the drag performance. The proportionality constant, $\mu _0$ in (3.1), relates the protrusion heights to $-\Delta U^+$. The ansatz of Luchini (Reference Luchini1996) implies $\mu _0=1$. However, the empirical values, $\mu _0=0.785$ (Bechert et al. Reference Bechert, Bruse, Hage, Van Der Hoeven and Hoppe1997; Grüneberger & Hage Reference Grüneberger and Hage2011) and $\mu _0=0.66$ (Jiménez Reference Jiménez1994; García-Mayoral & Jiménez Reference García-Mayoral and Jiménez2011b) have also been used. Figure 3(a) shows $\Delta U^+$ compensated by the respective ${h_\parallel /\ell _g-h_\perp /\ell _g}$ and compares these DNS results with (3.1) using the aforementioned values of $\mu _0$. Here, the 30 % scatter in $\mu _0$ from the literature is reproduced by the present DNS data for riblets sizes up to $\ell _g^+\approx 8$. This scatter suggests that $\mu _0<1$ may be based on the $\Delta U^+$ of non-vanishing riblet sizes that departs from the linear trend of (3.1). Towards vanishingly small riblet sizes ( $\ell _g^+\approx 5$), discrepancies for different geometries are small and tend towards $\mu _0=1$, consistent with Luchini (Reference Luchini1996). However, we observe typical departures from linearity of (3.1) near the optimum ( $\ell _g^+\approx 10.7$). Extrapolating (3.1) to the optimal size overpredicts the drag reduction by up to 40 % (figure 3a). For riblets, which yield small drag changes, such overprediction is especially undesirable. To account for this departure at the optimum ( $\ell _{g,{opt}}^+$), García-Mayoral & Jiménez (Reference García-Mayoral and Jiménez2011a) introduced an empirical constant $0.83$ when evaluating $DR$ and (3.1), ${DR_{{max}}=(2C_{f0})^{1/2}0.83\mu _0(h_\parallel /\ell _g-h_\perp /\ell _g)\ell _{g,{opt}}^+}$ ( $\bullet$, figure 3a). However, the data in figure 3(a) indicate that this empirical constant has a 20 % discrepancy.
(a) Roughness function  $\Delta U^+$ normalised by the protrusion-height difference, ${h_\parallel /\ell _g-h_\perp /\ell _g}$, reproduces a scatter in $\mu _0$ from (3.1), which is consistent with the scatter in $\mu _0$ in the literature (indicated by the dashed grey lines). Black marker ( ${\bullet }$) in (a) is an approximation of $DR_{{max}}$ by García-Mayoral & Jiménez (Reference García-Mayoral and Jiménez2011a,Reference García-Mayoral and Jiménezb) using $\mu _0=1$. (b) Value of $\Delta U^+$ normalised by the difference of the mean and turbulence virtual origins, $\ell _U/\ell _g-\ell _T/\ell _g$ from (3.2) shows a smaller scatter than the protrusion-height normalisation shown in (a).

Using the present DNS dataset, we will next review and assess the physical idea behind the aforementioned discrepancies. The Stokes-flow protrusion heights ( $h_\parallel ^+$ and $h_\perp ^+$) in (3.1) are meant to capture the observed virtual origins of the mean flow ( $\ell _U^+$) and turbulence ( $\ell _T^+$), respectively. In fact, figure 3(b) shows that it is the difference in the observed virtual origins, $\ell _U^+-\ell _T^+$ (measured a posteriori from DNS data), that better quantifies $-\Delta U^+$. These virtual origins are illustrated in figure 4. Here, the quasi-streamwise vortices, which represent the turbulence, perceive an apparent origin at $\ell _T^+$ below the crest ( $z^+=-\ell _T^+$) that depends on the conditions at the riblet crest plane: no transpiration (figure 4b) or crest transpiration (figure 4c). We discuss the difference between these two conditions in § 3.2. The virtual origin of the mean flow is offset by $\ell _U^+$ (figure 4a), which is deeper than $\ell _T^+$ for drag-reducing riblets. As such, the turbulence is effectively pushed away from the wall, which causes the mean flow to slip near the grooves, thereby reducing drag. Luchini (Reference Luchini1996) linked these two virtual origins to the drag change $\Delta U^+$ by noting that the turbulence above riblets does not change relative to a smooth wall, apart from a shift of $\ell _T^+$. If true, the relationship between $\Delta U^+$ and $\ell _U^+$ and $\ell _T^+$ follows from the stress balance (at large ${Re}_\tau$), $\text {d} U^+/\text {d} z^+=1+\overline {u^\prime w^\prime }^+$, which constrains the riblet and smooth-wall mean gradients ( $\text {d} U^+/\text {d} z^+$) to match when the turbulence profiles ( $\overline {u^\prime w^\prime }$) collapse at all wall-normal locations, i.e. are smooth-wall like. Figure 5(a) shows the Reynolds shear stress profile ( $-\overline {u^\prime w^\prime }^+$) against the wall-normal distance from the riblet crest, $z^+$. Here, we see a scatter in $-\overline {u^\prime w^\prime }^+$ between riblet shapes and sizes. In figure 5(b), however, the same data are now shifted by their respective $\ell _T^+$ in the wall-normal direction, which collapses with the smooth-wall profile, consistent with Luchini (Reference Luchini1996). We compute $\ell _T^+$ by the wall-normal shift that optimally collapses with the smooth-wall Reynolds stress profile at heights in the range $4\lesssim z^+\lesssim 6$. We also find that the energy distribution across scales of near-wall turbulence over riblets mimics that above a smooth wall. Figure 6 shows the premultiplied two-dimensional cospectra of Reynolds shear stress at matched height above the virtual origin of turbulence of riblets ( $z^++\ell _T^+\approx 5$) compared with that of a smooth wall. Here, we observe a general trend that the near-wall turbulent structures are smooth-wall like for riblet sizes below the optimal ( $\ell _g^+\lesssim 10$). The smooth-wall-like behaviour above riblets suggests that quasi-streamwise vortices are maintained without a change in their statistics above the small grooves, except that they perceive an apparent origin at $z^+=-\ell _T^+$ (Gómez-de-Segura et al. Reference Gómez-de-Segura, Fairhall, MacDonald, Chung and Garcıa-Mayoral2018a). Now, in figure 4(a), if we set the origin of the smooth-wall mean profile at $z^+=-\ell _T^+$, then the difference between the origins of the smooth and riblet mean velocity profiles is $\ell _U^+-\ell _T^+$. And since there is a unity (viscous-scaled) mean velocity gradient near the wall, the difference in mean velocity approaching the crest is also $U^+-U_0^+=\ell _U^+-\ell _T^+$, where $U_0^+$ is the mean velocity above the smooth wall. Then from the stress balance, since $\overline {u^\prime w^\prime }^+$ profiles collapse, the gradient $\text {d} U^+/\text {d} z^+$ is the same at every $z^++\ell _T^+$ above the crest, and therefore, the velocity difference near the crest propagates into the overlying flow (Luchini Reference Luchini1996). This gives
 \begin{equation} -\Delta U^+\approx\ell_U^+-\ell_T^+=(\ell_U/\ell_g-\ell_T/\ell_g)\ell_g^+, \end{equation}
which we observe to be valid for riblets below the optimal size  $\ell _g^+<10.7$. Figure 5(c) shows the scatter between riblet shape and sizes in the mean velocity profiles along $z^+$. In figure 5(d), the mean velocity profiles as a function of the turbulence virtual-origin height, $z^++\ell _T^+$, now collapse when shifted downwards by their respective $\ell _U^+-\ell _T^+$, thus validating (3.2). We also illustrate (3.2) in figure 3(b) to contrast with (3.1) in figure 3(a). From figure 3(b) we observe that there is still a scatter near the optimal size for (3.2) due to an onset of departure from smooth-wall-like flows, but this scatter is smaller than that of (3.1) shown in figure 3(a). Furthermore, we observe that the linearity between $\Delta U^+$ and $\ell _g^+$ near the optimum is preserved for (3.2).
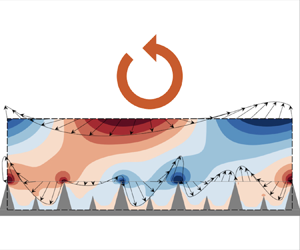
Small (viscous-scaled) riblets offset the apparent origins of the mean and turbulent flows downwards by (a)  $\ell _U$ and (b,c) $\ell _T$, respectively, relative to the riblet crests ( $z=0$). The turbulence (quasi-streamwise vortices) does not change relative to a smooth wall, apart from the $\ell _T$ offset (Luchini Reference Luchini1996). The difference between the offsets quantifies the drag reduction, $-\Delta U^+\approx \ell _U^+-\ell _T^+$ (Luchini Reference Luchini1996; Garcıa-Mayoral et al. Reference García-Mayoral, Gómez-de-Segura and Fairhall2019). (b) Luchini et al. (Reference Luchini, Manzo and Pozzi1991) suggested that the near-wall turbulence is dominated by spanwise motions, which is valid for vanishingly small riblets. (c) Presently, we include the effects of transpiration at the crest plane, which is crucial in setting $\ell _T^+$ (Gómez-de-Segura et al. Reference Gómez-de-Segura, Fairhall, MacDonald, Chung and Garcıa-Mayoral2018a; Ibrahim et al. Reference Ibrahim, Gómez-de-Segura, Chung and García-Mayoral2021) for non-vanishing riblets.

(a,b) Reynolds shear stress for small riblets  $({\ell _g^+\lesssim 10.7})$ with (a) the wall-normal coordinate origin at the crest, $z^+$, and (b) the wall-normal origin at the turbulence virtual origin, $z^++\ell _T^+$, which displays a smooth-wall-like behaviour. Inset shows the same profiles with linear-scaled wall-normal coordinate.(c,d) Mean velocity profile for all small riblets ( $\ell _g^+\lesssim 10$) as a function of (c) the crest-origin height, $z^+$, and (d) turbulence virtual-origin height, $z^++\ell _T^+$. The velocity profiles in (d) are shifted downwards by the respective $\ell _U^+-\ell _T^+$ that collapse perfectly with the smooth-wall profile ( $\ell _U^+=\ell _T^+=0$), hence $-\Delta U^+\approx \ell _U^+-\ell _T^+$ (Gómez-de-Segura et al. Reference Gómez-de-Segura, Fairhall, MacDonald, Chung and Garcıa-Mayoral2018a; Garcıa-Mayoral et al. Reference García-Mayoral, Gómez-de-Segura and Fairhall2019; Ibrahim et al. Reference Ibrahim, Gómez-de-Segura, Chung and García-Mayoral2021).

Premultiplied two-dimensional cospectra of Reynolds shear stress,  ${\kappa _x^+\kappa _y^+E_{uw}^+}$, in the plane, ${z^++\ell _T^+\approx 5}$. The contours are normalised by the matched Reynolds stress at the height of the plane ${\overline {u^\prime w^\prime }^+=\int _{0}^{\infty }\int _{0}^{\infty } E^+_{uw}\,\text {d}\lambda _x^+\,\text {d}\lambda _y^+}$, where $\lambda _x$ and $\lambda _y$ are the streamwise and spanwise wavelengths. Contours for smooth walls (– – –) are compared with contours for riblets (filled). All available $\ell _g^+\lesssim 8$ riblets show smooth-wall-like turbulence, whilst the onset of deviation from smooth walls is observed to occur at $\ell _g^+\approx 10$, except for the two-scale trapezoids (
![]() ) at
) at  $\ell _g^+\approx 7$. For large riblets ( $\ell _g^+\gtrsim 20$), the co-spectra contours generally break at $\lambda _y^+\approx s^+$ (——), which indicates pinning of turbulent structures by the riblet textures. Boxes near the top delimit the region of Kelvin–Helmholtz rollers (García-Mayoral & Jiménez Reference García-Mayoral and Jiménez2011b), which are present in
 ![]() and
and ![]() (Endrikat et al. Reference Endrikat, Modesti, García-Mayoral, Hutchins and Chung2021a).
(Endrikat et al. Reference Endrikat, Modesti, García-Mayoral, Hutchins and Chung2021a).

The ansatz of Luchini (Reference Luchini1996) suggests that the streamwise and spanwise protrusion heights are identical to the virtual origins of the mean and turbulence, i.e.  $\ell _U^+=h_\parallel ^+$ and $\ell _T^+=h_\perp ^+$, recovering (3.1) with $\mu _0=1$. Figure 7(a) demonstrates that $\ell _U^+=h_\parallel ^+$ is corroborated by the present data by observing that the ratio $\ell _U^+/h_\parallel ^+\approx 1$, even for sizes larger than the optimal ( $\ell _g^+\lesssim 15$). However, for the turbulence virtual origin, $\ell _T^+\ne h_\perp ^+$, even for riblet sizes near the optimum $5\lesssim \ell _g^+<10.7$ (figure 7b). The turbulence virtual origins $\ell _T^+$ are generally deeper than $h_\perp ^+$ ( $\ell _T^+/h_\perp ^+ > 1$), but seem to asymptote to $h_\perp ^+$ towards vanishingly small sizes ( $\ell _g^+\rightarrow 0$), consistent with Luchini et al. (Reference Luchini, Manzo and Pozzi1991). We also observe that $\ell _T^+$ deviates less from $h_\perp ^+$ for riblets with narrower (higher height-to-spacing ratio) grooves (e.g.
 ![]() ) for sizes below the optimal (
) for sizes below the optimal ( $\ell _g^+\lesssim 10.7$). For the post-optimal riblet sizes ( $\ell _g^+\gtrsim 10.7$), a much larger deviation from $h_\perp ^+$ is observed. Note that the value of $\ell _T^+$ for these post-optimal riblets does not accurately represent the turbulence virtual origin. When attempting to collapse the Reynolds stress profile in the range $4\lesssim z^+\lesssim 6$ (to find $\ell _T^+$), the virtual origin of the Reynolds stress is not well defined due to the departure from smooth-wall-like turbulence. For pre-optimal riblets, however, the virtual origin of the Reynolds stress profile is the same as the smooth wall when shifted by $\ell _T^+$, as observed in figure 5(b). Within these pre-optimal riblet sizes, we seek an accurate (viscous) drag model capable of predicting $\ell _T^+$ for all riblet shapes. One reason $\ell _T^+>h_\perp ^+$ is because the calculation of $h_\perp ^+$ neglects transpiration at the riblet crest plane (Gómez-de-Segura et al. Reference Gómez-de-Segura, Fairhall, MacDonald, Chung and Garcıa-Mayoral2018a). Here, transpiration refers to the spanwise-varying wall-normal flow in the cross-plane (predominantly induced by quasi-streamwise vortices), and does not refer to the variations of the streamwise velocity in the streamwise direction (cf. Bottaro Reference Bottaro2019). The slip/transpiration simulations of Habibi Khorasani et al. (Reference Habibi Khorasani, Lācis, Pasche, Rosti and Bagheri2022), which permit transpiration in both of these senses, show that it is indeed transpiration due to spanwise variation of the spanwise velocity that determines the displacement of quasi-streamwise vortices, and thus to the near-wall turbulent mixing and the generation of Reynolds stresses upon which $\ell _T^+$ is defined.
Comparison between (a) the observed mean virtual origin  $\ell _U^+$ from the DNS, and Stokes-flow streamwise protrusion height $h_\parallel ^+$ and between (b) the observed turbulent virtual origin from the DNS $\ell _T^+$, and Stokes-flow spanwise protrusion height $h_\perp ^+$, for non-vanishing riblet sizes, $\ell _g^+\gtrsim 5$. The mean virtual origin $\ell _U^+$ is computed by the distance from the crest to the virtual origin of the linearly extrapolated mean velocity profile with a gradient measured locally at $z^+\approx 1$. The turbulence virtual origin $\ell _T^+$ is computed by the wall-normal shift that best collapses the smooth-wall Reynolds stress profile within heights in the range $4\lesssim z^+ \lesssim 6$.

3.2. Transpiration effects at the riblet crest plane
Gómez-de-Segura et al. (Reference Gómez-de-Segura, Fairhall, MacDonald, Chung and Garcıa-Mayoral2018a) and Ibrahim et al. (Reference Ibrahim, Gómez-de-Segura, Chung and García-Mayoral2021) show that the turbulence virtual origin  $\ell _T^+$ is not set by the virtual origin for the spanwise velocity alone, but that wall-normal velocity (transpiration) also plays a role. They performed textureless DNS channel simulations with a Robin boundary condition prescribed on a reference plane ( $z=0$) for the streamwise ( ${u\rvert _{z=0}=\ell _x\partial {u}/\partial {z}\rvert _{z=0}}$), spanwise ( ${v\rvert _{z=0}=\ell _y\partial {v}/\partial {z}\rvert _{z=0}}$) and wall-normal ( ${w\rvert _{z=0}=\ell _z\partial {w}/\partial {z}\rvert _{z=0}}$) instantaneous velocities, where $\ell _x$, $\ell _y$ and $\ell _z$ are prescribed slip/transpiration lengths. These DNSs are termed slip/transpiration simulations. Physically, the streamwise and spanwise slip lengths, $\ell _x$ and $\ell _y$, correspond to the local equivalent distances below the reference plane at which a no-slip boundary condition is satisfied if the flow field is extrapolated linearly below the reference plane (Lauga & Stone Reference Lauga and Stone2003). For the wall-normal velocity, however, $\ell _z$ does not convey a slip effect but provides a local transpiration at the reference plane (Gómez-de-Segura et al. Reference Gómez-de-Segura, Fairhall, MacDonald, Chung and Garcıa-Mayoral2018a). The slip/transpiration simulations of Gómez-de-Segura et al. (Reference Gómez-de-Segura, Fairhall, MacDonald, Chung and Garcıa-Mayoral2018a) and Ibrahim et al. (Reference Ibrahim, Gómez-de-Segura, Chung and García-Mayoral2021) demonstrate that $\ell _T^+$ does not depend on the prescribed streamwise slip length $\ell _x^+$, no matter how large, but only on both $\ell _y^+$ and $\ell _z^+$ (cross-flow slip and transpiration lengths). This dependency suggests that $\ell _T^+$ is the origin perceived by the quasi-streamwise vortices that induce velocities in $y$ and $z$ (cf. Habibi Khorasani et al. Reference Habibi Khorasani, Lācis, Pasche, Rosti and Bagheri2022), as first proposed by Luchini et al. (Reference Luchini, Manzo and Pozzi1991). The independence to $\ell _x^+$, meanwhile, suggests that the origin of the streaks (the streamwise velocity fluctuations) does not influence $\ell _T^+$ (figure 11 of Ibrahim et al. Reference Ibrahim, Gómez-de-Segura, Chung and García-Mayoral2021).
From the results of these slip/transpiration simulations, Ibrahim et al. (Reference Ibrahim, Gómez-de-Segura, Chung and García-Mayoral2021) proposed an empirical expression for  $\ell _T^+$ in the smooth-wall-like regime
 \begin{equation}
{\ell_{T,{fit}}^+\approx \begin{cases} \displaystyle
\ell_w^++\frac{(\ell_v^+-\ell_w^+)}{1+(\ell_v^+-\ell_w^+)/5},
& \text{if }\ell_v^+ > \ell_w^+,\\
\ell_v^+ & \text{if }\ell_v^+\leqslant\ell_w^+, \end{cases}}
\end{equation}
\begin{equation}
{\ell_{T,{fit}}^+\approx \begin{cases} \displaystyle
\ell_w^++\frac{(\ell_v^+-\ell_w^+)}{1+(\ell_v^+-\ell_w^+)/5},
& \text{if }\ell_v^+ > \ell_w^+,\\
\ell_v^+ & \text{if }\ell_v^+\leqslant\ell_w^+, \end{cases}}
\end{equation}
as a function of the virtual origins of the spanwise and wall-normal root-mean-squared (r.m.s.) velocities,  $\ell _v^+$ and $\ell _w^+$, respectively. These virtual origins ( $\ell _v^+$ and $\ell _w^+$) are computed by collapsing the near-wall r.m.s. profiles from the DNSs with that of the smooth wall, and are related to (but distinct from) the slip/transpiration lengths ( $\ell _y^+$ and $\ell _z^+$). Here, when transpiration is allowed at the boundary-condition plane (non-zero r.m.s. wall-normal velocity, i.e. $\ell _w^+\ne 0$), the quasi-streamwise vortices are able to penetrate closer to the wall, which deepens the turbulence virtual origin $\ell _T^+$ (Gómez-de-Segura et al. Reference Gómez-de-Segura, Fairhall, MacDonald, Chung and Garcıa-Mayoral2018a), as shown by (3.3).
For pre-optimal riblets ( $\ell _g^+\lesssim 10.7$), we presently use (3.3) to explain the relationship between $\ell _T^+$ and transpiration (i.e. $\ell _w^+$). Figure 8(a) compares the DNS-obtained $\ell _T^+$ and the empirical $\ell _{T,{fit}}^+$, showing good agreement, except for the two-scale trapezoidal riblets (
![]() ) which exhibit the onset of departure from smooth-wall-like turbulence at
) which exhibit the onset of departure from smooth-wall-like turbulence at  $\ell _g^+\approx 7$ (figure 6m). Figure 8(b) demonstrates that all the riblet geometries tested here come close to satisfying $\ell _v^+\approx \ell _w^+$ and $\ell _w^+\ne 0$, the latter showing that crest-transpiration effects are relevant. As such, $\ell _T^+\approx \ell _v^+\approx \ell _w^+$ according to (3.3). This agreement (that $\ell _T^+\approx \ell _v^+\approx \ell _w^+$) is shown graphically in figure 9, where the r.m.s. cross-flow velocity profiles ( $v^{\prime +}$ and $w^{\prime +}$) of riblets collapse with those of the smooth wall after a wall-normal shift of $\ell _T^+$ (contrast figure 9a,b). In the case of non-vanishing riblets, the a priori spanwise protrusion height $h_\perp ^+$ differs from the a posteriori spanwise virtual origin $\ell _v^+$ (and from $\ell _T^+$), as uniform $v$ and zero $w$ (which are used to calculate $h_\perp ^+$) cannot adequately represent the finite length scale $v$ and $w$ fluctuations, typical of near-wall streamwise vortices near the crest.
(a) Turbulence virtual origin of riblets,  $\ell _T^+$ from DNS agree with $\ell _{T,{fit}}^+$ for $\ell _g^+\lesssim 10.7$ with the exception of
 ![]() riblets due to an onset of non-smooth-wall-like turbulence at
riblets due to an onset of non-smooth-wall-like turbulence at  $\ell _g^+\approx 7$ in figure 6.(b) Riblets of sizes $\ell _g^+\lesssim 10.7$ are in the $\ell _v^+\approx \ell _w^+$ regime regardless of shape, and thus, based on the empirical fit (3.3) by Ibrahim et al. (Reference Ibrahim, Gómez-de-Segura, Chung and García-Mayoral2021), $\ell _{T,{fit}}^+\approx \ell _v^+\approx \ell _w^+$.

(a,b) Root-mean-squared streamwise ( $u^{\prime +}$), spanwise ( $v^{\prime +}$) and wall-normal ( $w^{\prime +}$) velocity fluctuations and (c,d) streamwise vorticity fluctuation profiles for small riblets ( $\ell _g^+\lesssim 10.7$) and smooth wall (S395) from table 2 as a function of (a,c) $z^+$ (crest origin) and (b,d) $z^++\ell _T^+$ (turbulence virtual origin). The collapse of $v^{\prime +}$ and $w^{\prime +}$ profiles in (b) further corroborates (3.3), whilst that in (d) is consistent with the profiles from the slip/transpiration simulations of Gómez-de-Segura & García-Mayoral (Reference Gómez-de-Segura and García-Mayoral2020).

Figures 9(c) and 9(d) show that the r.m.s. streamwise vorticity fluctuation intensities,  $\omega _x^{\prime +}$, for riblets also collapse with the smooth wall when shifted by $\ell _T^+$ ( $\ell _T^+$ having been determined from the Reynolds shear stress), suggesting a strong correspondence between the streamwise vorticity and Reynolds shear stress. This collapse is also observed in the $\omega _x^{\prime +}$ profiles from slip/transpiration simulations of Gómez-de-Segura & García-Mayoral (Reference Gómez-de-Segura and García-Mayoral2020) when $\ell _v^+\approx \ell _w^+$. For the streamwise r.m.s. profiles $u^{\prime +}$, a shift of $\ell _T^+$ do not result in the collapse with the smooth-wall profile (see different peaks at $z^+\approx 15$ and slopes at $z^+\lesssim 5$ in figure 9b); a similar behaviour was observed in the $u^{\prime +}$ profiles of Ibrahim et al. (Reference Ibrahim, Gómez-de-Segura, Chung and García-Mayoral2021). This implies that the streamwise fluctuations do not contribute to setting the turbulence virtual origin, $\ell _T^+$.
This validation of (3.3) with riblets suggests that  $\ell _T^+$ can be predicted accurately when incorporating crest-transpiration effects. Presently, we propose a model to quantify $\ell _T^+$ a priori by explicitly modelling an effect of the quasi-streamwise vortices near the wall, bypassing the empirical expression to find $\ell _T^+$. In doing so, we will be able to form a physically justified model of the non-trivial behaviour of the empirical model (3.3).
3.3. Models of quasi-streamwise vortices
Vortical structures that consist of spanwise-varying cross-flow velocities have been previously modelled as a sinusoidal wave with one or a combination of two spanwise wavelengths,  $\lambda _y^+$ (Coles Reference Coles1978; Chapman & Kuhn Reference Chapman and Kuhn1986; Pollard et al. Reference Pollard, Savill, Tullis and Wang1994). Pollard et al. (Reference Pollard, Savill, Tullis and Wang1994) proposed a spanwise and time-varying sinusoidal function for the prescribed upper bound streamwise ( $u^\prime$), spanwise ( $v^\prime$) and wall-normal ( $w^\prime$) velocity fluctuations, using two values of $\lambda _y^+$ to model the autonomous behaviour of turbulence. Using these upper boundary conditions, they numerically solved the Navier–Stokes equations in a two-dimensional height-restricted domain ( $L_z^+\approx 40$) with no-slip smooth or riblet wall at the bottom. This model is similar to that of Chapman & Kuhn (Reference Chapman and Kuhn1986), where they also solved the Navier–Stokes equation in a two-dimensional height-restricted domain, but only for a smooth wall (see also Minnick Reference Minnick2022). Both models by Pollard et al. (Reference Pollard, Savill, Tullis and Wang1994) and Chapman & Kuhn (Reference Chapman and Kuhn1986) resolve the turbulence profile ( $\overline {u^\prime w^\prime }$) for both smooth and riblet walls, which can be used to predict $\ell _T^+$. However, these models require a Navier–Stokes simulation (involving the nonlinear terms). Coles (Reference Coles1978) suggested a simpler viscous sublayer model for the turbulence by approximating the velocity fluctuations using a time-independent, sinusoidal function, where the amplitudes are height dependent, tuned using an equation for the mean sublayer profile by Spalding (Reference Spalding1961). These velocities are approximated using one mode with a spanwise wavelength of $\lambda _y^+=100$, following from the typical spanwise spacing between two adjacent near-wall coherent streaks (Kline et al. Reference Kline, Reynolds, Schraub and Runstadler1967; Smith & Metzler Reference Smith and Metzler1983). Using this viscous sublayer model by Coles (Reference Coles1978), a turbulence profile up to $z^+\approx 15$ can be obtained. The viscous sublayer model by Coles (Reference Coles1978) is straightforward, but does not provide an extension to riblet walls. The model from Pollard et al. (Reference Pollard, Savill, Tullis and Wang1994) is able to include the riblet wall, but an unsteady numerical simulation of the two-dimensional Navier–Stokes equations is required.
These aforementioned models motivate our present modelling approach in § 4. We briefly discuss the present approach with the aid of an instantaneous wall-normal velocity field in the cross-plane in figure 10. In this region, a single isolated quasi-streamwise vortex induces an ejection event (Robinson Reference Robinson1991), which lifts up a streak, that is spaced approximately 100 viscous units from the neighbouring streak (Kline et al. Reference Kline, Reynolds, Schraub and Runstadler1967; Smith & Metzler Reference Smith and Metzler1983). These quasi-streamwise vortices are invariant across the outer-flow geometry and Reynolds number (Schlatter et al. Reference Schlatter, Li, Örlü, Hussain and Henningson2014). Each vortex has an average diameter of  $d^+\approx 20\unicode{x2013}40$ (Kim, Moin & Moser Reference Kim, Moin and Moser1987; Robinson Reference Robinson1991) and is essentially streamwise aligned with a length of 300 viscous units (Jeong et al. Reference Jeong, Hussain, Schoppa and Kim1997). The cores of these vortices are, on average, located 20 viscous units above a smooth wall (Kim et al. Reference Kim, Moin and Moser1987). This average is based on the location of the local peak in the r.m.s. streamwise vorticity profile (figure 9c,d).
Instantaneous wall-normal velocity field in the  $yz$-plane of the smooth-wall minimal-channel case (S395). Mean flow is out of the page. Near the wall ( $10\lesssim z^+\lesssim 20$), the intense wall-normal-velocity regions (dark blue and dark red) are induced by quasi-streamwise vortices (circular arrows). Grey arrows indicate the cross-flow velocity field, where ejection events (which lift up streaks) can be identified and observed to have a spacing of about 100 viscous units in the span (Kline et al. Reference Kline, Reynolds, Schraub and Runstadler1967; Smith & Metzler Reference Smith and Metzler1983). On average, the core diameter of these vortices are 30 viscous units (dashed circular region of intense streamwise vorticity) with the centre (‘ $+$’ symbols) located 20 viscous units above the wall. The dashed rectangular area represents the region of interest for the viscous vortex model, where the upper boundary is exposed to an overlying vortex that induces wall-normal (transpiration) and spanwise fluctuations.

The scales of the quasi-streamwise vortices inform the region of interest for the present model. Here, we employ a two-dimensional domain with a smooth or riblet wall at the bottom, following Pollard et al. (Reference Pollard, Savill, Tullis and Wang1994), but we solve the (viscous) Stokes equations, further restricting the domain height to the near-wall region,  $z^+\approx 12$ (see shaded region, figure 10). Since the $\ell _T^+$ shift is near the riblet wall, we do not need an explicit model for quasi-streamwise vortices (including their autonomous behaviour) farther away from the riblet wall. Instead, restricting the domain height to the near-wall region allows us to model the viscous response below these vortices. As such, the boundary condition at $z^+\approx 12$ of our present model is an ensemble-averaged flow induced by quasi-streamwise vortices, characterised by spanwise and wall-normal velocities varying sinusoidally in the spanwise direction and modelled using a single wavelength, $\lambda _y^+$, similar to Coles (Reference Coles1978). Jiménez, del Álamo & Flores (Reference Jiménez, del Álamo and Flores2004) noted that the spanwise wavelength of a vortex is $\lambda _y^+\approx 50$, as they observed the peak in the wall-normal velocity spectral density at $\lambda _y^+\approx 50$ and $\lambda _x^+\approx 300$, aligning closely with the signature of a quasi-streamwise vortex (Kim et al. Reference Kim, Moin and Moser1987; Robinson Reference Robinson1991; Jeong et al. Reference Jeong, Hussain, Schoppa and Kim1997; Schlatter et al. Reference Schlatter, Li, Örlü, Hussain and Henningson2014). In Appendix B, we perform a parameter calibration and sensitivity study to further inform our choice of $\lambda _y^+=50$. We further show in § 4 that a single $\lambda _y^+$ from the full turbulent flow signal is sufficient to determine $\ell _T^+$. We neglect the streamwise velocity $u$ because it is not responsible in setting $\ell _T^+$ (Ibrahim et al. Reference Ibrahim, Gómez-de-Segura, Chung and García-Mayoral2021). Since $u$ is absent, the present model does not provide a turbulence profile $\overline {u^\prime w^\prime }$. Instead, we calculate $\ell _T^+$ from the model by collapsing the r.m.s. streamwise vorticity profiles with a smooth-wall reference case. Indeed, the r.m.s. vorticity profiles also shift with the turbulence above riblets as shown in figure 9(d).
The spirit of the model is similar to the stretched spiral vortex by Lundgren (Reference Lundgren1982), where a simple flow structure allows us to calculate properties of the turbulent flow (cf. Pullin & Saffman Reference Pullin and Saffman1993). In our present model, we allow a simple vortical structure to interact with non-vanishing riblet textures in order to yield  $\ell _T^+$. The present approach departs from homogenisation techniques, which require the texture sizes to be vanishingly small compared with the turbulent scales. It also bypasses resolving the autonomous, nonlinear behaviour of turbulence over riblets (Pollard et al. Reference Pollard, Savill, Tullis and Wang1994; Minnick Reference Minnick2022), by predicting an averaged near-wall response induced by a quasi-streamwise vortex.
4. The viscous vortex model
The present model, which we term the viscous vortex model, predicts  $\ell _T^+$ by modelling the averaged near-wall response below a quasi-streamwise vortex governed by the steady, two-dimensional Stokes equations. The key aspect of the viscous vortex model, in contrast to the homogenisation approaches of Luchini et al. (Reference Luchini, Manzo and Pozzi1991) and Bottaro (Reference Bottaro2019), is that it does not require scale separation between turbulent flow structures and riblet textures. The model is designed to be applicable for non-vanishing, optimal riblet sizes where turbulent flow structures and riblet textures are comparable. We further demonstrate that the viscous vortex model is calibrated by smooth-wall DNS data alone, as we observe from the DNSs that the unpinned, smooth-wall-like nature of quasi-streamwise vortices persists even above riblet surfaces (see § 4.3). This observation suggests that the influence of riblets on the behaviour of these vortices is relatively limited, and the viscous vortex model remains applicable even in the presence of riblets up to the optimal size.
4.1. Formulation and methodology
This section includes a brief overview of the formulation and methodology of the viscous vortex model. We discuss further details of the model in §§ 4.2–4.3.
Figure 11 shows the viscous vortex domain used to model the flow below a quasi-streamwise vortex (representing turbulence). Here, we model a two-dimensional flow in the cross ( $yz$) plane, i.e. $\partial /\partial x=0$, given that the quasi-streamwise vortices are relatively long, ${\approx }300$ (Jeong et al. Reference Jeong, Hussain, Schoppa and Kim1997; Schlatter et al. Reference Schlatter, Li, Örlü, Hussain and Henningson2014) compared with the optimal riblet spacing ( $s^+\approx 15$, table 2). The model is an ensemble-averaged flow structure below a quasi-streamwise vortex (figure 10). The strength of this averaged structure is obtained by averaging the cross-flow Fourier amplitudes from smooth-wall DNSs (see § 4.2). Nonlinearity is essential in setting the strength of the near-wall structures (streaks and vortices) of the autonomous self-sustaining process in the buffer region ${10\lesssim z^+\lesssim 30}$ (e.g. Jiménez Reference Jiménez2018). However, by modelling only the flow very near the wall below the self-sustaining process in the buffer layer, we bypass directly contending with the nonlinearity. Instead, we only use a product of this nonlinear process, namely the strength of the vortical structures, as model input, which we measure once in a smooth-wall simulation since this part is identical to that of small riblets (e.g. figure 6). Thus, the modelled flow is governed by the steady Stokes equations
 \begin{align} -\frac{1}{\rho}\frac{\partial p}{\partial y} + \nu\left({\frac{\partial^2 v}{\partial y^2}+\frac{\partial^2 v}{\partial z^2}}\right) = 0, \quad -\frac{1}{\rho}\frac{\partial p}{\partial z} + \nu\left({\frac{\partial^2 w}{\partial y^2}+\frac{\partial^2 w}{\partial z^2}}\right) = 0, \quad \frac{\partial v}{\partial y} + \frac{\partial w}{\partial z} = 0, \end{align}
which are derived by neglecting nonlinearity and ensemble averaging the  $y$ and $z$ components of (2.1). We neglect the $x$ component of (2.1) because $\ell _T^+$ only depends on the cross-flow velocities (Ibrahim et al. Reference Ibrahim, Gómez-de-Segura, Chung and García-Mayoral2021). Up to here, this is the same set-up as that for calculating $h_\perp ^+$ (Luchini et al. Reference Luchini, Manzo and Pozzi1991), that is meant to be $\ell _T^+$. However, instead of prescribing spanwise-homogeneous, or infinitely large scale velocities at the top (Luchini et al. Reference Luchini, Manzo and Pozzi1991), we will instead prescribe the top velocities with a given scale (wavelength) and intensities (amplitudes)
 \begin{equation} w(y,z=h) =-A\sin(\beta y), \quad v(y,z=h) =-B\sin(\beta y +\varPhi), \end{equation}
as illustrated at the top of figure 11. Here,  $A$ and $B$ are the prescribed amplitudes, $\varPhi$ is the prescribed phase difference, $h$ is the prescribed height of the model domain measured from the riblet crest and $\beta$ is the period that is related to the prescribed wavelength, $\lambda _y$ ( ${\beta =2{\rm \pi} /\lambda _y}$). The top boundary condition (4.2) models the action below a vortex in the cross-plane, similar to the formulation of the sublayer model by Coles (Reference Coles1978). Furthermore, transpiration effects at the crest are readily incorporated through (4.2a), which is crucial to accurately predicting $\ell _T^+$ (Ibrahim et al. Reference Ibrahim, Gómez-de-Segura, Chung and García-Mayoral2021). Using the modelled cross-flow velocities at the upper boundary (4.2) and a no-slip smooth or riblet wall at the bottom, as well as periodic boundary conditions in the span, we can solve for $v$ and $w$ using (4.1).
The viscous vortex model. Stokes flow (4.1) is solved in the grey-coloured two-dimensional domain with the given spanwise and wall-normal velocity boundary condition at the top ( $z=h$), periodic sides and a no-slip smooth or riblet wall at the bottom. For the riblet surface, a uniform average of the solutions between $\varDelta =0$ and $\varDelta =s$ along the coordinate $\eta = y + \varDelta$ is performed to incorporate the unpinned, smooth-wall-like character of quasi-streamwise vortices. The model turbulence virtual origin, $\ell _{T,{VV}}$, is measured by the negative offset of the height of the domain $h$ measured from the crest plane such that the r.m.s. streamwise vorticity matches with that of the equivalent smooth wall at the local minimum (i.e. $z^++\ell _{T,{VV}}^+\approx 5$).

Even though the Stokes equation (4.1) is formally in the limit of zero Reynolds number, we retain the effect of finite friction Reynolds number,  ${Re}_\tau$, in the Stokes calculation through, for example, the riblet spacing, $s^+$
$s^+$
 \begin{equation} s^+=\lambda_y^+{(s/\lambda_y)}_{{VV}}, \end{equation}
where  $\lambda _y^+$ is associated with the quasi-streamwise vortex, and the ratio of riblet size to the wavelength, ${(s/\lambda _y)}_{{VV}}$, is prescribed in the Stokes calculation. Through this ratio, ${(s/\lambda _y)}_{{VV}}$, the model captures the non-vanishing riblet sizes relative to the near-wall turbulence (represented by the averaged quasi-streamwise vortex), with the latter characterised by a given universal scale, $\lambda _y^+$. From here on, sizes represented in the viscous vortex model are quantified in viscous units ( $+$), using a similar calculation as per (4.3).
The prescribed parameters ( $A$,
$A$,  $B$ and $\varPhi$) in (4.2) are obtained through a Fourier analysis of the DNS cross-flow velocities for a smooth and riblet wall, which we outline in detail in § 4.2. As the turbulence above small ( $\ell _g^+\lesssim 10.7$) riblets remains smooth-wall like, we use the same $A$,
$A$,  $B$ and $\varPhi$ to model the flow above both smooth and riblet walls. These parameters vary with height above the wall, $z^+$, and wavelength, $\lambda _y^+$. Once a height and wavelength are chosen, these set the height and span of the model domain, respectively (figure 11). The domain height should be within $10\lesssim H^+\lesssim 15$ such that the modelled flow is below the average height of the vortex centres (Kim et al. Reference Kim, Moin and Moser1987). This height also provides enough room for the flow to recover from the riblet wall boundary condition. The domain span is restricted by positive-integer ( $n$) multiples of $\lambda _y^+$, i.e. $L_y^+=n\lambda _y^+$, to ensure the spanwise periodicity of the top boundary condition (4.2).
Next, we specify the spanwise location of the riblet textures relative to the quasi-streamwise vortex, measured by  $\varDelta$, illustrated at the bottom of figure 11. As we will show from the DNS in § 4.3, the quasi-streamwise vortices above smooth-wall-like riblets ( $\ell _g^+\lesssim 10$) have an equal probability of residing at any spanwise location above the riblet wall, which indicates that these vortices are unpinned, like those above a smooth wall. We model this unpinned character of these vortices by a uniform average of the Stokes field across spanwise shifts of the riblet wall in the range $0\leqslant \varDelta \leqslant s$.
Using the above procedure, the modelled flow fields above smooth and riblet walls can be obtained. These flow fields are used to calculate  $\ell _{T,{VV}}^+$, which is the turbulence virtual origin predicted by the viscous vortex model. Here, $\ell _{T,{VV}}^+$ is found by iterating the negative offset of the riblet domain height $h^+$ measured from the crest plane, such that the modelled r.m.s. streamwise vorticity profile, $\omega _x^{\prime }$, matches with that of the equivalent smooth wall at the local minimum (i.e. $z^++\ell _{T,{VV}}^+\approx 5$). As we will show in § 4.3, once $\omega _x^\prime$ at the local minimum is matched, the entire profile above the riblet crests ( $z^+>0$) collapses with the equivalent modelled smooth wall profile. This is analogous to the collapse of the r.m.s. vorticity profiles measured from DNSs of riblet and smooth wall, as shown in figure 9(d), which reinforces that the modelled turbulence above riblets remains smooth-wall like. The output of the viscous vortex model, $\ell _{T,{VV}}^+$, for a range of riblet shape and sizes are reported and compared with $\ell _T^+$ measured from DNS in § 4.4.
4.2. Smooth-wall-like turbulence
This section outlines the process to obtain the magnitudes of  $A$,
$A$,  $B$ and $\varPhi$ in (4.2), through a Fourier analysis of the DNS cross-flow velocities for smooth and riblet walls. We also show that the DNSs of riblets are not required for the present model because $A$,
$A$,  $B$ and $\varPhi$ are the same as that for smooth walls at matched height above the turbulence virtual origin.
Figure 12 illustrates the process to obtain samples of the Fourier coefficients of the wall-normal velocity from the minimal-channel smooth-wall DNS (S395). We perform the same analysis for the spanwise velocity. Here, the goal is to extract the parameters for a single spatially localised near-wall quasi-streamwise vortex using a windowed Fourier analysis. At each cross-plane (at fixed  $x$ and $t$), we divide the spanwise and wall-normal ( $v,w$) velocity fields into overlapping segments of spanwise length, $L_{ys}^+\approx 150$. Figure 12(a) shows a segment for $0\lesssim y^+ \lesssim 150$, in which a vortex can be identified at $y^+\approx 60$. We also take segments at spanwise increments of 50 units, $50\lesssim y^+ \lesssim 200$ and $100\lesssim y^+\lesssim 250$ (both are not shown in figure 12a) to ensure we capture a vortex at the centre of the segment. For cases where the DNS channel spans are wider (i.e. SF395 and S1000 in table 2), the fields are segmented with the same $L_{ys}^+\approx 150$ and spanwise increments, resulting in more segments per $yz$-field. Segmenting the cross-plane is crucial as these vortices are usually isolated in the cross-plane (Robinson Reference Robinson1991; Jiménez et al. Reference Jiménez, del Álamo and Flores2004; Jiménez Reference Jiménez2018). The Fourier amplitudes from unwindowed samples contain distortions resulting from the average effect of multiple vortices (figure 10). The difference between the Fourier amplitudes obtained from segmented and unsegmented signals is discussed in detail in Appendix B.2. In figure 12(b), we multiply each segmented field by the normalised Hann window function, $\varOmega (y^+)=({2/3})^{1/2}[1-\cos (2{\rm \pi} y^+/L_{{ys}}^+)]$, so that the fields are periodic in $y$, and we can take the discrete Fourier transform at each height $z^+$
$z^+$
 \begin{align} \left\{{\hat{v}^+,\hat{w}^+}\right\}(\lambda_{y,m}^+={2{\rm \pi}}/{\kappa^+_m},z^+) = \frac{1}{N_{y{s}}}\sum_{n=0}^{N_{y{s}}-1}\left[{\left\{{{v}^+_n,{w}^+_n}\right\}(y^+_n,z^+)\varOmega(y^+_n)}\right] \exp\left({-\text{i}y_n^+\kappa^+_m}\right)\!, \end{align}
where  $\kappa _m=2{\rm \pi} m/L_{{ys}}$, $y_n=n L_{{ys}}/N_{y{s}}$ and $N_{y{s}}$ is the number of spanwise discrete points at a fixed height in a segment. In physical space, the velocities for each positive and finite wavelength $\lambda _y^+\equiv 2{\rm \pi} /\beta ^+$ can be written in terms of the Fourier coefficients as
 \begin{equation} \left\{{v^+_{\lambda_y^+},w^+_{\lambda_y^+}}\right\}({y}^+{,{z}^+}) = 2\left\{{|\hat{v}^+|,|\hat{w}^+|}\right\}\sin\left({{\beta^+}y^++ \angle{\left\{{\hat{v}^+,\hat{w}^+}\right\}} + {\rm \pi}/2}\right)\!, \end{equation}
for a fixed height  $z^+$ and for each segment, where $|(\hat {\cdot})|\equiv [{\textrm {Re}\{(\hat{\cdot})\}^2 + \textrm {Im}\{(\hat{\cdot})\}^2}]^{1/2}$ and ${\angle {(\hat{\cdot})}}$ is the argument of ${{(\hat{\cdot})}}$ from the positive $\lambda _y^+$. The factor of 2 in (4.5) is included in the amplitude to combine both positive and negative $\lambda _y^+$. We illustrate (4.5) in figure 12(c) for a single $\lambda _y^+\approx 50$, extracted from the full flow field in figure 12(b). We shift the spanwise coordinate ${y}^+=\tilde {y}^+ - (\angle {\hat {w}^+}+{\rm \pi} /2)/\beta ^+$ so that these sinusoids resemble the upper boundary velocities of the viscous vortex model in (4.2)
 \begin{align} w^+_{\lambda_y^+}({\tilde{y}}^+,z^+) = 2|\hat{w}^+|\sin\left({{\beta^+}\tilde{y}^+}\right), \quad v^+_{\lambda_y^+}(\tilde{y}^+,z^+) = 2|\hat{v}^+|\sin\left({{\beta^+}\tilde{y}^++ \angle{\hat{v}^+}-\angle{\hat{w}^+}}\right)\!. \end{align}
We extract each component of the signal, namely the amplitude ( $a_j,b_j$) and phase difference ( $\varphi _j$), given by
 \begin{equation} b_j(\lambda_y^+,z^+) \equiv 2|\hat{v}^+|, \quad a_j(\lambda_y^+,z^+) \equiv 2|\hat{w}^+|, \quad \varphi_j(\lambda_y^+,z^+) \equiv \angle{\hat{v}}-\angle{\hat{w}}, \end{equation}
where  $j$ is the sample index within the range $1\leqslant j\leqslant N_{{seg}}N_xN_t$. The upper bound (maximum number of samples) of $j$ is the product of the number of segments for each $yz$-field ( $N_{{seg}}$), the number of $yz$-fields in the streamwise direction ( $N_x$) and the number of time snapshots ( $N_t$).
Illustration of the process to extract the Fourier coefficients from both spanwise and wall-normal instantaneous velocities in the cross-plane. Mean flow is out of the page. Instantaneous wall-normal velocity field in the  $yz$-plane in figure 10 is segmented into overlapping segments of length, $L_{{ys}}^+\approx 150$: $0\lesssim y^+\lesssim 150$ (shown in a), $50\lesssim y^+\lesssim 200$ and $100\lesssim y^+\lesssim 250$ (the last two not shown in the figure). (b) Segments are multiplied by a normalised Hann window function, ${\varOmega (y^+)=({2/3})^{1/2}[1-\cos (2{\rm \pi} y^+/L_{{ys}}^+)]}$ so that a Fourier transform can be applied. (c) Resulting field for one wavelength, $\lambda _y^+\approx 50$, where samples of the Fourier amplitudes as a function of $z^+$ can be obtained.

Figures 13(a)–13(c) depict the p.d.f. of the samples (4.7) obtained from the smooth-wall DNS cases. These include the full-channel and minimal-channel smooth walls at  ${Re_\tau =395}$, as well as a minimal-channel smooth-wall case at ${Re}_\tau =1000$. The samples in these p.d.f.s correspond to a height of $z^+\approx 12$, i.e. below the average vortex core height of $z^+\approx 20$ (Kim et al. Reference Kim, Moin and Moser1987) and a sinusoidal wavelength of $\lambda _y^+\approx 50$ to represent a quasi-streamwise vortex (Jiménez et al. Reference Jiménez, del Álamo and Flores2004). At this specific height and wavelength, the p.d.f.s for the smooth-wall DNS cases collapse, indicating that the variables $A$,
$A$,  $B$ and $\varPhi$ are independent of the channel span and friction Reynolds number ${Re}_\tau$. By averaging the amplitude and phase difference across all samples $j$, we obtain $A=0.2$, $B=0.28$ and $\varPhi =0.31{\rm \pi}$. A value $\varPhi <0.5{\rm \pi}$ indicates that, on average, the quasi-streamwise vortices are tilted with respect to the streamwise direction (cf. Jeong et al. Reference Jeong, Hussain, Schoppa and Kim1997; Schlatter et al. Reference Schlatter, Li, Örlü, Hussain and Henningson2014). Our modelling choices of $z^+=12$ and $\lambda _y^+=50$ (and corresponding values of $A$,
$A$,  $B$ and $\varPhi$) are additionally supported by a parameter calibration and sensitivity study outlined in Appendix B.
Probability density functions (p.d.f.s) of the cross-flow parameters extracted from DNS (4.7a,b). These parameters correspond to  $\lambda _y^+\approx 50$ at a height of $z^++\ell _T^+\approx 12$. The p.d.f.s of the smooth-wall minimal-channel case at ${Re}_\tau =395$ are represented by the vertical bars in (a–f), compared with (a–c) the full-channel ${Re}_\tau =395$ smooth-wall case (——) and the minimal-channel ${Re}_\tau =1000$ smooth-wall case (——, grey), as well as (d–f) the blade (
![]() ) riblet cases with
) riblet cases with  $\ell _g^+\approx 5$, 10 and 16 (dark blue to light blue). The red vertical lines represent the mean values of these sample p.d.f.s, which are prescribed in the viscous vortex model, along with $\lambda _y^+=50$ and $H^+=12$.

As demonstrated in figures 13(d)–13( f), the values of  $A$,
$A$,  $B$ and $\varPhi$ obtained from minimal-channel DNSs of blade riblets (
![]() ) with sizes of
) with sizes of  $\ell _g^+\lesssim 10$ (i.e. cases BL08 and BL16 from table 2) are consistent with those from smooth-wall DNSs. For these riblets ( $\ell _g^+<10$), the p.d.f.s collapse when the parameters are extracted at equivalent heights above the turbulence virtual origin, $z^++\ell _T^+\approx 12$. This collapse further shows that the turbulence above riblets behaves like that above a smooth wall, and demonstrates that only smooth-wall DNS data are required to obtain $A$,
$A$,  $B$ and $\varPhi$. The p.d.f.s for large, non-smooth-wall-like riblets ( $\ell _g^+\approx 16$) in figures 13(d)–13( f) appear similar to the smooth-wall equivalents, but exhibit noticeably lower peaks in $b_j$ and $\varphi _j$, suggesting that $A$,
$A$,  $B$, and $\varPhi$ at $\lambda _y^+\approx 50$ and $z^++\ell _T^+\approx 12$ are not overly sensitive to the drag-increasing mechanisms associated with these riblets, in contrast to the full Reynolds stress cospectra at $z^++\ell _T^+\approx 5$ (figure 6e).
The above observation suggests that the information from one wavelength is sufficient to compute  $\ell _T^+$. Moreover, this wavelength ( $\lambda _y^+=50$) is also of the same order as the riblet sizes ( $10\lesssim s^+\lesssim 15$). Thus, these parameters for obtaining $\ell _T^+$ appear robust and do not require the stricter scale separation between the riblet textures and turbulence imposed on homogenisation techniques.
4.3. The unpinned, smooth-wall-like quasi-streamwise vortices above riblets
In this section, we justify from DNS that the quasi-streamwise vortices above riblets are unpinned like those above a smooth wall. We incorporate this character of vortices in the viscous vortex model by a uniform average of the solutions across spanwise shifts  $\varDelta$ of the riblet texture (figure 11).
We have previously shown, from the DNSs, that the flow above small riblets ( $\ell _g^+\lesssim 10.7$) is smooth-wall like in terms of the collapse of the Reynolds stress profiles (figure 5b) and the collapse of Fourier amplitudes and phases (figures 6 and 13). Thus, we expect the quasi-streamwise vortices (representing turbulence) above riblet walls to behave as if above featureless smooth walls, which have no preferential spanwise position relative to the riblets. Figure 14 shows that these vortices above either a smooth wall or small riblets are unpinned, through a uniform p.d.f. of the DNS cross-flow velocity phase shifts at wavelengths $\lambda _y^+$ similar to the average diameter of a vortex. Here, we quantify the relative spanwise positions of the vortex by phase shifts of the spanwise and wall-normal velocities, $\phi _v\equiv \angle {\hat {v}}$ and $\phi _w\equiv \angle {\hat {w}}$, respectively. These phase shifts are found from the argument of the discrete Fourier transform of the velocity signals from (4.4). Samples of the phase shifts are taken at a height of 12 units above the turbulence virtual origin, $z^++\ell _T^+\approx 12$, from the DNSs of smooth walls (figure 14a, f) and blade (
![]() ) riblets (figure 14b–e,g–j). For the wavelengths considered (
) riblets (figure 14b–e,g–j). For the wavelengths considered ( $10\leqslant \lambda _y^+\leqslant 60$), the uniform p.d.f.s (white regions) for the smooth and $\ell _g^+\approx 5$ blade riblets (figure 14a,b, f,g) demonstrate that the flow signals shift between $-{\rm \pi}$ and ${\rm \pi}$ at equal probability, indicative of unconstrained turbulent motions for these scales. This further demonstrates that the turbulent flow is smooth-wall like above riblets of this size. For $8\lesssim \ell _g^+\lesssim 16$ (figure 14c,d,h,i), we observe that wavelengths close to the riblet spacing, $\lambda _y^+\approx s^+$ (——) are pinned by the riblet textures, indicated by the varying p.d.f. along $-{\rm \pi}$ to ${\rm \pi}$. As these pinned wavelengths increase with riblet spacing towards the average diameters of quasi-streamwise vortices ( $d^+\approx 25$, Kim et al. Reference Kim, Moin and Moser1987; Robinson Reference Robinson1991; Jeong et al. Reference Jeong, Hussain, Schoppa and Kim1997), the textures begin to interfere with these vortex scales, disrupting the smooth-wall-like behaviour of the cross-flow velocity fields. A small interference at this scale is seen for the $w$ phase shifts $\phi _w$ of $\ell _g^+\approx 10$ riblets ( $\lambda _y^+\approx 2s^+\approx 30$, figure 14i), indicating that pinning may be a mechanism resulting in the onset of departure from smooth-wall-like flows at $\ell _g^+\approx 10$ (figure 6). For the riblets of size $\ell _g^+\approx 16$ (figure 14e, f), the peaks observed in the p.d.f.s of $\varphi _v$ and $\varphi _w$ for $\lambda _y^+\approx 25$ indicate that the scales of quasi-streamwise vortices are now pinned by the textures (Choi et al. Reference Choi, Moin and Kim1993; Lee & Lee Reference Lee and Lee2001). The pinning of vortices was thought to stabilise the streamwise streaks (Goldstein et al. Reference Goldstein, Handler and Sirovich1995; Goldstein & Tuan Reference Goldstein and Tuan1998), which thereby explained how smaller riblets reduced drag. However, figure 14(e,j) shows that vortex pinning is only active for the larger (post-optimal) riblets ( $\ell _g^+\gtrsim 10$), suggesting that pinning is actually associated with drag increase (see also § 5.1 of García-Mayoral & Jiménez Reference García-Mayoral and Jiménez2011b).
Probability density functions of the phase shifts of  $v$ and $w$ fluctuations ( $\phi _v$ and $\phi _w$, respectively) as a function of wavelength, $\lambda _y^+$, at $z^++\ell _T^+\approx 12$. These shifts quantify the spanwise location of the flow structures of various sizes $\lambda _y^+$ in the $yz$-plane. The cases considered are (a, f) full-span smooth wall (SF395), and blade (
![]() ) riblets of sizes (b,g)
) riblets of sizes (b,g)  $\ell _g^+\approx 5$, (c,h) $\ell _g^+\approx 8$, (d,i) $\ell _g^+\approx 10$ and (e,j) $\ell _g^+\approx 16$. For each $\lambda _y^+$, white regions indicate a p.d.f. of 0.5 where phase shifts are of equal probability, indicating the turbulent scales are unpinned by the wall. Regions bounded by red contours are where the p.d.f. is above 0.6, and blue contours are where the p.d.f. is less than 0.4, which shows that the turbulent scales are pinned by the riblet textures, particularly when the wavelength is approximately the size of the riblet spacing, $\lambda _y^+\approx s^+$, indicated by a solid black line (——).

From the analysis above, the quasi-streamwise vortices ( $d^+\approx 25$) are unpinned above riblets with sizes below the optimal, $\ell _g^+\lesssim 10.7$. We incorporate this unpinned character of vortices in the viscous vortex model by uniformly averaging the solutions at all spanwise locations of the riblets relative to the vortex. We quantify the relative spanwise position by $\varDelta$ through a related spanwise coordinate $\eta =y + \varDelta$, which has an origin at a riblet crest (figure 11). Here, the coordinate $y$ is fixed to the location of zero wall-normal velocity at the upper boundary, i.e. $w(y=0,h)=0$ (blue line, figure 11), and $\varDelta$ is the horizontal shift of the wall relative to $y$. Hence, increasing $\varDelta$ horizontally shifts the wall whilst fixing the top velocity boundary condition. Figures 15(a)–15(c) show the solution fields for the spanwise and wall-normal velocities and the streamwise vorticity for $\varDelta =0$ (no shift, filled contours) and $\varDelta =s/2$ (half-riblet-spacing shift, solid line contours) for the two-scale trapezoidal riblets with $\ell _g^+\approx 5.5$, or $s^+=10$, where $s^+$ is computed using (4.3). Near the top, the solutions are similar for the various shifts of $\varDelta$ because of the same prescribed top boundary conditions. However, differences are seen near the wall, particularly for the vorticity (figure 15c), where we observe local peaks in vorticity near the crests. These peaks are also observed in the instantaneous flow fields of Lee & Lee (Reference Lee and Lee2001), which were previously characterised as the centres of vortices. However, the Stokes solution in figure 15(c) suggests that these peaks are instead caused by a rapid change in velocity due to the no-slip crests.
The Stokes solution fields of (top to bottom) spanwise velocity ( $v$), wall-normal velocity ( $w$) and streamwise vorticity ( $\omega _x=\partial w/\partial y - \partial v/\partial z$) for the two-scale trapezoidal (
![]() ) riblets with
) riblets with  $\ell _g^+\approx 5.5$ ( $s^+=10$), where $s^+$ is computed using (4.3). (a–c) Two-scale riblet solutions for $\varDelta =0$ (filled contours, grey riblets) are compared with that for $\varDelta = s/2$ (——, phantom-lined riblets); (d–f) average two-scale riblet solutions for all $0\leqslant \varDelta < s$ (filled contours) show a collapse with the smooth wall (– – –) above the riblet crest plane, after a vertical offset by $\ell _{T,{VV}}^+$.

Using these two linearly independent solutions ( $\varDelta =0$ and $\varDelta =s/2$), we can analytically obtain additional solutions for any other $\varDelta$ (see Appendix C for more details). We then uniformly average the solutions in the range $0\leqslant \varDelta < s$, i.e. one riblet period by
 \begin{equation} \left\{{v,w,\omega_x}\right\}(y,z) = \frac{1}{s}\int_0^{ s}\left\{{v_\varDelta,w_\varDelta,\omega_{x,\varDelta}}\right\}(\varDelta,y,z)\,\text{d} \varDelta, \end{equation}
where  $({\cdot })_\varDelta$ denotes the Stokes solution for a given $\varDelta$. The phase-averaged solutions for the same two-scale trapezoidal riblets with $\ell _g^+\approx 5.5$ are illustrated in figures 15(d)–15( f) where each are compared with the equivalent smooth-wall case. Here, the value of $\ell _{T,{VV}}^+$ is determined by negatively offsetting the riblet domain height by a guessed value of $\ell _{T,{VV}}^+$, and then iterating on this value until the r.m.s. streamwise vorticity, $\omega _x^\prime$, matches with that above the equivalent smooth wall at the local minimum (i.e. $z^++\ell _{T,{VV}}^+\approx 5$). After matching $\omega _x^\prime$ at the local minimum, we also observe that the phase-averaged $v$,
$v$,  $w$ and $\omega _x$ collapse everywhere above the riblet crest plane ( $z^+>0$, figure 15d–f), which reflects the collapse of the DNS r.m.s. profiles in figure 9(b,d). The collapse also reaffirms the smooth-wall-like flow above riblets, even in regions close to the wall, after accounting for the unpinned character of quasi-streamwise vortices.
4.4. Drag predictions for riblets
In figure 16, we report the turbulence virtual origin calculated by the viscous vortex model,  $\ell _{T,{VV}}^+$, for all riblet geometries from table 2, and for blade riblets (
![]() ) by García-Mayoral & Jiménez (Reference García-Mayoral and Jiménez2011a,Reference García-Mayoral and Jiménezb). Figure 16(a) shows the comparison between the modelled
) by García-Mayoral & Jiménez (Reference García-Mayoral and Jiménez2011a,Reference García-Mayoral and Jiménezb). Figure 16(a) shows the comparison between the modelled  $\ell _{T,{VV}}^+$ and the DNS $\ell _T^+$ using a ratio between the two, $\ell _T^+/\ell _{T,{VV}}^+$. Here, we observe that $\ell _{T,{VV}}^+$ differs from $\ell _T^+$ in the range of 1 %–10 % for all present riblet geometries below the optimal size. This difference is noticeably less than $\ell _T^+/h_\perp ^+$ where the error in predicting $\ell _T^+$ becomes larger (up to $40\,\%$ at the optimal) with increasing size, because $h_\perp ^+$ is applicable only for vanishingly small riblets (figure 7b). For larger (post-optimal) riblets, the increased error in $\ell _{T,{VV}}^+$ can be attributed to the departure from a smooth-wall-like turbulence as well as the pinning of quasi-streamwise vortices, both of which are not accounted for in the viscous vortex model. Figures 16(b)–16(i) show the magnitudes of $\ell _T/\ell _g$ from DNS (coloured filled symbols), $\ell _{T,{VV}}/\ell _g$ from the viscous vortex model (open white symbols and black fitted lines), and $h_\perp /\ell _g$ from the protrusion-height model (grey lines) as a function of $\ell _g^+$. For each riblet shape, we compute $\ell _{T,{VV}}/\ell _g$ for several riblet sizes, then use a best-fit line to obtain $\ell _{T,{VV}}/\ell _g$ for a continuous range of riblet sizes. We observe that the viscous vortex model also predicts $\ell _T^+ \rightarrow h_\perp ^+$ for vanishingly small riblets ( $\ell _g\rightarrow 0$) ( ${\square }$, figure 16b), tending towards the same output as the protrusion-height model (Luchini et al. Reference Luchini, Manzo and Pozzi1991; Luchini Reference Luchini1996). Hence, $\ell _{T,{VV}}^+$ for any riblet size $\ell _g^+$ can be approximated as
 \begin{equation} \ell_{T,{VV}}^+= h_\perp^++ m_T\ell_g^{+2}, \end{equation}
where  $m_T$ is the gradient of the (empirical) best-fit line of $\ell _{T,{VV}}/\ell _g$ against $\ell _g^+$ for a given riblet shape. This gradient, $m_T$, can be computed by using at least two data points for a given riblet shape (e.g. figure 16d): (i) $h_\perp /\ell _g$ from the protrusion-height model for $\ell _g^+=0$, and (ii) $\ell _{T,{VV}}/\ell _g$ for one riblet size below the optimum. In figure 16, we observe that $m_T$ decreases with increasing height-to-spacing ratio, especially obvious for the triangular riblets with systematically varied tip angle $\alpha =30^\circ, 60^\circ, 90^\circ$ (figure 16d–f). Here, a larger $m_T$ is associated with a larger $\Delta U^+$ deviation from the linear protrusion-height model (3.1) at matched $\ell _g^+$, as observed in figure 3(a).
(a) Ratios of the observed  $\ell _T^+$ from DNS to the calculated $\ell _{T,{VV}}^+$ show that the present model accurately predicts $\ell _T^+$ for sizes below the optimum, $\ell _g^+\lesssim 10.7$. For convenience, the grey region indicates the range of $\ell _T^+/h_\perp ^+$, as in figure 7(b). (b–i) Turbulence virtual origin per unit $\ell _g$, $\ell _T/\ell _g$, as a function of riblet size, $\ell _g^+$. Coloured markers represent data from DNS, open markers are outputs of the viscous vortex model, $\ell _{T,{VV}}/\ell _g$, with a corresponding linear best-fit line (solid black). Solid grey lines indicate the spanwise protrusion height, $h_\perp /\ell _g$.

Figure 16(g) shows two calculations of  $\ell _{T,{VV}}/\ell _g$ at matched sizes for the asymmetric triangle riblets (
![]() ). Due to the asymmetric nature of the riblets, the Stokes solutions may differ depending on the direction of rotation of the modelled vortex. Here, we computed the additional
). Due to the asymmetric nature of the riblets, the Stokes solutions may differ depending on the direction of rotation of the modelled vortex. Here, we computed the additional  $\ell _{T,{VV}}/\ell _g$ by reversing the direction of the modelled vortex, i.e. changing the signs of (4.2). These two $\ell _{T,{VV}}/\ell _g$ differ only by 2 %, and hence, the direction of rotation of the modelled vortex does not significantly affect $\ell _{T,{VV}}/\ell _g$ for the asymmetric riblets.
Equation (4.9) is a second-order polynomial fit to the viscous vortex model, distinct from second- or higher-order asymptotic expansions in homogenisation. Higher-order asymptotic expansions formally require a scale ratio of riblets to turbulence approaching zero for convergence. Even the smallest coherent turbulent scales ( $\approx$30, such as the diameter of a near-wall vortex core) are of the order of the optimal riblet size, $s^+\approx 15$. At such a finite ratio, adding more terms need not improve the approximation of the expansion (Bender & Orszag Reference Bender and Orszag1978). As such, higher-order homogenisation techniques are formally invalid for finite viscous-scaled riblet textures (Ibrahim et al. Reference Ibrahim, Gómez-de-Segura, Chung and García-Mayoral2021). The present analysis also suggests that formal expansions, if successfully attempted, would inevitably involve tackling the nonlinear interactions of the flow that sets the model parameters ( $A$,
$A$,  $B$,
$B$,  $\varPhi$ and $\lambda _y^+$), noting that even the well-known streak spacing has not been calculated by any formal mathematical procedure. In other words, unless introduced explicitly, obtaining these model parameters requires modelling the self-sustaining process. Instead, here, we use the mean information from the nonlinear flow to retain the use of linear viscous equations in the spirit of Luchini et al. (Reference Luchini, Manzo and Pozzi1991). The present approach effectively bypasses the aforementioned challenges by recognising that the nonlinearity is similar regardless of the wall conditions (i.e. smooth-wall like), and thereby, requires us to determine the flow properties only once. Correspondingly, the ability of the present approach to accurately predict $\ell _T^+$ indicates that the essential physics have been captured.
With the accurate prediction of  $\ell _T^+$ at non-vanishing riblet sizes, we can now predict the drag reduction, $\Delta U^+$. As ${-\Delta U^+\approx \ell _U^+-\ell _T^+}$ (figure 5d) and $\ell _U^+\approx h_\parallel ^+$ (figure 7a), the drag prediction of the model can be written as
 \begin{equation} -\Delta U^+_{{VV}} = h_\parallel^+- \ell_{T,{VV}}^+, \end{equation}
by simply replacing  $h_\perp ^+$ with $\ell _{T,{VV}}^+$ in (3.1). Similar to the protrusion-height model, (4.10) consists of a priori quantities, which are solely based on a given riblet shape and size below the optimal ( $\ell _g^+\lesssim 10.7$). In figure 17, we note that $\Delta U^+_{{VV}}$ for all riblet shapes agree with $\Delta U^+$ measured from the present DNS, and from DNSs and wall-resolved LES of past studies (El-Samni et al. Reference El-Samni, Chun and Yoon2007; García-Mayoral & Jiménez Reference García-Mayoral and Jiménez2011b, Reference García-Mayoral and Jiménez2012; Bannier et al. Reference Bannier, Garnier and Sagaut2015; Li & Liu Reference Li and Liu2019; Malathi et al. Reference Malathi, Nardini, Vaid, Vadlamani and Sandberg2022; Cipelli Reference Cipelli2023), for riblet sizes up to $\ell _g^+\approx 10.7$. However, the experimental drag reduction of triangular and trapezoidal riblets from Bechert et al. (Reference Bechert, Bruse, Hage, Van Der Hoeven and Hoppe1997), shown in figure 17(b,e, f,i), generally exhibits lower magnitudes compared with DNS/wall-resolved LES data. Experimental drag-reduction measurements have been converted to $\Delta U^+$ based on matched bulk Reynolds number following from Bechert et al. (Reference Bechert, Bruse, Hage, Van Der Hoeven and Hoppe1997), ${{\Delta C_f}/{C_{f0}}\approx {\Delta U^+}/[{(2C_{f0})^{-1/2}+(2\kappa )^{-1}}]}$ using $\kappa =0.4$. Some error will be introduced into the converted $\Delta U^+$ values as the experiments were conducted in an asymmetric channel set-up (one smooth and one riblet wall). Nonetheless, considering figure 17(b), there is a 30 % discrepancy in the optimal performance of trapezoidal riblets (
![]() ) between the experimental and DNS data. A source of this discrepancy is the finite width of the milled riblet tips (e.g.
) between the experimental and DNS data. A source of this discrepancy is the finite width of the milled riblet tips (e.g. ![]() ), with tip bluntness having been shown to decrease drag performance (Walsh Reference Walsh1990; Bechert et al. Reference Bechert, Bruse, Hage, Van Der Hoeven and Hoppe1997; García-Mayoral & Jiménez Reference García-Mayoral and Jiménez2011a; Grüneberger & Hage Reference Grüneberger and Hage2011). While Bechert et al. (Reference Bechert, Bruse, Hage, Van Der Hoeven and Hoppe1997) did not provide measurements of the width of the trapezoidal (and triangular) riblet tips, the manufacturing tolerance can be estimated based on tip measurements of scalloped riblets (figure 9 of Bechert et al. Reference Bechert, Bruse, Hage, Van Der Hoeven and Hoppe1997), as
), with tip bluntness having been shown to decrease drag performance (Walsh Reference Walsh1990; Bechert et al. Reference Bechert, Bruse, Hage, Van Der Hoeven and Hoppe1997; García-Mayoral & Jiménez Reference García-Mayoral and Jiménez2011a; Grüneberger & Hage Reference Grüneberger and Hage2011). While Bechert et al. (Reference Bechert, Bruse, Hage, Van Der Hoeven and Hoppe1997) did not provide measurements of the width of the trapezoidal (and triangular) riblet tips, the manufacturing tolerance can be estimated based on tip measurements of scalloped riblets (figure 9 of Bechert et al. Reference Bechert, Bruse, Hage, Van Der Hoeven and Hoppe1997), as  $R/s \approx 0.01$– $0.02$ or $R \approx 0.03$– $0.11$ mm, where $R/s$ represents the ratio of effective tip radius $R$ to the riblet spacing $s$. Assuming a similar manufacturing tolerance for trapezoidal riblets implies $R/s \approx 0.03$ (
![]() ), or
), or  $R=0.13$ mm based on the provided $s=4$ mm spacing (figure 24 of Bechert et al. Reference Bechert, Bruse, Hage, Van Der Hoeven and Hoppe1997). With $R/s \approx 0.03$, the viscous vortex model would predict a degradation in optimal performance of ${\approx }15\,\%$ (figure 17b), accounting for half of the observed 30 % discrepancy. Grüneberger & Hage (Reference Grüneberger and Hage2011) repeated measurements using sharper flat-tipped trapezoidal riblets (equivalent to $R/s\approx 0.003\unicode{x2013}0.005$) with $\alpha =45^\circ$ in the same testing facility, and obtained better agreement with both the protrusion-height model and $\Delta U^+_{{VV}}$ (figure 17i), given the smaller $R/s$. A similar level of accuracy is observed when comparing the experimental data of von Deyn et al. (Reference von Deyn, Gatti and Frohnapfel2022), depicted in figure 17(j), whose riblets were manufactured to a tolerance of $R/s\approx 0.002$. Another source of disagreement with Bechert et al. (Reference Bechert, Bruse, Hage, Van Der Hoeven and Hoppe1997) is an unmatched bulk Reynolds number. Small changes in the effective channel height have been shown to significantly change $-\Delta U^+$ (von Deyn et al. Reference von Deyn, Gatti and Frohnapfel2022). Adjusting the experimental drag curve of Bechert et al. (Reference Bechert, Bruse, Hage, Van Der Hoeven and Hoppe1997) for the trapezoidal riblets (
![]() ) using an effective channel height starting from
) using an effective channel height starting from  $z^+=-\ell _{T,VV}^+$ compared with that from $z^+=-0.4k^+$ (figure 24 of Bechert et al. Reference Bechert, Bruse, Hage, Van Der Hoeven and Hoppe1997) results in a 5 % increase in $-\Delta U^+_{{opt}}$. Other sources of discrepancy include the finite fetch of the riblet test plate (cf. Garratt Reference Garratt1990; García-Mayoral & Jiménez Reference García-Mayoral and Jiménez2011a), and the unflushed transition from smooth channel to riblet test plates which induces pressure drag (cf. Bechert, Bruse & Hage Reference Bechert, Bruse and Hage2000; Spalart & McLean Reference Spalart and McLean2011; Li et al. Reference Li, de Silva, Rouhi, Baidya, Chung, Marusic and Hutchins2019; Smith, Yagle & McClure Reference Smith, Yagle and McClure2023).
Roughness function  $\Delta U^+$ of riblets as a function of riblet groove size, $\ell _g^+$. Roughness functions measured from DNS (coloured symbols) are compared with the linear protrusion-height model of Luchini et al. (Reference Luchini, Manzo and Pozzi1991) (——, grey) and the present drag prediction (4.10) for perfectly sharp riblets (——) and a tip-rounded trapezoidal riblet with $R/s\approx 0.03$ and $k/s\approx 0.4$ (– – –) in (b). Grey markers are LES/DNS results from (b) Bannier et al. (Reference Bannier, Garnier and Sagaut2015), (e) Choi et al. (Reference Choi, Moin and Kim1993), Malathi et al. (Reference Malathi, Nardini, Vaid, Vadlamani and Sandberg2022), Cipelli (Reference Cipelli2023), ( f) Li & Liu (Reference Li and Liu2019), (h) García-Mayoral & Jiménez (Reference García-Mayoral and Jiménez2011b, Reference García-Mayoral and Jiménez2012) and (k) El-Samni et al. (Reference El-Samni, Chun and Yoon2007). White circles ( ${\circ }$) are experimental $\Delta U^+$ from (b,e, f,k) Bechert et al. (Reference Bechert, Bruse, Hage, Van Der Hoeven and Hoppe1997), (i) Grüneberger & Hage (Reference Grüneberger and Hage2011) and (j) von Deyn et al. (Reference von Deyn, Gatti and Frohnapfel2022). Crosses ( $\boldsymbol {\times }$) in (i) are from Bechert et al. (Reference Bechert, Bruse, Hage, Van Der Hoeven and Hoppe1997). These experimental $\Delta U^+$ data, except for von Deyn et al. (Reference von Deyn, Gatti and Frohnapfel2022), are obtained by adjusting the percentage drag reduction $DR$ based on the respective flow conditions.

As (4.10) is quadratic in  $\ell _g^+$, the departure near the optimum from linearity of the extrapolated protrusion-height model (by up to 40 %, figure 3a) can also be captured. Figure 18 compares (4.10) and the extrapolated protrusion-height model (3.1) against the optimal drag reduction $\Delta U^+_{{opt}}$ obtained from the DNS/wall-resolved LES. Here, the riblet sizes are determined by the optimal drag reduction from the DNS and LES data. In figure 18(a), the overprediction of optimal drag reduction up to 40 % in the extrapolated protrusion-height model is somewhat mitigated by applying an empirical factor of 0.83 (García-Mayoral & Jiménez Reference García-Mayoral and Jiménez2011a,Reference García-Mayoral and Jiménezb), which instead leaves a discrepancy of $\pm 20\,\%$ among different riblet geometries. Note that, in the original work of Luchini et al. (Reference Luchini, Manzo and Pozzi1991), it was never suggested that the protrusion-height model could be used to predict $\Delta U^+_{{opt}}$, but was only intended to be valid for vanishingly small riblets. In figure 18(b), we observe that replacing $h_\perp ^+$ with $\ell _{T,{VV}}^+$ further improves the optimal drag prediction, and alleviates the 40 % overprediction from before.
Optimal riblet drag reduction obtained from DNS,  $\Delta U^+_{{opt}}$, compared with (a) an extrapolation of the protrusion-height model to the optimal size, and (b) the present drag-reduction prediction in (4.10). Markers indicate different riblet shapes consistent with figure 17. Riblet sizes are $10\lesssim \ell _g^+\lesssim 11$ depending on the optimal drag reduction available in the dataset.

5. Conclusion
In this paper, we present a flow-structure-based model governed by the steady, two-dimensional Stokes equations to accurately predict the drag performance,  $\Delta U^+$, of small riblets up to the optimal groove size ${\ell _g^+\lesssim 10.7}$ (figure 18). We first note that the flow above these riblets remains essentially smooth-wall like (figures 5b,d and 6), such that the drag performance is the difference in offsets of the mean flow and turbulence, $-\Delta U^+=\ell _U^+-\ell _T^+$ (Garcıa-Mayoral et al. Reference García-Mayoral, Gómez-de-Segura and Fairhall2019; Ibrahim et al. Reference Ibrahim, Gómez-de-Segura, Chung and García-Mayoral2021). As the mean-flow offset can be accurately captured by the longitudinal protrusion height of Luchini et al. (Reference Luchini, Manzo and Pozzi1991), $h_\parallel ^+=\ell _U^+$ (figure 7a), the present model solely predicts the turbulence offset, $\ell _T^+$, which the spanwise protrusion height is unable to accurately predict near the optimal riblet size, that is $h_\perp ^+<\ell _T^+$, as shown in figure 7(b).
As transpiration effects are negligible for vanishingly small riblets, the protrusion-height model can accurately predict the limiting gradient of the drag reduction. However, transpiration is relevant once the quasi-streamwise vortex can induce flow that penetrates the grooves of larger riblets. We show that transpiration is crucial at non-vanishing riblet sizes by evaluating an empirical fit for  $\ell _T^+$ (3.3) that includes transpiration effects (Ibrahim et al. Reference Ibrahim, Gómez-de-Segura, Chung and García-Mayoral2021) and that agrees with $\ell _T^+$ from the present DNSs of riblets (figure 8b). However, the empirical fit (3.3) requires a posteriori measurements from the riblet DNS r.m.s. velocities. To predict $\ell _T^+$ without DNS, here we take another approach in the spirit of the protrusion-height model by introducing a wall-normal velocity component due to a quasi-streamwise vortex.
The present model, which we term the viscous vortex model, represents an averaged near-wall response from the overlying quasi-streamwise vortex (representing turbulence) in the cross-plane. It allows for a given turbulent scale to interact with a non-vanishing riblet size, as opposed to previous homogenisation strategies that require vanishingly small textures. Furthermore, an explicit model of the self-sustenance of the quasi-streamwise vortex is not needed, since we only model the region dominated by viscosity near the wall. As such, the viscous vortex model is governed by the Stokes equations (4.1) with the appropriate domain size and boundary conditions (figure 11). By exposing the riblets to a vortical flow structure, modelled by spanwise-varying sinusoidal waves for the spanwise and wall-normal velocities (4.2) at the top of the domain, the crucial crest-transpiration effect is readily induced (figure 15b). The amplitudes and the phase shift of (4.2) are determined from a Fourier analysis of the cross-flow velocities in the DNS. As riblets exhibit smooth-wall-like flows, these amplitudes and phase shift are the same as that of the smooth wall at matched height relative to the turbulence virtual origin (figure 13d–f), demonstrating that DNSs of riblets are not required to formulate (4.2). Additionally, we uniformly average the solutions across spanwise shifts of the riblet wall to account for the unpinned character of quasi-streamwise vortices above riblet grooves, which is corroborated by uniform p.d.f.s of DNS cross-flow velocity phase shifts for riblets below the optimal size (figure 14). By incorporating these effects, the viscous vortex model is able to accurately predict  $\ell _T^+$ for riblets up to the optimal size (figure 16). We further propose an expression for $\ell _T^+$ for a given riblet shape in (4.9) to determine the drag prediction as a function of size, $\ell _g^+$, in (4.10). The present model accurately predicts the drag performance of riblets up to the optimal size, $\ell _g^+\lesssim 10.7$ (figure 18b) and alleviates the aforementioned 40 % discrepancy for optimal drag prediction that arises from assuming that $\ell _T^+=h_\perp ^+$.
Beyond the optimal size ( $\ell _g^+\gtrsim 10.7$), the present drag prediction, $\Delta U^+_{{VV}}$, does not capture the breakdown of the drag curve (figure 17). In this post-optimal region ( $\ell _g^+\gtrsim 10.7$), García-Mayoral & Jiménez (Reference García-Mayoral and Jiménez2011b) observed a rapid increase in the near-wall Reynolds stress, which departs from smooth-wall-like turbulence and contributes to the further increase in drag. The viscous vortex model, which only accounts for smooth-wall-like turbulence, does not capture this increase in Reynolds stress. Here, non-smooth-wall-like modifications such as Kelvin–Helmholtz rollers (García-Mayoral & Jiménez Reference García-Mayoral and Jiménez2011b) have been proposed, but other mechanisms are also active (Endrikat et al. Reference Endrikat, Modesti, García-Mayoral, Hutchins and Chung2021a; Modesti et al. Reference Modesti, Endrikat, Hutchins and Chung2021). Resolvent-based models for riblets (Chavarin & Luhar Reference Chavarin and Luhar2020; Ran, Zare & Jovanović Reference Ran, Zare and Jovanović2021) have also been shown to capture these non-smooth-wall-like mechanisms, which may provide avenues to model the full drag performance curve of riblets.
Acknowledgements
The authors gratefully acknowledge the anonymous reviewers for their comments on the manuscript.
Funding
The authors gratefully acknowledge the support of the Air Force Office of Scientific Research under award number FA2386-21-1-4018 (program managers: D.J. Newell and R.W. Carr, AOARD). We also thank D.R. Smith (EOARD) and G.L. Abate (AFOSR). This work is supported by the Australian Research Council Discovery Project DP170102595, and with the assistance of resources from NCI that is supported by the Australian Government and from Pawsey that is funded by the Australian Government and the Government of Western Australia.
Declaration of interests
The authors report no conflict of interest.
Appendix A. Measurement of Clauser–Hama roughness function at mismatched Reynolds number
The roughness function  $\Delta U^+$ is the vertical shift in the velocity profile between riblet and smooth walls in the log and wake regions at matched ${Re}_\tau$. Since we do not have an infinitely large ${Re}_\tau$ for our DNS, the Reynolds number effect on the log region may be significant if ${Re}_\tau$ is not exactly matched with the smooth wall (figure 19), which leads to an inaccurate measurement of $\Delta U^+$ (Gómez-de-Segura et al. Reference Gómez-de-Segura, Fairhall, MacDonald, Chung and Garcıa-Mayoral2018a). We demonstrate the analytical calculation of $\Delta U^+$ by first deriving the velocity profiles of riblet and smooth wall using the mean turbulent momentum balance equation for fully developed channel flow
 \begin{equation} 0=-\frac{1}{\rho}\frac{\mathrm dP}{\mathrm{d}\kern0.7pt x} + \nu\frac{\mathrm d^2 U}{\mathrm dz_*^2} - \frac{\mathrm d\overline{u^\prime w^\prime}}{\mathrm dz_*}, \end{equation}
where ( $z_*$) refers to the respective wall-normal coordinate for smooth wall ( $z$) or riblet wall ( $z_T$), $\overline {({\cdot })}$ denotes plane and time mean and $U$ is the plane and time mean streamwise velocity. The relationship between the imposed pressure gradient, $\text {d} P/\text {d}\kern0.06em x$ and the drag per plan area, $\tau _w$ can be found through a force balance of the control volume containing the channel fluid
 \begin{equation} -\frac{1}{\rho}\frac{\mathrm dP}{\mathrm{d}\kern0.7pt x} = \frac{1}{\rho}\frac{\tau_{w}}{\delta} > 0, \end{equation}
where  $\delta$ is the half-channel height measured from smooth wall, $\delta _s$ or mean riblet height, $\delta _r$ (see figure 19). For a smooth wall, (A1) is valid from $z=0$ to $\delta _s$, whilst for a riblet wall, the equation is valid from $z_T=\ell _T$ to $\delta _r^\prime$, supposing that the origin of turbulence, $\ell _T$, is known for the moment. Combining (A1) and (A2), and separating the analysis to smooth ( $s$ subscript) and riblet ( $r$ subscript)
 \begin{equation} \frac{\mathrm d}{\mathrm dz}\left({\nu_s\frac{\mathrm dU_S}{\mathrm dz} - \overline{u^\prime w^\prime}_S}\right) =-\frac{\tau_{ws}}{\rho_s}\frac{1}{\delta_s} \quad \frac{\mathrm d}{\mathrm dz_T}\left({\nu_r\frac{\mathrm dU_R}{\mathrm dz_T} - \overline{u^\prime w^\prime}_R}\right) =-\frac{\tau_{wr}}{\rho_r}\frac{1}{\delta_r}, \end{equation}
where the drag per plan area  $\tau _{ws}$, fluid density $\rho _s$, half-channel height $\delta _s$ and kinematic viscosity $\nu _s$ are for the smooth-wall simulation; $\tau _{wr}$, $\rho _r$, $\delta _r$ and $\nu _r$ are for the riblet-wall simulation. These simulations are independent of each other, hence we perform the mathematical analysis separately. First, we can obtain the total stress profile by integrating (A3) once with respect to $z$ or $z_T$. Using the imposed free-slip boundary condition at the top domain (figure 19), we
 \begin{align}
\left.\begin{array}{@{}rr@{}} \text{integrate both sides of
(A3a)} &
\text{integrate both sides of
(A3b)} \\
\text{from}\ z = z\ \text{to}\ \delta_s{:} & \text{from}\
z_T = z_T\ {\rm to}\ \delta_r^\prime{:}
\\
\left.\text{B.C.:}~\left({\nu_s\dfrac{{\rm d}U_S}{{\rm d}z}
- \overline{u^\prime
w^\prime}_S}\right)\right\vert_{z=\delta_s}=0 &
\left.\text{B.C.:}~\left({\nu_r\dfrac{{\rm d}U_R}{{\rm
d}z_T} - \overline{u^\prime
w^\prime}_R}\right)\right\vert_{z_T=\delta_r^\prime}=0\\
\Rightarrow {\nu_s\dfrac{{\rm d}U_S}{{\rm d}z} -
\overline{u^\prime w^\prime}_S} =
\dfrac{\tau_{ws}}{\rho_s}\left({1-\dfrac{z}{\delta_s}}\right)
& \Rightarrow {\nu_r\dfrac{{\rm d}U_R}{{\rm d}z_T} -
\overline{u^\prime w^\prime}_R} =
\dfrac{\tau_{wr}}{\rho_r}\dfrac{\delta_r^\prime-z_T}{\delta_r}.
\end{array}\right\}
\end{align}
\begin{align}
\left.\begin{array}{@{}rr@{}} \text{integrate both sides of
(A3a)} &
\text{integrate both sides of
(A3b)} \\
\text{from}\ z = z\ \text{to}\ \delta_s{:} & \text{from}\
z_T = z_T\ {\rm to}\ \delta_r^\prime{:}
\\
\left.\text{B.C.:}~\left({\nu_s\dfrac{{\rm d}U_S}{{\rm d}z}
- \overline{u^\prime
w^\prime}_S}\right)\right\vert_{z=\delta_s}=0 &
\left.\text{B.C.:}~\left({\nu_r\dfrac{{\rm d}U_R}{{\rm
d}z_T} - \overline{u^\prime
w^\prime}_R}\right)\right\vert_{z_T=\delta_r^\prime}=0\\
\Rightarrow {\nu_s\dfrac{{\rm d}U_S}{{\rm d}z} -
\overline{u^\prime w^\prime}_S} =
\dfrac{\tau_{ws}}{\rho_s}\left({1-\dfrac{z}{\delta_s}}\right)
& \Rightarrow {\nu_r\dfrac{{\rm d}U_R}{{\rm d}z_T} -
\overline{u^\prime w^\prime}_R} =
\dfrac{\tau_{wr}}{\rho_r}\dfrac{\delta_r^\prime-z_T}{\delta_r}.
\end{array}\right\}
\end{align}
In order to obtain profiles at similar scales, we normalise (A4) using the imposed kinematic viscosity,  $\nu _s$ or $\nu _r$ and the effective friction velocity. The effective friction velocity squared, $u_\tau ^2$, can be derived from the left-hand side of (A4a,b) where the total stress, ${\nu \,\textrm {d} U/\textrm {d} z_*-\overline {u^\prime w^\prime }}$ is fully dominated by the viscous stress, ${\nu \,\textrm {d} U/\textrm {d} z_*}$, i.e. zero Reynolds stress. For the smooth wall, this location is non-arbitrary (i.e. at $z=0$) where we recover ${\nu _s\,\textrm {d}{U_S}/\textrm {d}{z}={\tau _{ws}}/{\rho _s}}$ from the right-hand side. For riblets, the location of the virtual wall perceived by the turbulence is at the origin of turbulence, where virtually, the Reynolds stresses vanishes (Gómez-de-Segura et al. Reference Gómez-de-Segura, Fairhall, MacDonald, Chung and Garcıa-Mayoral2018a; Fairhall et al. Reference Fairhall, Abderrahaman-Elena and García-Mayoral2019; Ibrahim et al. Reference Ibrahim, Gómez-de-Segura, Chung and García-Mayoral2021). Hence, the effective friction velocity of riblet walls is found by extrapolating the total stress line (A4b) to the origin of turbulence ( $z_T=0$), i.e. evaluating the right-hand side of (A4b) at $z_T=0$ even though (A4b) is not defined there. The effective friction velocities for smooth and riblet walls are defined as
 \begin{equation} u_{\tau s} = \sqrt{\frac{\tau_{ws}}{\rho_s}} \quad u_{\tau r} = \sqrt{\frac{\tau_{wr}}{\rho_r}\frac{\delta_r^\prime}{\delta_r}}, \end{equation}
where (A5b) is consistent with Ibrahim et al. (Reference Ibrahim, Gómez-de-Segura, Chung and García-Mayoral2021). Now we normalise (A4) into viscous units
 \begin{equation} \frac{\mathrm d\left({\dfrac{U_S}{u_{\tau s}}}\right)}{\mathrm d\left({\dfrac{zu_{\tau s}}{\nu_s}}\right)} - \dfrac{\overline{u^\prime w^\prime}_S}{u_{\tau s}^2} = 1 - \dfrac{\dfrac{zu_{\tau s}}{\nu_s}}{\dfrac{\delta_s u_{\tau s}}{\nu_s}} \quad \frac{\mathrm d\left({\dfrac{U_R}{u_{\tau r}}}\right)}{\mathrm d\left({\dfrac{z_Tu_{\tau r}}{\nu_r}}\right)} - \dfrac{\overline{u^\prime w^\prime}_R}{u_{\tau r}^2} = 1 - \frac{\dfrac{z_Tu_{\tau r}}{\nu_r}}{\dfrac{\delta^\prime_r u_{\tau r}}{\nu_r}}, \end{equation}
where we observe the similarity in the total stress profiles when scaled with the appropriate friction velocity and kinematic viscosity. We integrate (A6) once more to obtain the velocity profiles. For a smooth wall, one may be inclined to integrate from the wall  $zu_{\tau s}/\nu _s=0$ to an arbitrary wall-normal location, $zu_{\tau s}/\nu _s$. However, the lower limit for the riblet wall, $zu_{\tau r}/\nu =\ell _Tu_{\tau r}/\nu$, is different, since the equation is only valid from the crest (refer to figure 19 to locate the crest relative to $z$). We integrate (A6) using similar limits of integration, to simplify cancellations when taking the difference between the profiles. We first integrate the smooth profile starting from an arbitrary position, $zu_{\tau s}/\nu _s=C$,
 \begin{align}
\left.\begin{array}{@{}rr@{}} \text{integrate both sides
of}\ (A6a) &
\text{integrate both sides of}\
(A6b)\\
\text{from}\ \dfrac{zu_{\tau s}}{\nu_s} = C\ {\rm to}\
\dfrac{zu_{\tau s}}{\nu_s}{:} & \text{from}\
\dfrac{z_Tu_{\tau r}}{\nu_r} = \dfrac{\ell_Tu_{\tau
r}}{\nu_r}\ {\rm to}\ \dfrac{z_Tu_{\tau
r}}{\nu_r}{:}\\
\text{B.C.:}~\left.\dfrac{U_S}{u_{\tau
s}}\right\vert_{{zu_{\tau
s}}/{\nu_s}=C}=\dfrac{U_{SC}}{u_{\tau s}} &
\text{B.C.:}~\left.\dfrac{U_R}{u_{\tau
r}}\right\vert_{{z_Tu_{\tau
r}}/{\nu_r}=\dfrac{\ell_Tu_{\tau r}}{\nu_r}}=
\dfrac{U_{R0}}{u_{\tau {r}}}{}\\
\Rightarrow \dfrac{U_S}{u_{\tau s}} = \dfrac{U_{SC}}{u_{\tau s}} -
\dfrac{1}{2} & \Rightarrow \dfrac{U_R}{u_{\tau r}} =
\dfrac{U_{R0}}{u_{\tau r}} -
\dfrac{1}{2}\\
\times \left[{\dfrac{\left({\dfrac{zu_{\tau
s}}{\nu_s}}\right)^2}{\dfrac{\delta_s u_{\tau s}}{\nu_s}}-
\dfrac{\left({C}\right)^2}{\dfrac{\delta_s u_{\tau
s}}{\nu_s}}}\right]&\times \left[{\dfrac{\left({\dfrac{z_Tu_{\tau
r}}{\nu_r}}\right)^2}{\dfrac{\delta_r^\prime u_{\tau
r}}{\nu_r}}- \dfrac{\left({\dfrac{\ell_Tu_{\tau
r}}{\nu_r}}\right)^2}{\dfrac{\delta_r^\prime u_{\tau
r}}{\nu_r}}}\right]\\
+\dfrac{zu_{\tau s}}{\nu_s} - C
& + \left({\dfrac{z_Tu_{\tau r}}{\nu_r} -
\dfrac{\ell_Tu_{\tau r}}{\nu_r}}\right)\\
+ \displaystyle\int_C^{{zu_{\tau s}}/{\nu_s}}
\dfrac{\overline{u^\prime w^\prime}_S}{u_{\tau
s}^2}\,\text{d} \left({\dfrac{zu_{\tau s}}{\nu_s}}\right) &
+ \displaystyle\int_{{\ell_Tu_{\tau
r}}/{\nu_r}}^{{z_Tu_{\tau r}}/{\nu_r}}
\dfrac{\overline{u^\prime w^\prime}_R}{u_{\tau
r}^2}\,\text{d}\left({\dfrac{z_Tu_{\tau r}}{\nu_r}}\right).
\end{array}\right\}
\end{align}
\begin{align}
\left.\begin{array}{@{}rr@{}} \text{integrate both sides
of}\ (A6a) &
\text{integrate both sides of}\
(A6b)\\
\text{from}\ \dfrac{zu_{\tau s}}{\nu_s} = C\ {\rm to}\
\dfrac{zu_{\tau s}}{\nu_s}{:} & \text{from}\
\dfrac{z_Tu_{\tau r}}{\nu_r} = \dfrac{\ell_Tu_{\tau
r}}{\nu_r}\ {\rm to}\ \dfrac{z_Tu_{\tau
r}}{\nu_r}{:}\\
\text{B.C.:}~\left.\dfrac{U_S}{u_{\tau
s}}\right\vert_{{zu_{\tau
s}}/{\nu_s}=C}=\dfrac{U_{SC}}{u_{\tau s}} &
\text{B.C.:}~\left.\dfrac{U_R}{u_{\tau
r}}\right\vert_{{z_Tu_{\tau
r}}/{\nu_r}=\dfrac{\ell_Tu_{\tau r}}{\nu_r}}=
\dfrac{U_{R0}}{u_{\tau {r}}}{}\\
\Rightarrow \dfrac{U_S}{u_{\tau s}} = \dfrac{U_{SC}}{u_{\tau s}} -
\dfrac{1}{2} & \Rightarrow \dfrac{U_R}{u_{\tau r}} =
\dfrac{U_{R0}}{u_{\tau r}} -
\dfrac{1}{2}\\
\times \left[{\dfrac{\left({\dfrac{zu_{\tau
s}}{\nu_s}}\right)^2}{\dfrac{\delta_s u_{\tau s}}{\nu_s}}-
\dfrac{\left({C}\right)^2}{\dfrac{\delta_s u_{\tau
s}}{\nu_s}}}\right]&\times \left[{\dfrac{\left({\dfrac{z_Tu_{\tau
r}}{\nu_r}}\right)^2}{\dfrac{\delta_r^\prime u_{\tau
r}}{\nu_r}}- \dfrac{\left({\dfrac{\ell_Tu_{\tau
r}}{\nu_r}}\right)^2}{\dfrac{\delta_r^\prime u_{\tau
r}}{\nu_r}}}\right]\\
+\dfrac{zu_{\tau s}}{\nu_s} - C
& + \left({\dfrac{z_Tu_{\tau r}}{\nu_r} -
\dfrac{\ell_Tu_{\tau r}}{\nu_r}}\right)\\
+ \displaystyle\int_C^{{zu_{\tau s}}/{\nu_s}}
\dfrac{\overline{u^\prime w^\prime}_S}{u_{\tau
s}^2}\,\text{d} \left({\dfrac{zu_{\tau s}}{\nu_s}}\right) &
+ \displaystyle\int_{{\ell_Tu_{\tau
r}}/{\nu_r}}^{{z_Tu_{\tau r}}/{\nu_r}}
\dfrac{\overline{u^\prime w^\prime}_R}{u_{\tau
r}^2}\,\text{d}\left({\dfrac{z_Tu_{\tau r}}{\nu_r}}\right).
\end{array}\right\}
\end{align}
Equation (A7) is the analytical velocity profile given the boundary conditions of the top domain in figure 19 and the boundary condition at the lower limit, i.e. at  $zu_{\tau s}/\nu _s=C$ for smooth wall or $z_Tu_{\tau r}/\nu _r=\ell _Tu_{\tau r}/\nu _r$ for riblet wall.
The streamwise uniform cross-plane for (a) riblets and (b) smooth wall with their boundary conditions and half-channel height measured from turbulence origin,  $\delta _r^\prime$ (known after simulation) or mean height, $\delta _r$ (prior-simulation input) and from smooth wall $\delta _s$ (also set prior to simulation). The effective friction velocity, $u_{\tau r}$, measured from the origin of turbulence, $z_T=0$, where $\delta _r^\prime$ is unknown prior to the simulation, causes a slight difference in the effective ${Re}_\tau$ between riblet and smooth walls (i.e. $\delta _r^\prime u_{\tau r}/\nu _r\ne \delta _s u_{\tau s}/\nu _s$).

Now, we let  $C=\ell _Tu_{\tau r}/\nu _r$ so that $U_{SC}/{u_{\tau s}}$ can be found by evaluating (A7a) at $zu_{\tau s}/\nu _s=0$, i.e. at the wall where $U_S/u_{\tau s}=0$
 \begin{equation} \frac{U_{SC}}{u_{\tau s}} = \frac{\ell_Tu_{\tau r}}{\nu_r} {-\dfrac{1}{2}\frac{\left({\dfrac{\ell_Tu_{\tau r}}{\nu_r}}\right)^2}{\dfrac{\delta_s u_{\tau s}}{\nu_s}}} + {\int_0^{{\ell_Tu_{\tau r}}/{\nu_r}}\frac{\overline{u^\prime w^\prime}_S}{u_{\tau s}^2}\,\text{d}\left({\dfrac{zu_{\tau s}}{\nu_s}}\right)} .\end{equation}
Therefore, the difference between smooth and riblet profiles at matched wall-normal height,  $z_\varDelta ^+={zu_{\tau s}}/{\nu _s}={z_Tu_{\tau r}}/{\nu _r}$, is
 \begin{align} \frac{U_S}{u_{\tau s}}-\frac{U_R}{u_{\tau r}} &= \overbrace{-\left({\frac{U_{R0}}{u_{\tau r}}-\frac{U_{SC}}{u_{\tau s}}}\right)}^{\Delta U^+} - \overbrace{ {\frac{1}{2}\left[{z_\varDelta^{+2}-{\left({\frac{\ell_Tu_{\tau r}}{\nu_r}}\right)^2}}\right] \left({\frac{1}{\dfrac{\delta_s u_{\tau s}}{\nu_s}}-\frac{1}{\dfrac{\delta_r^\prime u_{\tau r}}{\nu_r}}}\right)}}^{\epsilon_\varDelta^+} \nonumber\\ &\quad \underbrace{+ \int_{{\ell_Tu_{\tau r}}/{\nu_r}}^{z_\varDelta^+} \frac{\overline{u^\prime w^\prime}_S}{u_{\tau s}^2}\,\text{d}\left({\frac{zu_{\tau s}}{\nu}}\right)-\int_{{\ell_Tu_{\tau r}}/{\nu_r}}^{z_\varDelta^+} \frac{\overline{u^\prime w^\prime}_R}{u_{\tau r}^2}\,\text{d}\left({\frac{z_Tu_{\tau r}}{\nu_r}}\right) }_{\approx\,0\text{ for {smooth-wall-like riblets}}}. \end{align}
If we assume that the Reynolds stress profiles collapse when scaled to viscous units, i.e.  $\overline {u^\prime w^\prime }_S/u_{\tau s}^2=\overline {u^\prime w^\prime }_R/u_{\tau r}^2$ for $z_\varDelta ^+$ between $\ell _Tu_{\tau r}/\nu _r$ and $\delta ^\prime u_{\tau r}/\nu _r$, then the last term in (A9) vanishes. This only happens at matched ${Re}_\tau$ as well. So the sources of error are from the normalised $-\textrm {d}P/\textrm {d}\kern0.06em x$ and from the $-\overline {u^\prime w^\prime }$ term. And if we assume that the friction Reynolds numbers are matched between the riblet and smooth wall, such that ${\delta ^\prime _r u_{\tau r}}/{\nu _r}={\delta _su_{\tau s}}/{\nu _s}$, then $\epsilon _\varDelta ^+=0$. Therefore, from (A9), we have $\Delta U^+=-\left ({{U_{R0}}/{u_{\tau r}}-{U_{SC}}/{u_{\tau {s}}}}\right )$, where the roughness function is irrespective of $z_\varDelta ^+$. For ${U_{R0}}/{u_{\tau r}}$, evaluating the mean velocity at the crest may not be accurate because the effect due to the texture (inhomogeneity) is still present at the crest. Figure 20 illustrates the method used to determine ${U_{R0}}/{u_{\tau r}}$. Here, the homogenised mean flow perceives a virtual origin at $\ell _Uu_{\tau r}/\nu _r$ below the crest when linearly extrapolated to $U_R=0$ with a gradient measured locally at $zu_{\tau r}/\nu _r\approx 1$. For small, smooth-wall-like riblets, the viscous-scaled gradient is close to 1, and thereby, ${U_{R0}}/{u_{\tau r}}\approx \ell _Uu_{\tau r}/\nu _r$. For $U_{SC}/u_{\tau r}$, we assume from (A8) that $\ell _Tu_{\tau r}/\nu _r$ is small such that the second and third term can be neglected (i.e. unity gradient), such that $U_{SC}/u_{\tau s}=\ell _Tu_{\tau r}/\nu _r$. Hence, we have
 \begin{equation} \Delta U^+= -\left({\frac{\ell_Uu_{\tau r}}{\nu_r}-\frac{\ell_Tu_{\tau r}}{\nu_r}}\right). \end{equation}
Equation (A10) is an idealistic equation assuming collapsed Reynolds stress and friction Reynolds number. However, this condition is not true from the DNS because the channel height is measured from the riblet mean height, and not the turbulence origin. Based on the simulations performed as per figure 19, the friction Reynolds number is not matched,  ${\delta _s u_{\tau s}}/{\nu _s}\ne {\delta _r^\prime u_{\tau r}}/{\nu _r}$ so the error $\epsilon _\varDelta ^+$ in (A9) remains. Another error arises from the inequality of Reynolds stresses $-\overline {u^\prime w^\prime }_S/u_{\tau s}^2\ne -\overline {u^\prime w^\prime }_R/u_{\tau r}^2$, typically for larger $\ell _gu_{\tau r}/\nu _r$ riblets. And finally, a statistical error, $\pm \zeta$ (2.2) due to the minimal channel exist in (A7a,b), prior to the subtraction in (A9). The error, $\pm \zeta$ can be minimised by increasing the sampling time. By removing the error due to unmatched ${Re}_\tau$, we can recover the actual $\Delta U^+$, plus minor errors due to the aforementioned sources.
The mean velocity profiles above the riblet crest and the valley are homogenised (collapse) above the riblet crest. We measure  $\ell _U$ as the distance relative to the crest of the origin of the linearly extrapolated homogenised mean velocity (depicted as the dashed line) with a gradient measured locally at $zu_{\tau r}/\nu _r\approx 1$.

Appendix B. Calibration of model parameters
B.1. Domain height
We demonstrate that the predictions of the viscous vortex model ( $\ell _{T,{VV}}^+$) remain nearly constant when a domain height in the range of $10\leqslant H^+ \leqslant 15$ is selected. Table 3 summarises the corresponding $\ell _{T,{VV}}^+$ values based on prescribed parameters ( $B/A$ and $\varPhi$) extracted from the DNSs of smooth walls at various heights ranging from $10\leqslant z^+\leqslant 15$. Here, we observe that $\ell _{T,{VV}}^+$ varies by approximately 3 % among the prescribed domain heights, indicating that any of these parameters would be suitable. For our analysis, we select the parameters corresponding to $z^+=12$, with the respective $\ell _{T,{VV}}^+$ (and $\Delta U^+_{{VV}}$) reported in figures 16–18. Furthermore, the modelled $\ell _{T,{VV}}^+$ values closely align with $\ell _T^+$ values from DNSs. The riblets listed in table 3 are matched with the optimal riblet cases at $\ell _g^+\approx 10$, where the DNS results for blade riblets (
![]() ) yield
) yield  $\ell _T^+\approx 0.95$ and the trapezoidal riblets (
![]() ) yield
) yield  $\ell _T^+\approx 1.49$, resulting in a difference of 1 %–8 %.
Summary of the viscous vortex model turbulence origin predictions  $\ell _{T,{VV}}$, calculated using various domain heights $z^+$, alongside the corresponding prescribed parameters $B/A$ and $\varPhi$ extracted from DNS. Riblet size is $\ell _g^+\approx 10$: $s^+=15.6$ for blade riblets (
![]() ) and
) and  $s^+=14.7$ for trapezoidal riblets (
![]() ). The calculated
). The calculated  $\ell _{T,{VV}}^+$ are virtually insensitive to the domain height (varying by less than 3 % for $10\leq z^+\leq 15$), and are close to that from the DNS: $\ell _T^+\approx 0.95$ for the blade riblet (
![]() ) and
) and  $\ell _T^+\approx 1.49$ for the trapezoidal riblet (
![]() ).
).

B.2. Wavelength and amplitude
We also demonstrate that, by setting  $\lambda _y^+=50$ (along with the corresponding $A$,
$A$,  $B$ and $\varPhi$ at ${z^+=12}$), the viscous vortex model provides the most accurate prediction of $\ell _T^+$, compared with the (sub)harmonics, $\lambda _y^+=25$ and 100. Comparisons with the measured virtual origins from DNSs of both trapezoidal riblets and slip/transpiration surfaces (Ibrahim et al. Reference Ibrahim, Gómez-de-Segura, Chung and García-Mayoral2021; Habibi Khorasani et al. Reference Habibi Khorasani, Lācis, Pasche, Rosti and Bagheri2022) allow us to calibrate the model with diverse wall conditions and with a larger $\ell _T^+$ range of $0.5\lesssim \ell _T^+\lesssim 5$. The spanwise slip and transpiration lengths ( ${\ell _y^+, \ell _z^+}$) are applied through the same Robin boundary condition as the DNSs of Ibrahim et al. (Reference Ibrahim, Gómez-de-Segura, Chung and García-Mayoral2021), ${v|_{z=0}=\ell _y\partial v/\partial z|_{z=0}}$ and ${w|_{z=0}=\ell _z\partial w/\partial z|_{z=0}}$. From the DNSs conducted by Habibi Khorasani et al. (Reference Habibi Khorasani, Lācis, Pasche, Rosti and Bagheri2022), the wall-normal velocity at $z=0$ is ${w\rvert _{z=0}=-m_x\partial {u}/\partial {x}\rvert _{z=0} - m_y\partial {v}/\partial {y}\rvert _{z=0}}$, where $m_x$ and $m_y$ are the prescribed constants. When $m_x=m_y$, this condition is equivalent to Ibrahim et al. (Reference Ibrahim, Gómez-de-Segura, Chung and García-Mayoral2021), leading to $\ell _z=m_x=m_y$ by continuity. Figure 21 compares the values of $\ell _{T,{VV}}^+$ obtained from the viscous vortex model (using the parameters corresponding to the respective $\lambda _y^+$) with the turbulence virtual origins $\ell _T^+$ measured from the DNSs. The slip/transpiration DNS cases correspond to the regime where $\ell _v^+\approx \ell _w^+$, ensuring that the DNS $\omega _x^{\prime +}$ matches well with the smooth-wall data from at least the local minimum (i.e. at $z^+\approx 5$) and above, as observed by Gómez-de-Segura & García-Mayoral (Reference Gómez-de-Segura and García-Mayoral2020). This allows for direct comparison with viscous vortex predictions. The results for ${\lambda _y^+=50}$, as shown in figure 21(b), demonstrate that the viscous vortex model provides a more accurate prediction of $\ell _T^+$ compared with $\lambda _y^+=25$ or 100.
Comparison of the DNS turbulence virtual origins  $\ell _T^+$ of trapezoidal riblets (
![]() ) and slip surfaces of Ibrahim et al. (Reference Ibrahim, Gómez-de-Segura, Chung and García-Mayoral2021) and Habibi Khorasani et al. (Reference Habibi Khorasani, Lācis, Pasche, Rosti and Bagheri2022) with the results obtained from the viscous vortex model, denoted as
) and slip surfaces of Ibrahim et al. (Reference Ibrahim, Gómez-de-Segura, Chung and García-Mayoral2021) and Habibi Khorasani et al. (Reference Habibi Khorasani, Lācis, Pasche, Rosti and Bagheri2022) with the results obtained from the viscous vortex model, denoted as  $\ell _{T,{VV}}^+$. The parameters used in the model are extracted from the smooth-wall DNSs at a height of $z^+\approx 12$ and wavelengths of (a) $\lambda _y^+=25$ using $B/A=0.86$ and $\varPhi =0.24{\rm \pi}$, (b) $\lambda _y^+=50$ using $B/A=1.4$ and $\varPhi =0.31{\rm \pi}$ and (c) $\lambda _y^+=100$ using $B/A=2.5$ and $\varPhi =0.34{\rm \pi}$. Black markers ( ${\bullet }$) in (b) show model prediction using $B/A=1.1$.

The amplitude ratio of the boundary condition  $B/A=1.4$ is obtained by averaging the segmented Fourier signals (see § 4.2). Note that the model turbulence offset $\ell _{T,VV}^+$ is invariant of the magnitudes of $A$ and $B$, as long as their ratio $B/A$ remains the same, due to the linearity of the Stokes equations. When we compute $A$ and $B$ by averaging the wider, non-segmented Fourier signals instead, we obtain a slightly smaller $B/A\approx 1.1$ but the same $\varPhi \approx 0.31{\rm \pi}$.
We can use the viscous vortex model to check the consistency between these two DNS-obtained  $B/A$. In terms of the prediction of $\ell _T^+$, the ratio $B/A=1.1$ (with the same $\lambda _y^+=50$, $z^+=12$ and $\varPhi =0.31{\rm \pi}$) results in insignificant changes to $\ell _{T,VV}^+$ ( ${\bullet }$, figure 21). However, in terms of the model r.m.s. vorticity profile, we observe a local minimum at $z^+_{\omega _x,{min}}\approx 4.9$ when $B/A=1.4$ and $z^+_{\omega _x,{min}}\approx 5.5$ when $B/A=1.1$. The local minimum of the DNS r.m.s. vorticity profile is at $z^+_{\omega _x,{min}}\approx 5$ (e.g. Kim et al. Reference Kim, Moin and Moser1987), highlighting the advantage of segmenting the signals when obtaining $B/A$.
Appendix C. Analytical viscous vortex solutions at various spanwise shifts of the wall using Floquet–Bloch decomposition
In the viscous vortex model, we account for the spanwise shifts ( $\varDelta$) of the vortex above riblet walls based on the unpinned character of quasi-streamwise vortices (see figure 11). This step requires multiple solutions between $0\leqslant \varDelta < s$, which may be time consuming depending on the interval sizes of $\varDelta$. Following from the Floquet–Bloch decomposition, we can instead analytically find the solution field for any $\varDelta$ from two linearly independent solutions
 \begin{align} \left\{{v_\theta,w_\theta,\omega_{x,\theta}}\right\}(\theta,\eta,z) &= C(\theta)\left\{{v_{\tilde\theta},w_{\tilde\theta},\omega_{x,{\tilde\theta}}}\right\}(\tilde\theta=0,\eta,z) \nonumber\\ &\quad + D(\theta)\left\{{v_{\tilde{\theta}},w_{\tilde{\theta}},\omega_{x,{\tilde{\theta}}}}\right\}(\tilde{\theta}=\theta_0,\eta,z), \end{align}
where  $\theta =2{\rm \pi} \varDelta /\lambda _y$ is a variable associated with the desired solution and $\tilde {\theta }$ is a chosen constant associated with the independent solutions. For the first independent solution, we choose $\tilde {\theta }=0$, whilst for the second independent solution, we choose ${\tilde {\theta }=\theta _0=(2{\rm \pi} /\lambda _y)(s/2)}$ (half-riblet spacing). We find $C$ and $D$ by substituting the left-hand side of (C1) with the boundary velocity at the top (see figure 11) to find
 \begin{equation} C=\cos\theta-\frac{\sin\theta}{\tan\theta_0} \quad D=\frac{\sin\theta}{\sin\theta_0}, \end{equation}
where  $\theta _0\ne n{\rm \pi}$ for any integer $n$ to avoid a zero division. To ensure that the second solution is independent, we choose the aforementioned ${\theta _0=(2{\rm \pi} /\lambda _y)(s/2)}$, i.e. shift of half a riblet period. Because $\theta _0\ne n{\rm \pi}$, our choice of ${\theta _0=(2{\rm \pi} /\lambda _y)(s/2)}$ gives $\lambda _y\ne s/n$, which means $\lambda _y > s$. Since we use $\lambda _y^+=50$ for the viscous vortex model, the spacings for small riblets ( ${\ell _g^+\lesssim 10.7}$) are all smaller than $\lambda _y^+$ ( $s^+<20$, see table 2) and hence, our choice of ${\theta _0=(2{\rm \pi} /\lambda _y)(s/2)}$ will work for all small riblets. Using (C1) and (C2a,b), we can analytically compute the solution for any $\varDelta$. The uniform average can then be computed using (4.8) by substituting $\eta$ with $y$, i.e. changing the reference frame from the riblets ( $\eta$) to the top velocity boundary condition ( $y$).
$y$).


 Open access