


A vast literature has been dedicated to understanding the drivers of Black economic progress over the twentieth century. A central question has been the relative importance of improvements in Black educational attainment, both in terms of quantity and quality, as opposed to reductions in institutional barriers favoring white workers over Black workers. While both factors likely contributed to narrowing racial gaps in the labor market over the twentieth century, some studies have emphasized the role of human capital (Smith and Welch Reference Smith and Welch1989), while other studies have emphasized the role of anti-discrimination policies (Donohue and Heckman 1991). Beyond its historical significance, the answer to this question is relevant for present-day policies seeking to eliminate remaining racial gaps.
One important setting in which this debate has played out is the early twentieth-century South, where the majority of Blacks lived at the time. During this era, schools in the South were racially segregated under the “separate-but-equal” doctrine, and Black schools were severely underfunded due to public sector discrimination. Given these large disparities, some have argued that truly equal schools would have substantially reduced the Black-white wage gap (Carruthers and Wanamaker 2017). Others have argued that while better schooling opportunities would have helped to a certain degree, racial discrimination placed an upper limit on Blacks’ ability to progress in the labor market (Wright Reference Wright1986, 2013; Margo Reference Margo1990). The lack of consensus in the literature stems from the fact that disentangling the role of human capital and labor market barriers is challenging empirically.
This paper brings new evidence to this debate by exploiting an intervention that differentially improved access to high-quality education for Black children in the South: the Rosenwald Schools Initiative. The Rosenwald Schools Initiative was a school construction program supported by the Rosenwald Fund, one of several private philanthropies advancing Black education in the South. Between 1913 and 1932, it helped fund the construction of nearly 5,000 schools in predominantly rural areas across 15 Southern states. By the end of the program in 1932, the capacity of Rosenwald schools was around a third of the Black school-age population in the rural South, making it the largest educational intervention of its kind at the time. Building on prior work showing that Rosenwald schools had a positive impact on Black educational outcomes (Aaronson and Mazumder Reference Aaronson and Mazumder2011), we explore the impact of Rosenwald schools on labor market outcomes. Given that education was likely a key channel through which exposure to Rosenwald schools may have resulted in labor market gains, we argue that the size and nature of those gains—particularly the nature of occupational gains—are informative about the relative importance of human capital and labor market barriers.
Key to answering this question is the ability to observe individuals in childhood to determine their likely exposure to Rosenwald schools and, again in adulthood, to observe their labor market outcomes. To this end, we build a new linked dataset that exploits Social Security application records as an intermediate link between the 1920 and 1940 Censuses. The main advantage of exploiting these records is that they allow us to link women across censuses thanks to the availability of both married and birth names. We link records using a supervised machine learning approach that enables us to simultaneously achieve high match rates and low false match rates. Our linked sample contains around 30 thousand Black men and 30 thousand Black women born in the South between 1910 and 1919.
To estimate the causal effect of Rosenwald schools on individual outcomes, we leverage cross-county and time variation in the spread of Rosenwald schools across the South, as well as variation in the size of these schools. Black children were differentially exposed to Rosenwald schools depending on the capacity of Rosenwald schools in the county they grew up in during their school-age years. In practice, we compare the outcomes of Black men and women aged 20–29 in 1940 who were differentially exposed to Rosenwald schools based on their year of birth and county of residence in 1920, focusing on the subset of Blacks living in rural areas in 1920, given that the majority of schools were built in those areas.
We first confirm that exposure to Rosenwald schools had a significant positive impact on the educational attainment of Black men and women in 1940, consistent with previous findings in the literature (Aaronson and Mazumder Reference Aaronson and Mazumder2011). We then examine whether exposure to Rosenwald schools led to better labor market outcomes in 1940. We find that exposure to Rosenwald schools had a positive effect on the labor force participation and occupational standing of Black women aged 25–29 in 1940. Going from no exposure to an average exposure level increases labor force participation by 2 percentage points and occupational income scores by 3 percent. In line with delayed or reduced fertility in response to greater labor force attachment, we also find that exposure to Rosenwald schools had a negative effect on Black women’s probability of having children in 1940, consistent with the findings in Aaronson, Lange, and Mazumder (Reference Aaronson, Lange and Mazumder2014).
In contrast, we find little evidence that exposure to Rosenwald schools significantly improved the occupational standing of Black men. However, we do find some gains in blue-collar and white-collar employment among Black men who moved to urban areas by 1940. We also find that the increases in female labor force participation are concentrated among Black women who moved to urban areas, suggesting that cities provided better labor market opportunities than rural areas for individuals exposed to Rosenwald schools.
Examining the nature of occupational gains more closely, we find that the gains that Black men and women were able to achieve are concentrated in jobs where they were commonly found, such as storekeepers and school teachers. Tellingly, despite significant gains in high school attainment, we find no evidence that Blacks exposed to Rosenwald schools—including those who moved to urban areas—broke into jobs where they were heavily underrepresented, such as craftsman, sales, and clerical positions. The absence of gains in these types of jobs is consistent with contemporary accounts that Blacks were seldom considered for such positions, regardless of their qualifications (Myrdal Reference Myrdal1944). Overall, our findings suggest that while truly equal schools would have helped, deep-rooted institutional barriers fundamentally limited the scope for Black occupational advancement around 1940, echoing what others have previously concluded (Margo Reference Margo1990; Sundstrom 2012; Wright 2013).
Our paper makes several contributions. First, we shed new light on the relative importance of barriers to human capital accumulation vs. barriers in the labor market in explaining the Black-white occupational standing gap around mid-twentieth century (Myrdal Reference Myrdal1944; Wright Reference Wright1986; Margo Reference Margo1990; Sundstrom Reference Sundstrom1994; Collins Reference Collins2001, 2003; Wright 2013; Carruthers and Wanamaker 2017). While the importance of labor market barriers has previously been emphasized, we view our findings as providing new quasi-experimental evidence that even Black children who received a meaningful boost to their education made no headway in occupations from which Blacks tended to be excluded.
Second, we contribute to the literature on Black women’s experience in the labor market from a historical perspective (Jones Reference Jones1985; Goldin 1990; Cunningham and Zalokar Reference Cunningham and Zalokar1992; King Reference King1993, 1995; Sundstrom 2000; Bailey and Collins Reference Bailey and Collins2006; Boustan and Collins Reference Boustan and Collins2014; Collins and Moody Reference Collins, Moody, Susan, Laura and Saul2017). Thanks to our novel linking strategy, our paper is one of the first to link women across historical censuses, which has been a major stumbling block in the literature. This allows us to study the role of early childhood access to schooling opportunities on women’s labor market outcomes in adulthood. Our findings suggest that access to education was an important determinant of Black women’s labor force participation and occupational standing around mid-twentieth century. However, while high school attainment opened the gates to clerical jobs for white women (Goldin 1990), these positions appear to have been largely out of reach for Black women in 1940. This is consistent with prior work showing that Black women’s breakthrough in clerical jobs occurred after 1940 (Cunningham and Zalokar Reference Cunningham and Zalokar1992; King 1995; Bailey and Collins Reference Bailey and Collins2006).
Lastly, we contribute to the literature on Rosenwald schools. Numerous studies have explored the legacy of Rosenwald schools, including their impact on educational outcomes (Aaronson and Mazumder Reference Aaronson and Mazumder2011), fertility (Aaronson, Lange, and Mazumder Reference Aaronson, Lange and Mazumder2014), incarceration (Eriksson Reference Eriksson2020), and mortality (Aaronson et al. 2021). We build on these studies and provide new insights on the impact of Rosenwald schools on labor market outcomes of Black men and women, a key dimension of their economic standing. Related to our study, Aaronson, Lange, and Mazumder (Reference Aaronson, Lange and Mazumder2014) examine the impact of Rosenwald schools on Black women’s occupational income scores. We build on their analysis by studying the impact of Rosenwald schools on Black women’s labor force participation and propensity to hold various occupations. In particular, our analysis reveals that while Black women’s occupational standing improved on average, they failed to break into clerical positions, which suggests that they faced significant obstacles in obtaining those positions.Footnote 1 All in all, our findings contribute to our understanding of the effects of this important educational intervention.
THE ROSENWALD RURAL SCHOOLS INITIATIVE
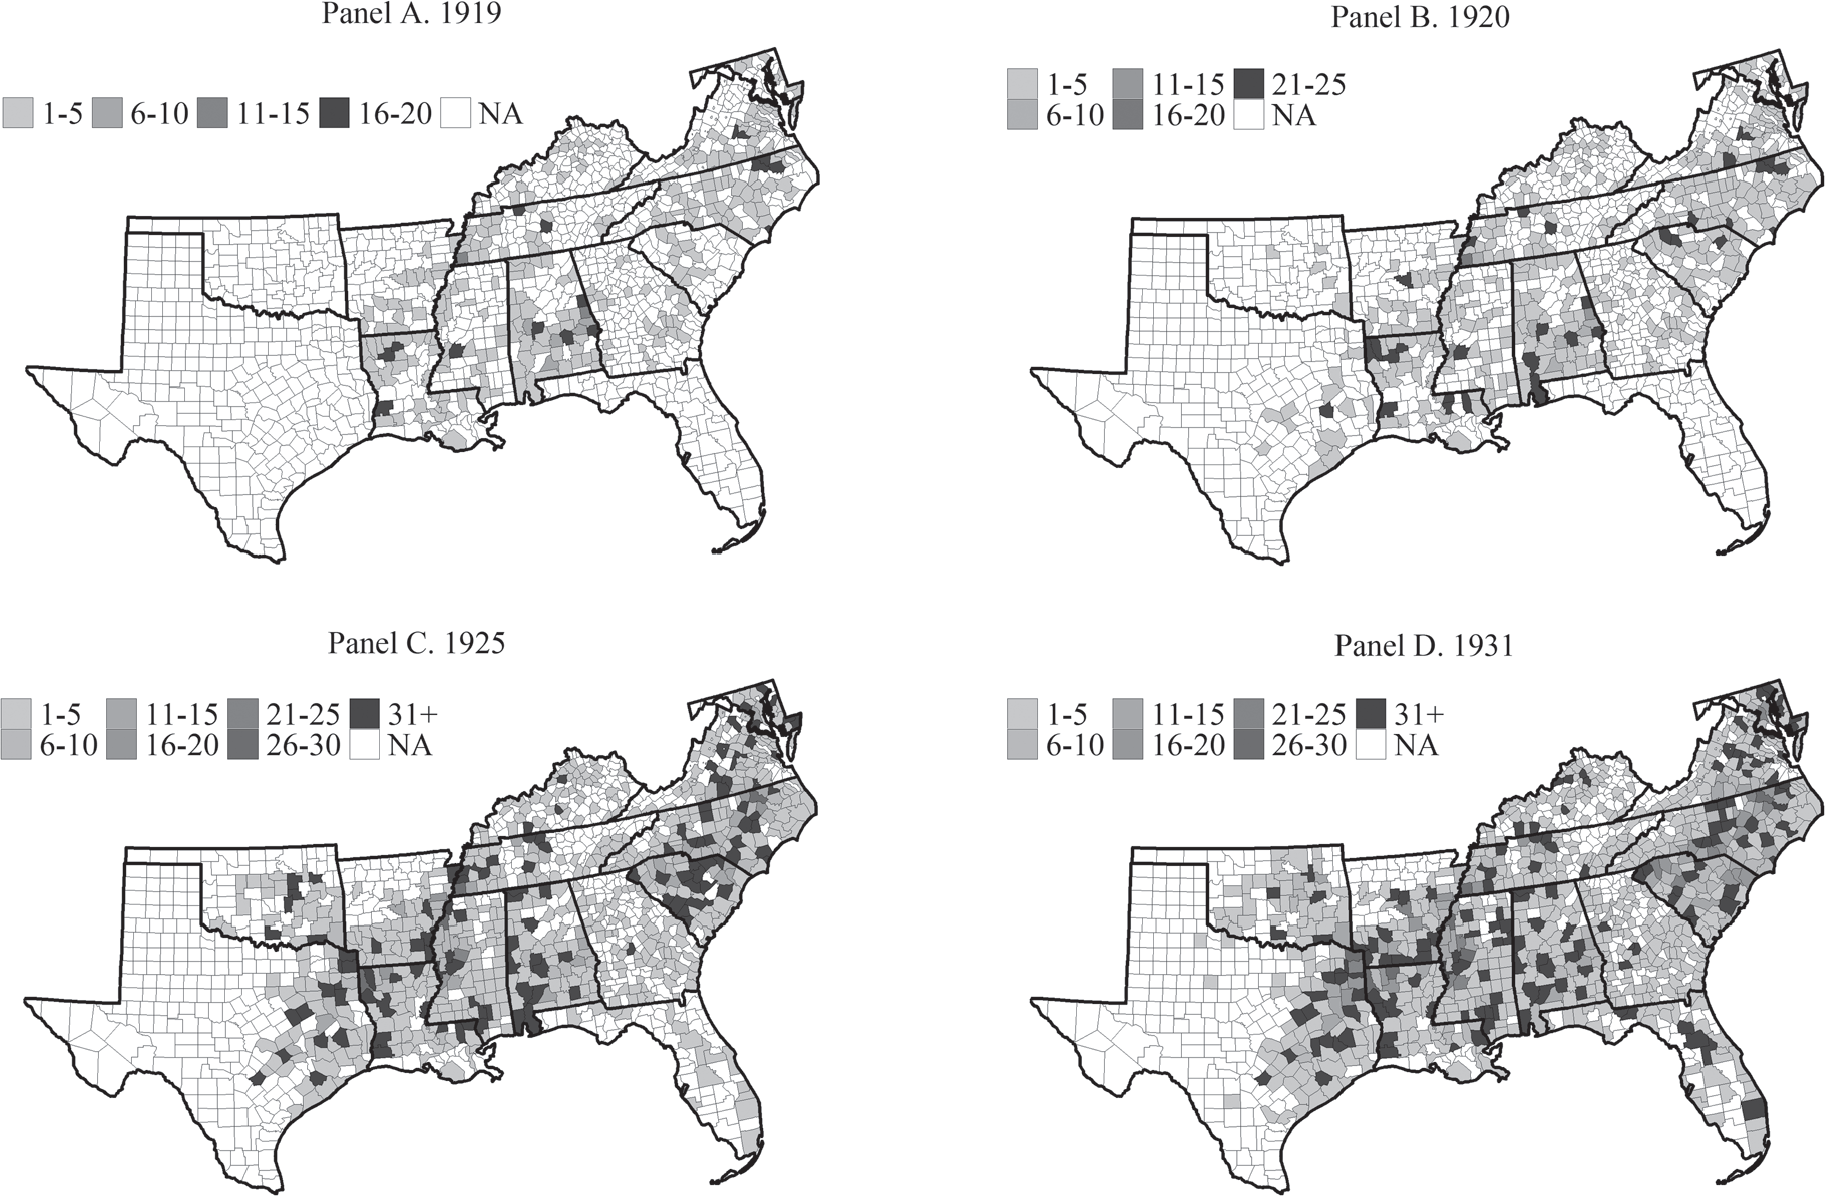
In 1917, Chicago industrialist and philanthropist Julius Rosenwald established the Rosenwald Fund. The largest project supported by the Fund was a school construction program called the Rosenwald Rural Schools Initiative. Its goal was to improve educational opportunities for Black children in the rural South, which were severely lacking at the time (Margo Reference Margo1990). The initiative originated from a partnership between Julius Rosenwald and Booker T. Washington, the principal of Tuskegee Institute in Alabama. Washington, who viewed the advancement of Black education as the best path toward achieving Black economic progress in the South, convinced Rosenwald to build six pilot schools in Alabama in 1913. Impressed by the success of these early schools, Rosenwald helped fund the construction of another 700 schools across the South between 1914 and 1919, primarily in Alabama, Louisiana, Tennessee, Kentucky, North Carolina, and Virginia. The program then quickly expanded during the 1920s, culminating in the construction of nearly 5,000 schools across 15 states by the program’s end in 1932. The spread of Rosenwald schools over time is shown in Figure 1. The schools were erected at a total cost of $28.4 million (nominal terms), $4.7 million of which was contributed by the Rosenwald Fund (Embree and Waxman Reference Embree and Waxman1949).
NUMBER OF ROSENWALD SCHOOLS BY COUNTY
Notes: This figure shows the cumulative number of Rosenwald schools by county, separately by year.
Sources: Aaronson and Mazumder (Reference Aaronson and Mazumder2011).
The Rosenwald Rural Schools Initiative had several key features. First, Rosenwald schools mainly provided primary education, as average educational attainment among rural Blacks was very low at the time. Second, the program was deliberately designed to provide physical resources, such as buildings, that could not easily be expropriated by predominantly white local educational authorities. Third, in addition to expanding access to education, the Rosenwald Fund placed a strong emphasis on providing high-quality education. Rosenwald schools were modernly designed and had all the necessary amenities (e.g., natural lighting, ventilation, sanitation) and supplies (e.g., books, blackboards, desks) conducive to a good learning environment. Although schools varied in size, ranging from single-classroom schoolhouses to large buildings containing multiple classrooms, the Rosenwald Fund insisted that schools be built according to pre-specified blueprints (the typical school only had one or two classrooms). It also invested in complementary measures such as teacher salaries, the construction of teacher homes, and supported efforts to increase the length of school terms. Another measure aimed at improving the quality of instruction was the partnership with the Jeanes Fund, under which “Jeanes supervisors” would travel from school to school to train teachers (Donohue, Heckman, and Todd 2002; Kreisman Reference Kreisman2017).
A unique feature of the Rosenwald Initiative was its matching grant funding scheme under which local communities were required to bear the majority of the cost of building a new school. On average, the Rosenwald Fund only covered around 20 percent of the total cost, with local Blacks contributing 24 percent, local whites 5 percent, and local public authorities the remaining 51 percent.Footnote 2 The purpose of this scheme was to stimulate public interest in the provision of Black education, foster cooperation between different parties within the local community, and only build schools in communities that had demonstrated a strong interest in the school’s long-term success. Another key requirement was that the school become part of the public school system. While the Rosenwald Fund facilitated the initial construction of the school, the state was to be responsible for its continued operation by covering teacher salaries and other expenses.
DATA
SS-5 Records
Our analysis is based on a new dataset we have assembled linking individuals across the 1920 and 1940 full count Censuses (Ruggles et al. 2021) via Social Security application records. Specifically, we exploit the public version of the Social Security Numerical Identification (Numident) File released by the National Archives and Records Administration. It includes over 72 million entries of Form SS-5 information (Application for a Social Security Card), corresponding to around 40 million unique individuals who died prior to 2007 and whose deaths were not state-reported. Each SS-5 record lists the number holder’s full name, date of birth, sex, race, place of birth, and—crucially—his or her parents’ full names.
The main advantage of using SS-5 records as an intermediate link between censuses is that it allows us to link women. Women have largely been excluded from census-to-census linked datasets because they typically adopt their husband’s last name when they get married, making it impossible to link women who appear under their birth name as children and under their married name as adults. In contrast, SS-5 records for married women list both their married name and birth name (via their own last name and their father’s last name), which allows us to find them in any census regardless of their marital status at the time.
There are two drawbacks to our approach. First, it requires two links instead of one, which naturally reduces the size of our linked sample. Second, SS-5 records do not have universal coverage. By definition, individuals who never applied for a Social Security Number (SSN) are absent from the SS-5 data.Footnote 3 In addition, individuals who were still alive in 2007 or whose deaths were reported to the Social Security Administration by the states are excluded from the Numident. In practice, the public Numident has near-universal coverage of deaths that occurred between 1988 and 2007 and low coverage prior to 1988 (Goldstein and Breen Reference Goldstein and Breen2022). Online Appendix Figure A1 plots the cohort-specific coverage rate of SS-5 records for Blacks born in the South, as implied by 1940 Census population counts by age. In the analysis, our population of interest will be Black men and women who were born between 1910 and 1919 in one of the 14 Southern states where Rosenwald schools were built.Footnote 4 We chose these cohorts as they were of school age during the Rosenwald era and were old enough in 1940 to measure their labor market outcomes.Footnote 5
Linking SS-5 Records to Census Records Using Supervised Machine Learning
Our dataset consists of a series of linkages between SS-5 records and census records. Each of these involves linking records mainly based on names, which is challenging due to common names and name misspellings.
In this paper, we adopt the supervised machine learning (ML) linking approach from the Longitudinal, Intergenerational Family Electronic Micro-Database Project (Bailey et al. Reference Bailey, Lin, Mohammed, Mohnen, Murray, Zhang and Prettyman2022, 2023). This approach involves making manual linking decisions for a random sample of records, which is then used to train an algorithm to make similar linking decisions for the entire set of records. This approach is particularly helpful for linking Blacks, who tend to have more common names than whites.
We construct our dataset linking individuals across the 1920 and 1940 Censuses in three steps, which we briefly describe here (further details can be found in Online Appendix B). First, we link men in SS-5 records to themselves in the 1940 Census using full names, year of birth, and place of birth. The linking process for women is analogous, except that we try to link them twice, once using their birth name and once using their married name. Next, we link siblings in SS-5 records together primarily based on parent names. The resulting sibling linkages are used to reconstitute families in the SS-5 data. Lastly, we link families in the SS-5 data to households in the 1920 Census using parent names and information on children (first and middle name, year of birth, place of birth). Panel A in Online Appendix Table A1 presents our linking results. Ultimately, we are able to link around 10 percent of Black men and women to both the 1920 and 1940 Censuses at a 95 percent precision rate relative to human trainers.
Online Appendix Tables A2 and A3 assess the representativeness of our linked sample in terms of demographics and 1940 characteristics, separately by gender. There are several noticeable differences. First, since earlier cohorts are underrepresented in SS-5 records, they are underrepresented in the linked sample as well. This cohort imbalance naturally implies imbalance along other outcomes that are correlated with age, such as marital status and fertility. Second, name-based linking tends to produce samples that are skewed toward higher socio-economic status individuals, which is clear from education disparities. Column (4) shows that we can statistically reject the null hypotheses that the means in the population and linked sample are equal. To make our linked sample representative of the population, we re-weight it using inverse propensity score weights following Bailey, Cole, and Massey (Reference Bailey, Cole and Massey2020).Footnote 6 The weighted means in Column (3) are very close to the population means, even for outcomes we did not target. Although we can still statistically reject equality of means for many outcomes, the magnitude of these differences is very small. Online Appendix Figure A3 shows that our (unweighted) linked sample also has good coverage of 1920 counties of residence.
Given that Rosenwald schools were primarily built in rural areas, we further restrict our linked sample to Blacks who were living in rural areas within the South in 1920 according to the Census Bureau’s definition (around 83 percent of Blacks in our linked sample). Table 1 provides summary statistics for our final linked sample, which includes around 24,000 Black men and 25,000 Black women.Footnote 7
LINKED SAMPLE, SUMMARY STATISTICS

Notes: This table shows summary statistics for Black men and women in our linked sample. Means are weighted using inverse propensity score weights.
Sources: See text for details.
Rosenwald Schools
Information on Rosenwald schools comes from Aaronson and Mazumder (Reference Aaronson and Mazumder2011) and Aaronson, Lange, and Mazumder (Reference Aaronson, Lange and Mazumder2014). Key pieces of information include the budget year (proxy for the year of construction), the county in which the school was built, and the number of classrooms (proxy for the number of teachers). In total, the database includes 4,932 Rosenwald schools built across 888 counties.
EMPIRICAL STRATEGY
In the empirical analysis, we estimate the impact of rural Blacks’ exposure to Rosenwald schools, based on their county of residence in 1920 and when they were born, on their outcomes in 1940. Note that we can observe individuals regardless of where they lived in 1940. Following Aaronson and Mazumder (Reference Aaronson and Mazumder2011), exposure to Rosenwald schools is defined as the number of Rosenwald teachers per 45 rural Black children aged 7–13 in the individual’s county, averaged over the years he/she was aged 7–13:Footnote 8
 $$\[{\rm{ROS}}{{\rm{E}}_{bc}} = \frac{1}{7} \cdot \sum\nolimits_{t = b + 7}^{b + 13} {\frac{{{\rm{Rosenwald}}\,{\rm{teacher}}{{\rm{s}}_{ct}} \cdot 45}}{{{\rm{rural Black school - age population (7 - 13}}{{\rm{)}}_{ct}}}},} \]$$
where b denotes birth cohorts and c denotes counties. The number of Rosenwald teachers is approximated using the number of classrooms in each school. The cross-sectional and time variation in the number of Rosenwald teachers per rural Black school-age child is depicted in Online Appendix Figure A4.
Consider an individual i from birth cohort b and residing in county c in 1920. Our main regression specification, estimated separately by gender, takes the form:
 $$\[{y_{ibc}} = {\delta _{bs(c)}} + \beta \cdot {\rm{ROS}}{{\rm{E}}_{bc}} + \Omega \cdot {{\rm{Z}}_c} + \Gamma \cdot {{\rm{X}}_i} + {\varepsilon _{ibc}},\]$$
where y ibc is an outcome in 1940, δ bs(c) are cohort-by-1920 state of residence fixed effects, Zc are controls for pre-Rosenwald 1910 county characteristics, and Xi are individual-level controls. The 1910 county controls include the population share of rural Blacks, the literacy rate among rural Blacks and rural whites aged 15+, and the school attendance rate among rural Blacks and rural whites aged 5–17. The individual-level controls include cohort-by-state-of-birth fixed effects and 1920 household controls (father occupational income score, indicators for father/mother literacy, homeownership status). The purpose of the individual-level controls is to increase the precision of the estimates. Observations are weighted using the inverse propensity score weights, and standard errors are clustered at the 1920 county of residence level.
The coefficient of interest, β, captures the impact of “full exposure” to Rosenwald schools, relative to no exposure. An individual experienced full exposure to Rosenwald schools if there were enough seats in Rosenwald schools to accommodate all rural school-age Black children in his/her county during the years he/she was aged 7–13 (assuming a class size of 45). In practice, Rosenwald exposure ranges from 0.07 for the 1910 cohort to 0.32 for the 1919 cohort. The OLS estimate of β can be interpreted as the causal effect of Rosenwald schools if Rosenwald exposure is uncorrelated with the error term, conditional on all other controls. Given that we focus on a relatively narrow set of cohorts and flexibly control for state-specific cohort trends, identification primarily comes from cross-county variation in Rosenwald exposure. Therefore, the main threats to identification are omitted county-level factors that are both correlated with the presence of Rosenwald schools and independently affect Blacks’ outcomes in 1940.
It is well-known that the placement of Rosenwald schools was not completely random. Prior studies provide evidence that counties in which (a greater number of) Rosenwald schools were built had higher rates of Black and white literacy, higher population shares of Blacks, and lower rates of Black school attendance (Aaronson and Mazumder Reference Aaronson and Mazumder2011; Carruthers and Wanamaker Reference Carruthers and Wanamaker2013; Eriksson Reference Eriksson2020). The Rosenwald Fund may have intentionally targeted places with higher rates of white literacy to avoid white backlash, while communities with higher rates of Black literacy and fewer pre-existing Black educational opportunities may have been more receptive to the initiative. To the extent that these characteristics independently affected later-life outcomes of Blacks who grew up in those communities, this could bias our estimate of the effect of Rosenwald exposure. For this reason, our baseline specification includes controls for these specific characteristics. To alleviate remaining concerns, we perform two exercises in the analysis. First, we will show that in a placebo sample of rural Blacks who completed their education prior to the Rosenwald era, future Rosenwald exposure does not affect educational attainment. Second, we will present results based on a specification that includes county fixed effects, which reveals similar patterns as our baseline estimates.
Previous studies have used different empirical strategies to estimate the impact of Rosenwald schools, notably exploiting urban Blacks and whites as control groups for rural Blacks in a difference-in-difference or triple-difference setup (Aaronson and Mazumder Reference Aaronson and Mazumder2011; Aaronson Lange, and Mazumder Reference Aaronson, Lange and Mazumder2014; Eriksson Reference Eriksson2020). While these differencing approaches help eliminate factors that are correlated with Rosenwald exposure and have a common effect on different groups, there are some caveats. First, urban Blacks likely experienced some exposure to Rosenwald schools as well. While Rosenwald schools were primarily built in rural areas, some schools were likely built in urban areas. Second, Carruthers and Wanamaker (Reference Carruthers and Wanamaker2013) document that expenditures on white schools increased in Rosenwald counties, hinting at spillover effects in terms of educational resources. Lastly, both urban Blacks and whites may have been indirectly affected by spillover effects arising from the entry of higher-educated rural Blacks into the local labor market. While spillover effects in terms of educational resources would likely lead us to underestimate the impact of Rosenwald schools, the direction of the bias due to general equilibrium effects in the labor market is less clear. Focusing on rural Blacks allows us to abstract away from such issues. Our approach is similar to that of Aaronson et al. (2021), except that they do not observe individuals’ rural status and instead distinguish between Blacks living in rural-only counties vs. mostly urban counties and assign exposure based on individuals’ county of birth.
Throughout the analysis, we present separate estimates for Blacks born in 1910–1914 vs. 1915–1919, which we will refer to as “older” and “younger” cohorts, respectively, given their age in 1940. We do this for two reasons. First, older cohorts had fewer educational opportunities than younger cohorts during their school-age years. Online Appendix Figure A5 plots Black educational statistics (enrollment rates, term lengths, number of schools, student-teacher ratios, expenditures per student, average teacher salaries) between 1910 and 1940 in 10 Southern states using data from Carruthers and Wanamaker (2019). Clearly, educational access and resources for Southern Black children were rapidly improving over this period. Assuming diminishing returns to education inputs, we might expect the marginal impact of one additional Rosenwald teacher to be greater for older cohorts of Blacks. Second, we observe outcomes for older cohorts when they are in their late 20s in 1940 (younger cohorts are observed in their early 20s), which likely better approximates the impact of Rosenwald schools on individuals’ labor market standing.
Although we re-weighted our linked sample to be representative of the population in terms of demographics and 1940 outcomes, one might worry that individuals in our linked sample were selected in terms of exposure to Rosenwald schools in 1920. Table 2 tests this hypothesis by estimating Equation (2) in a sample stacking our linked sample and the population of interest in the 1920 Census, where the dependent variable is an indicator for being in the linked sample. Observations in the linked sample are assigned their inverse propensity score weight, while observations in the population are assigned a constant weight. Under the null hypothesis of no selection, we would not expect Rosenwald exposure to be predictive of being in the linked sample. The resulting estimates imply that this type of selection is not a major concern.
SELECTION INTO LINKED SAMPLE BASED ON EXPOSURE TO ROSENWALD SCHOOLS

* = Significant at the 10 percent level.
** = Significant at the 5 percent level.
*** = Significant at the 1 percent level.
Notes: All regressions include cohort-by-state-of-birth fixed effects, cohort-by-1920 state of residence fixed effects, 1920 household controls (father occupational income score, indicators for homeownership, father literacy, and mother literacy), and 1910 county controls (share of rural Blacks, rural Black/white literacy rate, rural Black/white school attendance rate). Observations in the linked sample are assigned their inverse propensity score weight from Online Appendix Tables A2–A3, while observations in the population are assigned a constant weight (weights are normalized to sum to one within each sample). Robust standard errors in parentheses, clustered at the county level.
Sources: See text for details.
RESULTS
Educational Attainment
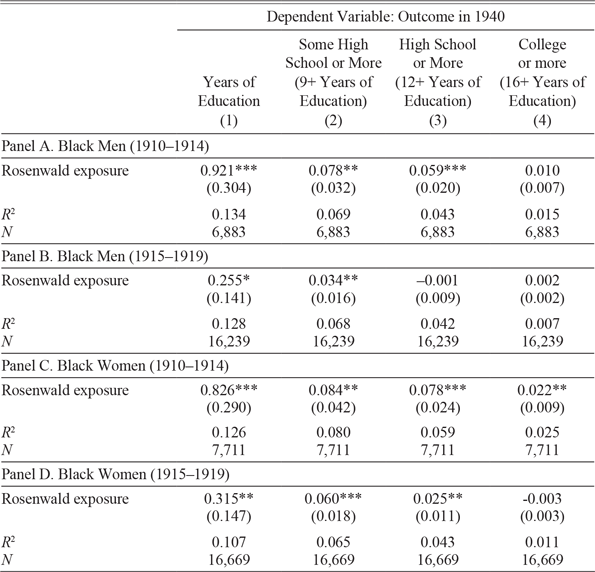
We begin by establishing that exposure to Rosenwald schools had a positive impact on the educational attainment of Black men and women in our linked sample, as we would expect given the findings in Aaronson and Mazumder (Reference Aaronson and Mazumder2011).Footnote 9 The first column in Table 3 shows the impact of Rosenwald schools on years of education in 1940. Full exposure to Rosenwald schools increased years of education by 0.92 and 0.83 years for older cohorts of Black men and women, respectively, both statistically significant at the 1 percent level. The corresponding effects for younger cohorts of Black men and women are smaller (0.26 and 0.32 years).Footnote 10
THE IMPACT OF ROSENWALD SCHOOLS ON EDUCATIONAL ATTAINMENT IN 1940
* = Significant at the 10 percent level.
** = Significant at the 5 percent level.
*** = Significant at the 1 percent level.
Notes: All regressions include cohort-by-state-of-birth fixed effects, cohort-by-1920 state of residence fixed effects, 1920 household controls (father occupational income score, indicators for homeownership, father literacy, and mother literacy), and 1910 county controls (share of rural Blacks, rural Black/white literacy rate, rural Black/white school attendance rate). Observations weighted using inverse propensity score weights. Robust standard errors in parentheses, clustered at the county level.
Sources: See text for details.
The estimates in Columns (2) to (4) show the gains in different parts of the education distribution. For older cohorts of Black men and women, there are sizable gains in terms of high school attainment: Full exposure to Rosenwald schools raises the probability of completing high school by 5.9 percentage points for Black men and 7.8 percentage points for Black women. Put differently, going from no exposure to an exposure of 0.2, the average exposure for the 1914 cohort, translates into effects equivalent to around 20 percent of the baseline means (5 and 8 percent, respectively). Note that since Rosenwald schools mainly provided primary education, these estimates imply that exposed individuals were more likely to subsequently attend a Black high school. Exposure to Rosenwald schools also had a positive and statistically significant effect on college completion among older cohorts of Black women, but not Black men.
For younger cohorts of Black men, exposure to Rosenwald schools only has a significant effect on the probability of completing some high school, with no effect on high school or college completion. Younger cohorts of Black women experience statistically significant gains in terms of some high school education and high school completion, but not college completion. All in all, the effects tend to be smaller for younger cohorts of Black men and women than older cohorts, which, as we argued, may reflect the fact that younger cohorts faced better educational opportunities.Footnote 11 Another potential explanation is that the educational choices of younger cohorts were more impacted by the Great Depression than older cohorts (they were aged 10–14 at the onset of the Great Depression, whereas older cohorts were aged 15–19). It has been noted that in many families, economic circumstances led some children to become more involved in the labor market and household tasks (Elder Reference Elder1974), which may have resulted in lower responsiveness to educational opportunities such as Rosenwald schools.
As previously discussed, a primary concern is the presence of county-specific unobservable factors that are correlated with Rosenwald exposure and independently affect Blacks’ outcomes in adulthood. We test for the presence of such factors using a “placebo” sample of Black men and women born in the South between 1890 and 1897. We link these individuals in SS-5 records to the 1900 and 1940 Censuses using the same methodology as for the main sample and analogously restrict the sample to Blacks living in rural areas in 1900.Footnote 12 We then estimate Equation (2) using 1900 rather than 1920 information, and assign Rosenwald exposure from 20 years later. Since these individuals completed their education prior to the first Rosenwald schools, their educational attainment should be uncorrelated with future Rosenwald exposure.Footnote 13 The resulting estimates are shown in Online Appendix Table A5. Reassuringly, we find no evidence that future Rosenwald exposure is correlated with educational attainment for pre-Rosenwald cohorts.
Labor Force Participation
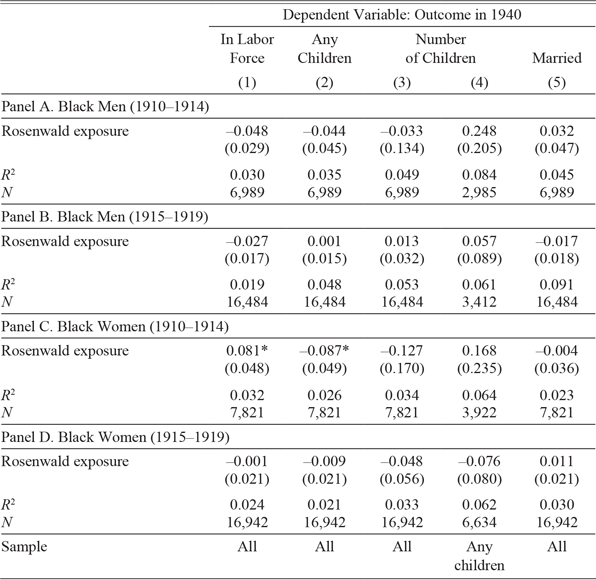
The first column in Table 4 shows the impact of Rosenwald schools on labor force participation. The estimates in the top two panels show that exposure to Rosenwald schools did not significantly affect the labor force participation of Black men, which is perhaps not surprising given that they had very high labor force participation rates at the time (over 90 percent). While the fact that the coefficients are negative might seem puzzling, a closer look suggests that this could be the product of census enumeration errors that failed to distinguish between employees and occupants of institutional facilities.Footnote 14
THE IMPACT OF ROSENWALD SCHOOLS ON LABOR FORCE PARTICIPATION, FERTILITY, AND MARITAL STATUS IN 1940
* = Significant at the 10 percent level.
** = Significant at the 5 percent level.
*** = Significant at the 1 percent level.
Notes: All regressions include cohort-by-state-of-birth fixed effects, cohort-by-1920 state of residence fixed effects, 1920 household controls (father occupational income score, indicators for homeownership, father literacy, and mother literacy), and 1910 county controls (share of rural Blacks, rural Black/white literacy rate, rural Black/white school attendance rate). Observations weighted using inverse propensity score weights. Robust standard errors in parentheses, clustered at the county level.
Sources: See text for details.
The corresponding results for Black women are shown in the bottom two panels. Full exposure to Rosenwald schools raised the probability of being in the labor force by 8.1 percentage points among Black women born in 1910–1914, statistically significant at the 10 percent level. One can show that this increase is offset by an equally large decline in the “housework” category of non-labor force participation, implying that additional schooling drew Black women into the labor force who likely would have otherwise been involved in home production. In terms of magnitude, our estimate implies that going from no exposure to an exposure of 0.2 leads to an increase in labor force participation equivalent to 4 percent of the baseline mean for older cohorts of Black women (40 percent). In contrast, we find no significant effect on the labor force participation of Black women born in 1915–1919, which could simply reflect the smaller gains in terms of educational attainment documented in Table 3.
Overall, this suggests that education, and high school completion in particular, may have been an important determinant of Black women’s labor force participation. This finding is reminiscent of the fact that rising high school attainment was a major factor behind the rise in white women’s labor force participation rate over the first half of the twentieth century (Goldin 1990). However, whereas the rise in white women’s labor force participation was fueled in part by rising demand in clerical occupations, we show in the next section that Black women exposed to Rosenwald exposure made no headway in clerical jobs.
Aaronson, Lange, and Mazumder (Reference Aaronson, Lange and Mazumder2014) show that Black women exposed to Rosenwald schools delayed or reduced childbearing along both the extensive and intensive margins, consistent with the notion that improved schooling opportunities raised the opportunity cost of raising children. Given our finding on Black women’s labor force participation, Columns (2)–(4) in Table 4 explore the impact of Rosenwald schools on Black women’s fertility choices. We consider three measures of fertility: an indicator for having any children, the number of children, and the number of children conditional on having any children.
Consistent with the positive effect on labor force participation, full exposure to Rosenwald schools reduces the probability of having any children by 8.7 percentage points among Black women born in 1910–1914, statistically significant at the 10 percent level. The coefficient for the number of children is negative but not statistically significant. The intensive margin effect is actually positive but also not statistically significant. We find no meaningful effect on the fertility decisions of Black women born in 1915–1919. Column (5) looks at the impact of Rosenwald schools on the probability of being married in 1940. While we might have expected women to delay marriage as well, exposure to Rosenwald schools had no significant impact on Black women’s marital status in 1940.
Occupational Standing
We now turn to the impact of Rosenwald schools on occupational standing. We classify occupations into five major categories: farmers, unskilled jobs, blue-collar jobs, white-collar jobs, and “other” jobs. Farmers include farm owners, tenant farmers, and sharecroppers. To try to tell apart farm owners from tenant farmers/sharecroppers, we distinguish between farmers who are renters and farmers who are homeowners. Unskilled jobs include farm laborers, laborers, private household workers, and service workers. Blue-collar jobs include operatives and craftsmen. White-collar jobs include sales workers, clerical workers, professionals, and managers. “Other” jobs is a residual category covering non-occupational responses such as housekeeping or taking care of one’s parents.
Black and white workers held vastly different jobs in 1940. Online Appendix Figure A6 plots employment shares among Southern-born Black and white workers aged 25–54. Panel A shows that Black male workers were disproportionately concentrated at the bottom of the job ladder. Relative to white workers, they were more likely to be tenant farmers than farm owners, and they were overrepresented in unskilled jobs and underrepresented in blue-collar jobs. Notably, very few Black male workers held white-collar jobs, whereas a quarter of white male workers were white-collar workers. Women held different types of jobs than men, but Panel B tells a similar story. Nearly 60 percent of Black female workers were private household workers, and only 7 percent of them were white-collar workers. In contrast, only 7 percent of white female workers were private household workers, and half of them were employed in white-collar jobs.
Racial differences in occupational standing reflect two realities. On the one hand, many Blacks lacked the necessary skills to obtain certain jobs. This is evident from the large racial gap in educational attainment. On average, Southern-born whites aged 25–54 in 1940 had three more years of education than their Black counterparts. A quarter of whites had a high school degree, whereas the corresponding share among Blacks was only 7 percent. It is therefore not surprising that Blacks were concentrated at lower rungs of the job ladder. On the other hand, contemporary accounts suggest Blacks were excluded from certain jobs on the basis of their race, regardless of their qualifications (Myrdal Reference Myrdal1944). As suggestive evidence, Online Appendix Figure A7 plots employment shares among workers with exactly 12 years of education. Black, high school educated-workers were strikingly underrepresented in craftsman, sales, clerical, and managerial positions, relative to their white counterparts.
While it is tempting to compare white and Black workers with the same education level and attribute any gap in their occupational standing to labor market discrimination, there are pitfalls to this type of logic. As already mentioned, Black schools were underfunded relative to white schools, which means that part of the gap likely reflects differences in the quality of instruction. In addition, Blacks’ ability to leverage the skills they acquired in school may have been hampered by the fact that they came from poorer, less-educated families than whites (Margo Reference Margo1990). In this paper, we instead compare the occupational standing of Blacks who exogenously received varying boosts to their education—both in terms of quantity and quality—due to differential exposure to Rosenwald schools. Given that greater educational attainment is generally thought to lead to better job opportunities, we argue that the size and nature of any associated occupational gains are informative about the relative importance of human capital and labor market barriers in explaining the racial gap in occupational standing.
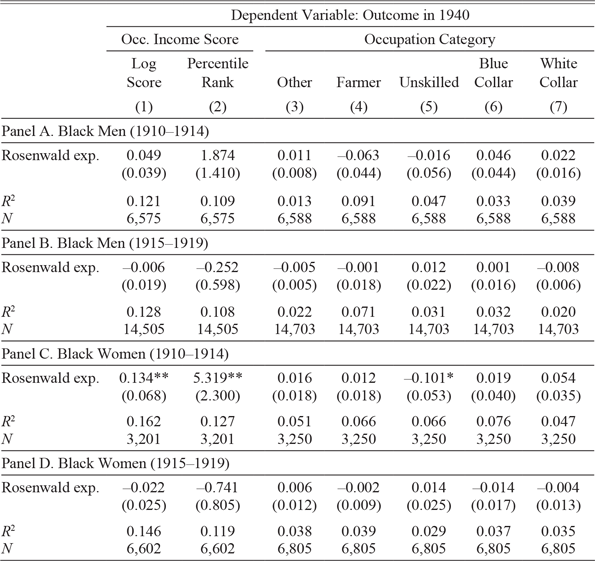
Table 5 shows the impact of Rosenwald schools on the occupational standing of Black men and women. In Columns (1) and (2), we assess whether Blacks exposed to Rosenwald schools had better jobs on average in 1940, as measured by the race- and region-specific occupational income scores from Collins and Wanamaker (Reference Collins and Wanamaker2022), either in logs or in percentile ranks.Footnote 15 Employing race-specific occupational income scores is important since Black and white workers with the same job title often had different duties and earned different wages. Since occupational income scores can potentially cloud reallocation across occupations, Columns (3)–(7) examine the impact of Rosenwald exposure on the probability of being employed in one of the five major occupation groups in 1940.
THE IMPACT OF ROSENWALD SCHOOLS ON OCCUPATIONAL STANDING IN 1940
* = Significant at the 10 percent level.
** = Significant at the 5 percent level.
*** = Significant at the 1 percent level.
Notes: Sample restricted to individuals in the labor force. All regressions include cohort-by-state-of-birth fixed effects, cohort-by-1920 state of residence fixed effects, 1920 household controls (father occupational income score, indicators for homeownership, father literacy, and mother literacy), and 1910 county controls (share of rural Blacks, rural Black/white literacy rate, rural Black/white school attendance rate). Observations weighted using inverse propensity score weights. Robust standard errors in parentheses, clustered at the county level.
Sources: See text for details.
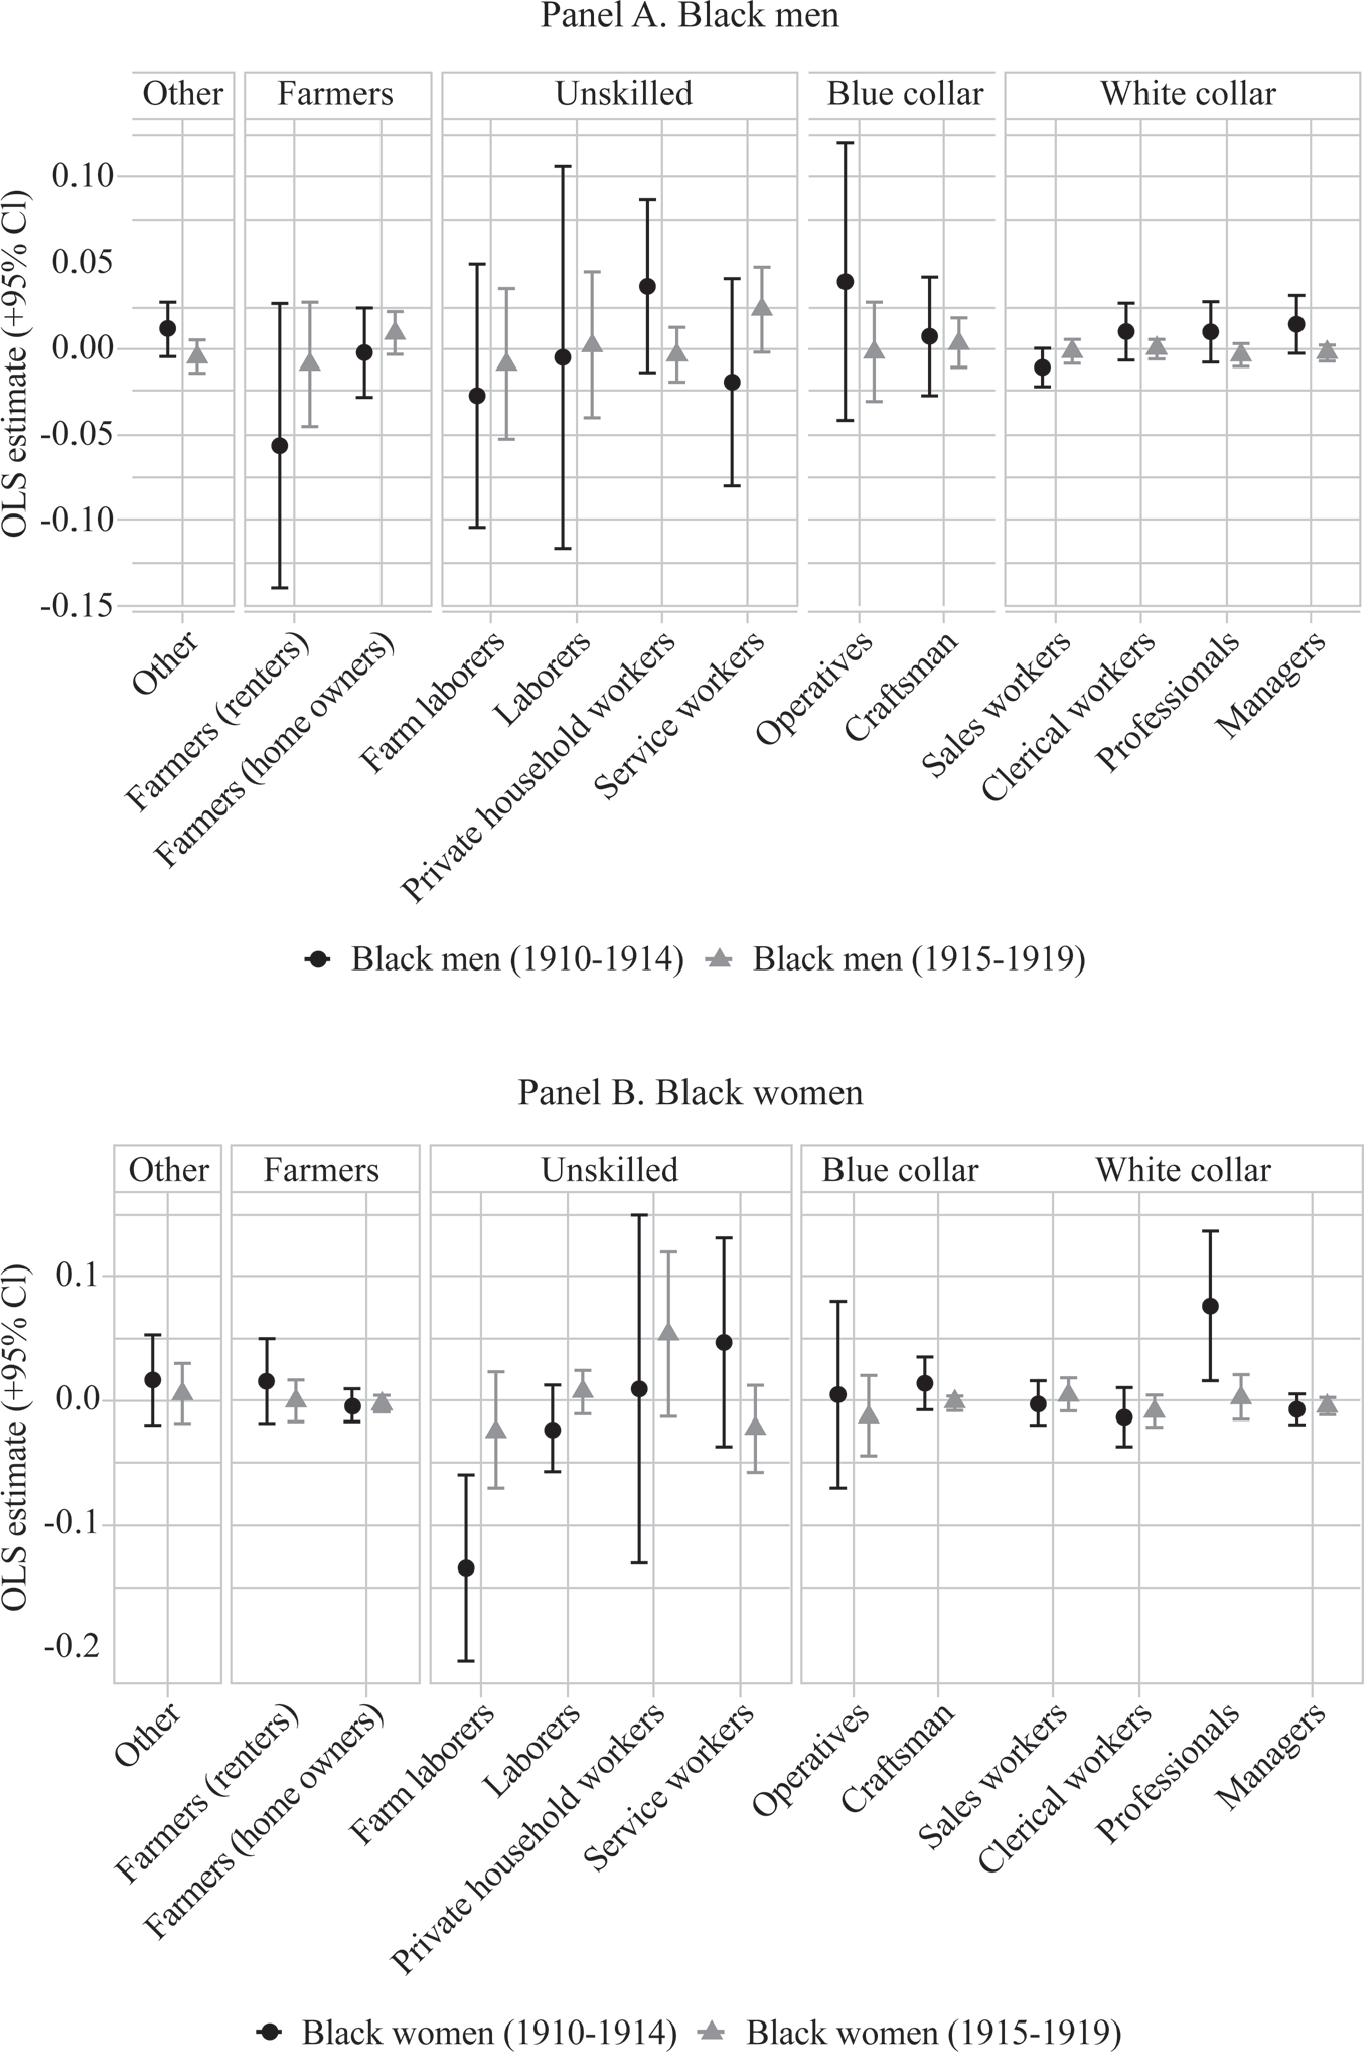
We start by looking at Black men born in 1910–1914. The results in Panel A imply that Rosenwald exposure had a positive but statistically insignificant effect on occupational income scores. This reflects a negative effect on the probability of being a farmer in 1940, offset by positive effects on the probability of being employed in a blue-collar or white-collar job, though none of the coefficients are statistically significant at conventional levels. To shed further light on occupational changes within broad occupation categories, Panel A in Figure 2 shows estimates at the occupation group level. The main takeaways are that the losses in farming jobs are driven by non-homeowning farmers, while the gains in blue-collar jobs are concentrated in the lower-paying operatives category, though these coefficients are not significant. Panel A in Figure 3, which displays coefficients for the top ten 3-digit occupations in terms of gains and losses, reveals that the small gains in white-collar jobs are almost entirely driven by just two categories: (1) “Managers, officials, and proprietors (n.e.c.),” and (2) “Musicians and music teachers” (the former is significant at the 10 percent level, while the latter is significant at the 5 percent level). One can show that the positive effect on the miscellaneous manager category is driven by self-employed workers, mostly in the “Eating and drinking places” industry code, which suggests that the underlying jobs are likely storekeepers of various kinds.
THE IMPACT OF ROSENWALD SCHOOLS ON OCCUPATION GROUPS IN 1940
Notes: Each point corresponds to the OLS estimate from Equation (2), where the dependent variable is an indicator for being in a particular occupation group in 1940 (x-axis). The error bars represent the corresponding 95 percent confidence intervals.
Sources: See text for details.
THE IMPACT OF ROSENWALD SCHOOLS ON SELECTED OCCUPATIONS IN 1940
Notes: Each point corresponds to the OLS estimate from Equation (2), where the dependent variable is an indicator for being in a particular 3-digit occupation in 1940 (x-axis). The error bars represent the corresponding 95 percent confidence intervals.
Sources: See text for details.

The results in Panel C of Table 5 imply that Rosenwald exposure had a significant positive impact on the occupational standing of Black women born in 1910–1914. Full exposure to Rosenwald schools raises occupational income scores by 13 percent and occupational income score ranks by 5 percentiles, both statistically significant at the 5 percent level. This is consistent with the finding in Aaronson, Lange, and Mazumder (Reference Aaronson, Lange and Mazumder2014) that Rosenwald exposure had a positive effect on occupational income scores of Black women aged 18–22 in 1930. Columns (3)–(7) show that the occupational gains are driven by a 5.4 percentage point rise in the probability of working in white-collar jobs and a 10.1 percentage point reduction in the probability of working in unskilled jobs, though only the latter effect is statistically significant. Digging deeper, Panel B in Figure 2 shows that the losses in unskilled jobs are driven by farm laborers while the gains in white-collar jobs are concentrated in professional jobs. Panel B in Figure 3 shows that almost all the gains in white-collar jobs are concentrated in the school teacher occupation (“Teachers (n.e.c.)”). Given the positive impact of Rosenwald exposure on female labor force participation, it is important to note that the gains in occupational standing could partly reflect positive selection into the labor force.Footnote 16
Moving on to Black men and women born in 1915–1919, the estimates in Panels B and D of Table 5 and Figure 2 are all close to zero and statistically insignificant. Assuming education was a key channel through which Blacks could achieve gains in the labor market, this may simply reflect the smaller gains in terms of educational attainment in response to Rosenwald exposure among younger cohorts, which, as we have argued, could come from the fact that these cohorts enjoyed better educational opportunities than prior cohorts or the fact that their educational choices may have been disproportionately affected by the Great Depression. Another possibility is that these cohorts were still too young in 1940 to detect any effects.
Robustness Checks
In Online Appendix D, we subject our main findings to a variety of robustness checks, which we briefly summarize here. To alleviate concerns related to the non-random placement of Rosenwald schools, Online Appendix D.1 presents results using an alternative specification that includes county fixed effects and therefore relies on within-county cross-cohort variation in Rosenwald exposure for identification. The resulting educational attainment estimates are smaller in magnitude than our baseline estimates and statistically insignificant. However, the associated 95 percent confidence intervals are wide and contain the baseline estimates. As in our baseline results, exposure to Rosenwald schools has a positive and significant effect on the labor force participation and occupational income scores of Black women, but not Black men.
One notable difference lies in the occupational reallocation patterns, with evidence that Black men and women exposed to Rosenwald schools were less likely to hold unskilled jobs and more likely to hold blue-collar jobs in 1940. Nevertheless, consistent with our baseline results, we do not find that Black workers made significant gains in craftsman, sales, or clerical positions. Furthermore, over half of the gains in blue-collar jobs are concentrated in two of the most common ones among Southern Black workers: “Operative and kindred workers (n.e.c.)” and “Truck and tractor drivers.”Footnote 17 While the gains among Black women are reflected in their occupational income scores, that continues not to hold for Black men. Therefore, to the extent that Black men made some gains in blue-collar jobs, those gains were limited and concentrated in jobs where they were already commonly found. Overall, taking into account statistical imprecision, we view the results from this alternative specification as being largely consistent with our main findings.
To address concerns that the selection of individuals into SS-5 records might affect our results, Online Appendix D.2 shows that exploiting alternative datasets directly linking the 1920 and 1940 Censuses yields similar results for Black men. In particular, despite significantly larger sample sizes, there is no evidence that exposure to Rosenwald schools had a significant positive impact on Black men’s occupational standing.Footnote 18 To address selection concerns related to linked samples in general, Online Appendix D.3 presents alternative results based on rural Black men and women in the 1940 Census who likely still live where they grew up (based on their location at birth, in 1935, and in 1940), for which we can therefore approximate exposure to Rosenwald schools. This alternative approach yields patterns that are remarkably similar to our baseline results.
Lastly, in Online Appendix D.4 we show that our results are robust to: (1) defining exposure to Rosenwald schools based on ages 7–17, (2) assigning exposure to Rosenwald schools based on individuals’ birth counties (to alleviate concerns related to selective migration to Rosenwald counties), (3) targeting a precision rate of 90 percent in the construction of our linked sample, and (4) alternative weighting schemes.Footnote 19
DISCUSSION
Circling back to our question of interest—the relative importance of barriers to human capital accumulation vs. barriers in the labor market in explaining the racial gap in occupational standing around the mid-twentieth century—what should we take away from our findings? In this section, we focus on the nature of occupational gains, which we believe is most revealing.
First, it is apparent that Black men exposed to Rosenwald schools made no discernible gains in jobs that required post-secondary education (e.g., lawyers, doctors), which is not surprising given that we found no impact on their college attainment. On the other hand, Black women made some gains in teaching jobs, consistent with the positive effect on college attainment we documented. It is also possible that Black women eventually became teachers at the Rosenwald school they attended, which may have provided a clear pathway into the profession. As suggestive evidence, Online Appendix Table A14 estimates the effect of Rosenwald schools on the joint outcome of being a teacher in 1940 and living in a rural area within the same county as in 1920 or the joint outcome of being a teacher in 1940 and not living in the same location as in 1920. The estimates imply that more than half of the gains in teaching jobs among Black women born in 1910–1914 are concentrated among women who lived in the same location in 1940 as in 1920.
Second, despite significant gains in high school attainment, Black men and women exposed to Rosenwald schools made no significant gains in white-collar jobs for which they were likely qualified. Two prime examples are sales jobs and clerical jobs, for which the median education level among white workers was no more than 12 years. Instead, the gains in white-collar jobs that Blacks were able to achieve were concentrated in jobs where they were already commonly found, such as storekeepers and school teachers, which were two of the most common white-collar jobs among Black men and women in 1940.Footnote 20 Perhaps more surprisingly, Blacks exposed to Rosenwald schools made no headway in craftsman positions either, in which the median educational attainment among white workers was generally closer to eight or nine years.
What explains the absence of gains in these seemingly attainable jobs? One potential explanation is that Blacks lived in places where few such jobs were available. However, suggestive evidence from the 1940 Census does not support this notion. For each county in the South, Online Appendix Figure A8 plots the county’s share of the total Southern Black population against the county-specific share of white workers in sales, clerical, and craftsman jobs. If anything, the share of white workers in those jobs was higher in counties that contained a greater share of the Southern Black population.Footnote 21 Therefore, the occupational structure in places where Blacks disproportionately lived is unlikely to account for the absence of gains in those jobs.
Another possible explanation is that Black children were simply not trained/conditioned to enter these jobs while in school. Many Black schools in the early twentieth-century South placed a strong emphasis on “industrial” or “vocational” training, which focused on developing skills such as gardening, woodworking, cooking, laundering, and housekeeping (Anderson Reference Anderson1988). Proponents of this teaching philosophy, notably Booker T. Washington, recognized that Black workers had limited opportunities in the Southern labor market and viewed industrial education as a pragmatic way of improving their economic prospects.Footnote 22 Many Southern whites were also in favor of industrial education, as training Blacks to become laborers or service workers helped preserve the hierarchy in place.
While industrial education may have induced some Blacks exposed to Rosenwald schools to become unskilled workers, its role was likely limited for two reasons. First, since Black communities often favored a “classical” education, most Rosenwald schools emphasized the three R’s (reading, writing, and arithmetic). Indeed, Embree and Waxman (Reference Embree and Waxman1949) note that “[t]raining in such essentials as farming, handcrafts, and hygiene was ignored. Industrial rooms, so scrupulously built in all ‘Rosenwald Schools,’ were often found to be used for coat closets or storerooms” (p. 71). Second, due to the costs of providing industrial training as well as the economic interests of competing white workers, industrial education failed to dominate elementary school curriculums in the South. Myrdal (Reference Myrdal1944) concludes that “[b]y and large, in spite of all the talk about it, no effective industrial training was ever given the Negroes in the Southern public schools, except training for cooking and menial service” (p. 899).
Instead, we argue that our findings are consistent with the notion that Blacks were effectively excluded from certain occupations due to racial discrimination. Myrdal (Reference Myrdal1944) describes the plight of Black workers as follows: “As a wage earner the Negro is excluded from many trades. Where he works he is commonly held down to the status of laborer and is excluded from skilled work. But there are always possibilities for him to enter these jobs, and he is always struggling to do so. In the occupations traditionally associated with upper or middle-class status, the exclusion policy is usually much more complete and ‘settled.’ This is because it is fortified by ‘social’ considerations, as well as by economic ones” (p. 304). Employers often refused to hire Black workers for certain positions, either because it was deemed “inappropriate” for white workers to work alongside Black workers or for Black workers to “oversee” white workers, or because white customers preferred not to interact with employees. To the extent that Black workers lacked the necessary skills to obtain skilled blue-collar jobs, it was often because white-dominated trade unions would prevent them from accumulating those skills in the first place (Spero and Harris 1931).Footnote 23 And in a 1940 Women’s Bureau survey, nearly half of the surveyed firms reported that they either had explicit or implicit policies prohibiting the hiring of Black clerical workers (Goldin 1990).Footnote 24 Our findings are therefore in line with the notion that racial prejudice among employers, unions, co-workers, and customers combined to prevent Blacks from obtaining “good” jobs, either by denying them the opportunity to acquire the necessary training or by barring them outright. As a result, many of them ended up in jobs like school teachers and storekeepers, which were attainable due to segregated schools, churches, and stores in the South.Footnote 25
While educated Black workers generally found it hard to break into sales, clerical, and craftsman jobs, there were meaningful differences between those who lived in urban areas and those who lived in rural areas. Online Appendix Figure A9 plots the 1940 occupational distribution among Black workers with 12 years of education, separately by urban status. Urban, high school-educated Black male workers were more likely to be employed in sales, clerical, and craftsman jobs than their rural counterparts (they were also more likely to be employed in service jobs). Accordingly, they were significantly less likely to be employed in farm-related jobs and slightly less likely to be employed in professional jobs. Similarly, urban, high school-educated Black female workers were less likely to be employed in professional and farm jobs than their rural counterparts and more likely to be employed in clerical, operative, and service jobs. These disparities between rural and urban Blacks reflect both differences in the availability of jobs and differences in the hurdles that Blacks faced in obtaining those jobs.
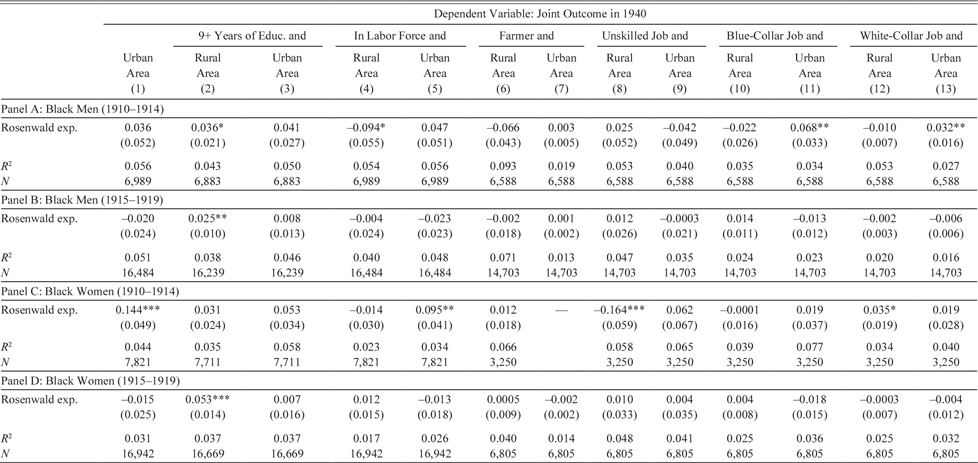
Motivated by these patterns, Table 6 examines the joint impact of Rosenwald schools on labor market outcomes and rural-to-urban migration, an important demographic trend at the time (Kyriakoudes Reference Kyriakoudes1998). If labor market conditions were more favorable for Blacks in urban areas, we might expect to see labor market gains among Blacks who moved to urban areas by 1940. Focusing on older cohorts of Black men and women, several findings stand out. First, Rosenwald exposure had a positive and statistically significant impact on the propensity of Black women to move to urban areas, and the positive labor force participation effect we documented earlier is entirely concentrated among Black women who moved to urban areas. Second, although Rosenwald exposure did not have a significant effect on Black men’s employment in blue-collar and white-collar jobs overall, this masks statistically significant gains among Black men who moved to urban areas. In terms of magnitude, going from no exposure to full exposure raised Black male workers’ probability of moving to urban areas and being employed in a blue-collar or white-collar job by 6.8 and 3.2 percentage points, respectively.
THE JOINT IMPACT OF ROSENWALD SCHOOLS ON URBAN STATUS AND LABOR MARKET OUTCOMES IN 1940
* = Significant at the 10 percent level.
** = Significant at the 5 percent level.
*** = Significant at the 1 percent level.
Notes: All regressions include cohort-by-state-of-birth fixed effects, cohort-by-1920 state of residence fixed effects, 1920 household controls (father occupational income score, indicators for homeownership, father literacy, and mother literacy), and 1910 county controls (share of rural Blacks, rural Black/white literacy rate, rural Black/white school attendance rate). Observations weighted using inverse propensity score weights. Robust standard errors in parentheses, clustered at the county level.
Sources: See text for details.
While these results suggest that Blacks exposed to Rosenwald schools who moved to urban areas experienced meaningful gains in the labor market, there is also a sense in which these gains were limited. Online Appendix Figure A10 shows that the gains in white-collar jobs among Black men are concentrated in professional and managerial jobs, with no significant gains in clerical and sales jobs. In fact, one can show that nearly two-thirds of the total effect can be attributed to the three most common white-collar jobs among Southern Black men (storekeepers, clergymen, teachers). Similarly, three-quarters of the total effect on blue-collar jobs can be attributed to a single occupation, “Truck and tractor drivers” (the second most common blue-collar job among Southern Black men), with no significant gains in craftsman jobs. Note that the most common blue-collar and white-collar jobs among Black men were also some of the lowest-paying ones.Footnote 26 All in all, while cities may have offered slightly better opportunities to Black workers, they still faced considerable hurdles in the labor market (Sundstrom Reference Sundstrom1994).Footnote 27
It is important to note that factors other than discrimination may have contributed to the absence of gains in jobs where Blacks were underrepresented. For example, Blacks may have lacked important support systems necessary to harness gains in educational attainment. School is but a single institution, whose success intimately depends on the broader environment (Bond Reference Bond1934). This idea is closely related to Margo (Reference Margo1990)’s “intergenerational drag” hypothesis, which posits that the racial gap in educational achievement in the early twentieth-century South was partly driven by “family background effects,” namely gaps in parental education and economic standing. In other work, Sundstrom (Reference Sundstrom1994) describes how racial divisions outside the labor market, such as residential segregation, may have indirectly limited the set of jobs available to Blacks. As a result, pre-existing inequities among the previous generation as well as the broader community, in conjunction with labor market discrimination, may have prevented Blacks exposed to Rosenwald schools from realizing their full potential.
One drawback of our analysis is that we can only observe the labor market outcomes of Blacks when they are in their 20s in 1940. As such, we cannot reject the possibility that some gains may have materialized after 1940.Footnote 28 Relevantly for our cohorts of interest, Black men and women made large strides in the labor market during the 1940s thanks to a WWII-related surge in labor demand and anti-discrimination policies (Collins Reference Collins2001, 2003; Bailey and Collins Reference Bailey and Collins2006; Aizer et al. Reference Aizer, Boone, Lleras-Muney and Vogel2020; Ferrara Reference Ferrara2022). The presence of post-war labor market gains will be testable once the 1950 Census becomes available to researchers. Note that delayed gains could be interpreted as highlighting the importance of labor market barriers given that both WWII and the Civil Rights Movement are thought to have diminished these barriers.
Our findings are closely related to a study by Carruthers and Wanamaker (2017), which shows that a large fraction of the racial wage gap among Southern men aged 18–25 in 1940 can be explained by observable differences in human capital, as measured by years of education and county-level proxies of school quality (e.g., expenditures per pupil, average teacher salaries). While this conclusion may seem at odds with our findings, this reflects the fact that we focus on occupations rather than income.Footnote 29 While income is informative of average effects (similar to occupational income scores), it sidesteps the fact that Blacks and whites were concentrated in different segments of the labor market, which is why we focus on the nature of occupational gains. Moreover, an important drawback of the 1940 Census income question is that it only asked about wage and salary income; other components of total income, chiefly farm and business income, are unobserved. As a result, wage income is either missing or a poor measure of labor market standing for many workers, notably farmers and self-employed workers.Footnote 30
Overall, our main takeaway is that while better schools might have helped Blacks earn higher wages or upgrade within the set of jobs that were available to them, the reality is that many jobs were simply out of reach, a view that Wright (Reference Wright1986) summarizes as follows: “Job discrimination in the better-paying positions was far more important than wage differentials for the same job. Blacks could get the going wage in the unskilled market, but there was a virtual upper limit to their possible progress above that level” (p. 185).
CONCLUSION
To what extent was the racial gap in occupational standing in the mid-twentieth-century South driven by educational disparities vs. labor market discrimination? This paper sheds new light on this question by exploring the labor market impact of the Rosenwald Schools Initiative, a large-scale school construction program that expanded access to high-quality education for Blacks in the rural South. Building on prior work showing that Blacks exposed to Rosenwald schools experienced significant gains in educational attainment, we assess whether exposure to Rosenwald schools also led to better labor market outcomes.
Using a new dataset linking Social Security application records to the 1920 and 1940 Censuses, we find that exposure to Rosenwald schools had a positive impact on Black women’s labor force participation and occupational standing. In contrast, we find little evidence that the occupational standing of Black men significantly improved, though we do find some gains among Black men who moved to urban areas. Moreover, despite significant gains in high school attainment, we find no evidence that Black men and women exposed to Rosenwald schools—including those who moved to urban areas—broke into jobs where they were heavily underrepresented, such as sales, clerical, and craftsman positions. The gains they were able to achieve are concentrated in jobs where they were commonly found, such as storekeepers and school teachers. Overall, our findings suggest that while educational disparities contributed to the racial gap in occupational standing, deep-rooted institutional barriers limited the scope for Black occupational advancement around 1940, consistent with contemporary accounts.


 Open access