


Policy Significance Statement
There is a crucial need for practical evidence-based approaches in public policy. This article proposes Bayesian adaptive trials (BATs) as a unifying framework for evaluating social policy interventions, addressing the limitations inherent in traditional methods, such as randomized controlled trials. BATs lower barriers to the adoption of evidence-based methods and align evaluation processes more closely with the dynamic nature of policy cycles. BATs, grounded in decision theory, offer a dynamic, “learning as we go” approach, enabling the integration of diverse information types and facilitating a continuous, iterative process of policy evaluation. BATs adaptive nature is particularly advantageous in policy settings, allowing for more timely and context-sensitive decisions.
1. Introduction
This article proposes the use of Bayesian adaptive trials (BATs) as a powerful framework to continually evaluate the impact of policy interventions. Most people acknowledge that a rigorous evidence-based approach to public and social policies and associated expenditure is crucial for effective resource allocation. It helps identify the most effective programs and initiatives, ensuring that limited public resources are invested where they yield the most significant benefits. In the absence of price signals, this is key to improving productivity and efficacy (Shepherd et al., Reference Shepherd, Hubbard, Fenton, Claxton, Leudeling and de Leeuw2015). Yet most would also acknowledge that governments and the social sector more generally have had very limited success in this area (Banerjee et al., Reference Banerjee, Banerji, Berry, Duflo, Kannan, Mukerji, Shotland and Walton2017; Gollust et al., Reference Gollust, Seymour, Pany, Goss, Meisel and Grande2017; Williams, Reference Williams2020). There are several reasons for this; policy decisions are often not evidence based but are the product of a myriad of factors—individual personalities, interest groups, and the ideologies of the government of the day, to name a few (Davis et al., Reference Davis, Althaus and Bridgman2018; Cairney, Reference Cairney2021). On those occasions where there is a willingness to embrace evidence-based approaches, adoption has been slow, impeded by a range of practical problems related to the complexity, diversity, and context dependence of responses to social programs (Allcott, Reference Allcott2015; Bates and Glennerster, Reference Bates and Glennerster2017; Bédécarrats et al., Reference Bédécarrats, Guérin and Roubaud2020; Gugerty and Karlan, Reference Gugerty and Karlan2018b).
This article argues that the BAT framework mitigates several of the abovementioned problems raised by the authors. BATs may lower the barriers to broader adoption of evidenced-based methodologies, and provide a systematic framework for embedding evidenced-based methodologies that are more in tune with the policy cycle.
At their core, BATs are an adaptive learning as we go approach to discovering which initiatives work best and under what conditions. They rely on the principles of Bayesian reasoning to combine various types of information, acquired either sequentially or simultaneously, in a logically consistent manner. In addition, BATs are set in a Bayesian decision-theoretic framework (Müller et al., Reference Müller, Berry, Grieve and Krams2006), and as such are able to attach value to potential sources of future information; thus, BATs can act as an optimal sequential data acquisition strategy during policy implementation (Cripps and Durrant-Whyte, Reference Cripps and Durrant-Whyte2023; Marchant et al., Reference Marchant, Ramos and Sanner2014). This continuous iterative approach to policy evaluation and implementation is a fundamental shift away from the retrospective evaluation of policies as either successes or failures.
Impact evaluation is a hot topic for many governments (Leigh, Reference Leigh2023). The difficulties associated with impact evaluation often stem from the limitations of the prevalent impact evaluation methodologies, such as randomized controlled trials (RCTs), the “gold standard” traditional impact evaluation method. The limitations of RCTs include cost, length of time, lack of agility to change as circumstances change, and the low success rate (Bédécarrats et al., Reference Bédécarrats, Guérin and Roubaud2020). There are also challenges in replicating and scaling results (Williams, Reference Williams2020; Epstein and Klerman, Reference Epstein and Klerman2012). Innovations for Poverty Action have conducted many RCTs to evaluate policy impact, and while some found evidence of high impact, most were inconclusive (Liket et al., Reference Liket, Rey-Garcia and Maas2014; Gugerty and Karlan, Reference Gugerty and Karlan2018b). Other common methods of impact evaluation, which are more flexible and inexpensive than RCTs, such as quasi-experimental methods and expert opinion, have other limitations: lack of statistical rigor and difficulties in establishing causality. External validity—generalizability of findings to populations other than those under study—has been difficult to establish across many studies (Allcott, Reference Allcott2015; Banerjee et al., Reference Banerjee, Banerji, Berry, Duflo, Kannan, Mukerji, Shotland and Walton2017; Deaton, Reference Deaton2020). This raises the question of whether the resources allocated to evaluations would be better spent monitoring outcomes and efforts (Gugerty and Karlan, Reference Gugerty and Karlan2018b).
BATs can serve both as an efficient method to conduct program trials and as a unifying framework for evaluating social policy interventions. BATs combine the best features of many methodologies, but arguably their main advantage is that they seamlessly expand to form a broader system of continuous organizational learning and policy formation. BATs are particularly valuable for pilots with the ultimate goal of scaling up in a similar context, as opposed to academic research that seeks to find treatment effects transportable to any context. When applied to pilots, BATs can be the start of a continuous learning process. While there are assumptions, such as prior distributions and models of data-generating processes (likelihood functions), we argue that these drawbacks are, in fact, advantages for decision-makers in social policy.
Setting impact evaluation systems in a decision-theoretic framework is not new (Wald, Reference Wald1947; Von Neumann and Morgenstern, Reference Von Neumann and Morgenstern1947); however, the computational cost of evaluating high-dimensional integrals has limited the domain of its application. Recent technological (Owens et al., Reference Owens, Houston, Luebke, Green, Stone and Phillips2008) and algorithmic advances (Luengo et al., Reference Luengo, Martino, Bugallo, Elvira and Särkkä2020) have enabled the practical implementation of decision-theoretic methods across many fields, such as medicine, marketing, and robotics (Schrage, Reference Schrage2021; Bourgault et al., Reference Bourgault, Makarenko, Williams, Grocholsky and Durrant-Whyte2002). Recently, adaptive (although not Bayesian) designs have been proposed in the policy context (Offer-Westort et al., Reference Offer-Westort, Coppock and Green2021; Esposito and Sautmann, Reference Esposito and Sautmann2022). BATs are a prominent form of adaptive clinical trials in medicine because of their flexibility and data efficiency (Warner et al., Reference Warner, Whitaker, Parker, Weir, Douglas, Hansen, Madhra, Hillier, Saunders and Iredale2021). Adaptive trials are increasingly preferred over traditional fixed clinical trial designs (Fors and González, Reference Fors and González2020; Noor et al., Reference Noor, Love, Isaacs, Kaplan, Parmar and Sydes2022) because they provide a faster, more flexible, efficient, and ethical way to conduct clinical trials (Thorlund et al., Reference Thorlund, Haggstrom, Park and Mills2018; FDA Guidance, 2019). Adaptive platform trials played a crucial role in the research response to COVID-19 (Vanderbeek et al., Reference Vanderbeek, Bliss, Yin and Yap2022). In contrast to fixed-design trials, adaptive trials allow for modifications to the trial protocol based on accumulated data. The efficient adaptations are particularly valuable in situations that bear strong similarities to social policy contexts, such as those characterized by high data collection costs, large numbers of potential treatments, response variability across patients, time constraints, and significant ethical concerns (Barker et al., Reference Barker, Sigman, Kelloff, Hylton, Berry and Esserman2009; Kim et al., Reference Kim, Herbst, Wistuba, Lee, Blumenschein, Tsao, Stewart, Hicks, Erasmus and Gupta2011; Chaudhuri et al., Reference Chaudhuri, Lo, Xiao and Xu2020; Bédécarrats et al., Reference Bédécarrats, Guérin and Roubaud2020; Berry et al., Reference Berry, Carlin, Lee and Muller2010). In marketing, “perpetual” BATs are widely used in areas such as multi-arm A/B testing, marketing mix modeling, price discovery, and recommender systems (Schrage, Reference Schrage2021).
The remainder of this article is structured as follows: Section 2 gives a qualitative overview of BATs. Section 3 highlights the utility of BATs as a framework for evidence systems in the social policy setting. To illustrate the structure and benefits of BATs using a concrete example, we consider decisions surrounding tutoring as a potential intervention to address post-pandemic learning loss (Donnelly and Patrinos, Reference Donnelly and Patrinos2022; Engzell et al., Reference Engzell, Frey and Verhagen2021). Section 4, aimed at the technical reader, provides a numerical illustration of the efficiency of BATs in finding the optimal dose of tutoring hours in a simulated educational setting. Readers interested only in the policy perspective on BATs can skip this section. Section 5 discusses the implications of BATs for organizational learning and strategy. Section 6 concludes this article.
2. BATs: an introduction
In this section, we provide a general introduction to BATs and basic notation. Readers seeking a more technical discussion can refer to Section 4. To illustrate the methodology, we use the example of decisions related to rolling out tutoring interventions to address post-pandemic learning loss, an issue being considered by education departments worldwide (Donnelly and Patrinos, Reference Donnelly and Patrinos2022; Engzell et al., Reference Engzell, Frey and Verhagen2021).
BATs offer a rigorous approach for establishing causal relationships between initiatives and their effects, distinguished by two key features: (1) they are grounded in the Bayesian decision-theoretic framework, and (2) they are adaptive. BATs offer several advantages over traditional experimental approaches, which will be explored in detail in Section 3, particularly in the context of social policy.
A major advantage of BATs is their alignment with the needs of decision-makers (Shepherd et al., Reference Shepherd, Hubbard, Fenton, Claxton, Leudeling and de Leeuw2015). They directly address practical questions such as: “How likely is it that this intervention will outperform alternatives at scale?” “If the initiative works for cohort A, how likely is it to succeed for cohort B?” and “How can the initiative be improved?”
This direct approach contrasts with the indirect, $ p $
-value-driven methods of traditional RCT evaluations, which offer a binary “yes/no” outcome based on rejecting the null hypothesis that the initiative does not work. While useful in some contexts—such as large-scale trials with homogeneous participants—this binary approach has been increasingly criticized for being misleading, as noted by the American Statistical Association (Wasserstein and Lazar, Reference Wasserstein and Lazar2016).
$ p $
-value-driven methods of traditional RCT evaluations, which offer a binary “yes/no” outcome based on rejecting the null hypothesis that the initiative does not work. While useful in some contexts—such as large-scale trials with homogeneous participants—this binary approach has been increasingly criticized for being misleading, as noted by the American Statistical Association (Wasserstein and Lazar, Reference Wasserstein and Lazar2016).
2.1. Core elements of BATs
BATs provide a flexible yet rigorous mathematical framework to assess the likelihood that an initiative will achieve the desired impact when applied to a specific cohort or context, or scaled up to the target population. The framework begins by quantifying the decision-makers’ or stakeholders’ beliefs about the effectiveness of the initiative and then uses trial data to update these beliefs.
To quantify beliefs about the effect of an intervention (for each relevant cohort and context), the Bayesian framework assumes each intervention has a “true” underlying effectiveness level. This true level is unknown and unobserved but linked to observable outcomes through a probabilistic logic modelFootnote 1. For instance, the underlying effect of tutoring might be learning gains, while the observable outcome is assessment score improvement. The logic model connects tutoring hours to learning outcomes and these outcomes to observed scores, encapsulating the theory of change (Weiss, Reference Weiss1997) mathematically.
When an initiative is deployed across a large, representative sample, the outcomes should provide a close approximation of its true underlying effect. However, before such large-scale implementation, our understanding of the initiative’s true effect is limited, and a wide range of potential true underlying effects remains plausible based on prior knowledge. For example, when designing a tutoring program, prior knowledge–such as evaluations of similar programs, expert insights, or teacher experience—can suggest a range of potential effects.
The BATs framework leverages the fact that, with limited information, a wide range of possibilities exists for the initiative’s “true” effect. Mathematically, BATs assign probabilities to each possible “true” effect. When knowledge is limited, low probabilities are assigned across a wide range of possible values—similar to a flat, wide bell curve. At this stage, the likelihood of a positive impact might be 50%, reflecting the uncertainty. As the trial generates data, the range of possibilities narrows, and confidence in certain outcomes increases.
Decision-makers can choose a threshold probability of success before scaling up their initiatives. This threshold may factor in alternative resource use, cost–benefit analysis, and potential harm. The BATs decision-theoretic setup provides a structured way to evaluate these considerations by assigning utilities to outcomes, which are the result of an action.
The BATs framework supports adaptive experimentation, optimizing intervention characteristics for efficiency and participant benefit. For example, it can guide the search for the optimal tutoring hours (numerical example in Section 4), assign initiatives to cohorts likely to benefit the most, and discontinue ineffective or harmful initiatives based on accumulating evidence.
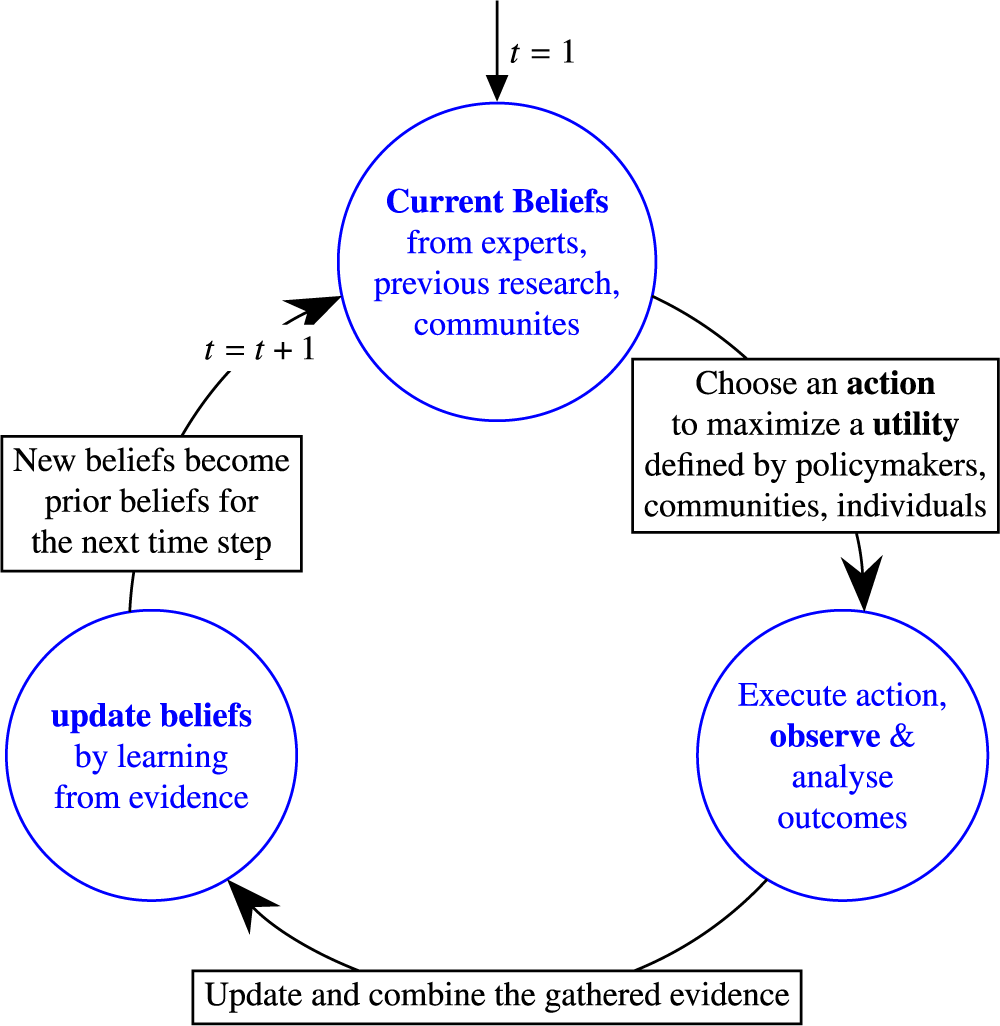
2.2. The BAT learning loop and basic mathematical notation
Figure 1 illustrates a typical BAT process, while Figure 2 in Section 4 formalizes the reasoning behind it.
Bayesian adaptive trials in a decision-theoretic framework.
Formal presentation of the Bayesian adaptive trials process as explained in Figure 1. The quantity $ U\left({a}_t|{\mathcal{D}}_{<t}\right) $
, is the expected utility of executing action,
$ U\left({a}_t|{\mathcal{D}}_{<t}\right) $
, is the expected utility of executing action, $ {a}_t\in \mathcal{A} $
, given data
$ {a}_t\in \mathcal{A} $
, given data $ {\mathcal{D}}_{<t}=\left(\left({a}_1,{y}_1\right),\dots \left({a}_{t-1},{y}_{t-1}\right)\right) $
, where the expectation is with respect to the joint distribution
$ {\mathcal{D}}_{<t}=\left(\left({a}_1,{y}_1\right),\dots \left({a}_{t-1},{y}_{t-1}\right)\right) $
, where the expectation is with respect to the joint distribution $ p\left(\boldsymbol{\theta}, {y}_t|{a}_t,{\mathcal{D}}_{<t}\right)=p\left(\boldsymbol{\theta} |{\mathcal{D}}_{<t}\right)p\left({y}_t|\boldsymbol{\theta}, {a}_t\right) $
.
$ p\left(\boldsymbol{\theta}, {y}_t|{a}_t,{\mathcal{D}}_{<t}\right)=p\left(\boldsymbol{\theta} |{\mathcal{D}}_{<t}\right)p\left({y}_t|\boldsymbol{\theta}, {a}_t\right) $
.
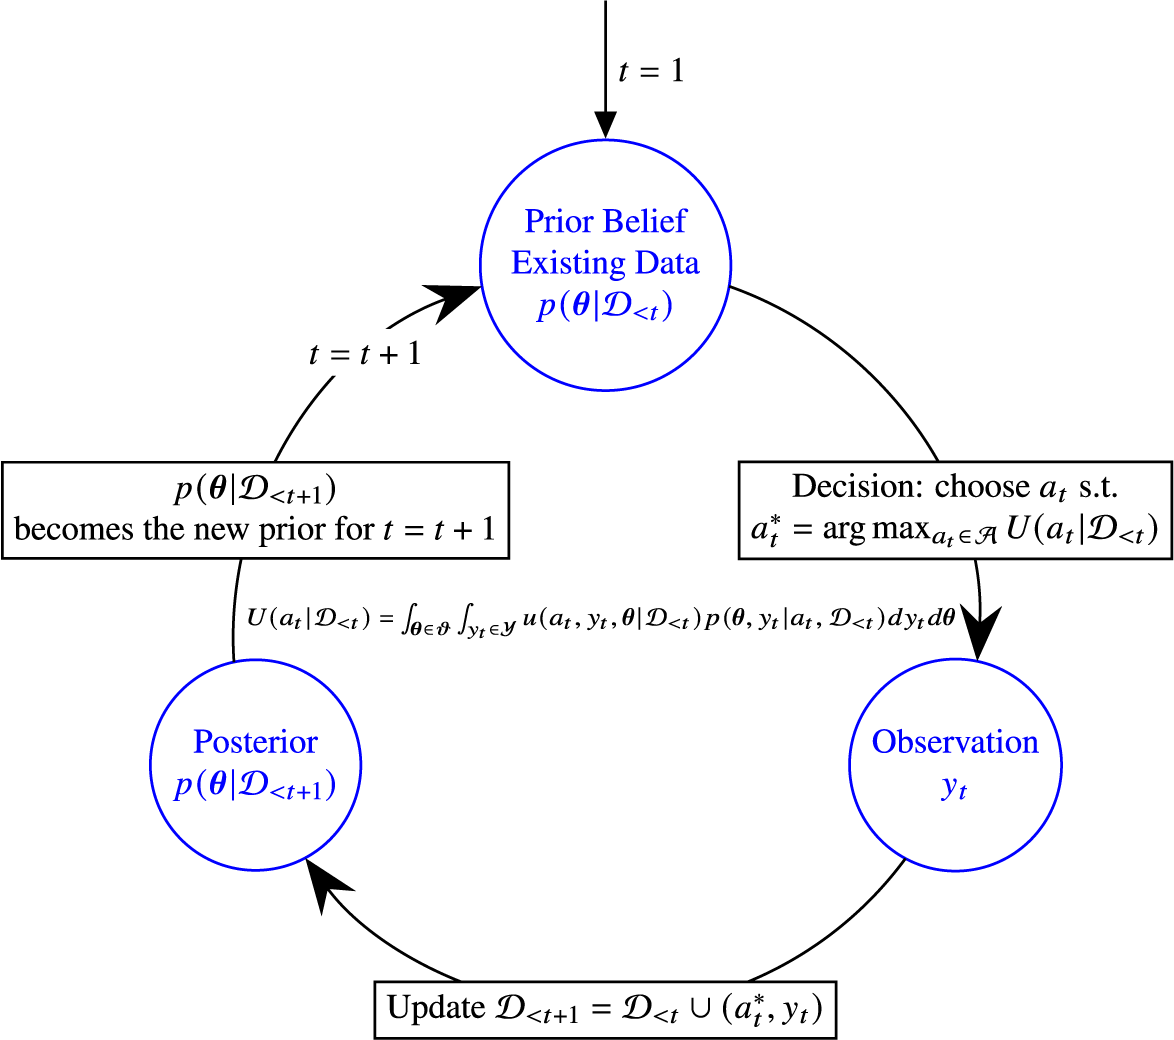
At the outset, $ t=1 $
, the decision-maker holds initial beliefs about the initiative’s true underlying impact. In high-level mathematical terms, we represent the true effect as
$ t=1 $
, the decision-maker holds initial beliefs about the initiative’s true underlying impact. In high-level mathematical terms, we represent the true effect as $ \theta $
, and the beliefs are summarized by the probability distribution
$ \theta $
, and the beliefs are summarized by the probability distribution $ p\left(\theta \right) $
. This prior distribution reflects prior knowledge, which might stem from past studies, expert opinions, or the experience of community members and on-the-ground staff. Decision-makers are free to select this prior. They may opt for an uninformative or objective prior, disregarding existing knowledge (there is a substantial literature on how to construct such priors, see Berger et al. (Reference Berger, Bernardo and Sun2015)), or incorporate expert opinion using techniques like prior elicitation, as discussed in Falconer et al. (Reference Falconer, Frank, Polaschek and Joshi2022).
$ p\left(\theta \right) $
. This prior distribution reflects prior knowledge, which might stem from past studies, expert opinions, or the experience of community members and on-the-ground staff. Decision-makers are free to select this prior. They may opt for an uninformative or objective prior, disregarding existing knowledge (there is a substantial literature on how to construct such priors, see Berger et al. (Reference Berger, Bernardo and Sun2015)), or incorporate expert opinion using techniques like prior elicitation, as discussed in Falconer et al. (Reference Falconer, Frank, Polaschek and Joshi2022).
The prior serves as a mechanism for incorporating external information, opinions, or perspectives into the initiative in a structured, transparent way. Although the choice of prior is subjective, it is explicitly defined, requiring decision-makers to justify their choices and enabling sensitivity analysis on the inferences drawn from this choice.
Next, an action $ a $
is chosen—for example, determining the number of after-school tutoring hours per month that maximizes the value of expected outcomes—the utility of these outcomes.Footnote 2 As a result of this action, new data on student performance are observed, and the belief about the effect of tutoring on student performance,
$ a $
is chosen—for example, determining the number of after-school tutoring hours per month that maximizes the value of expected outcomes—the utility of these outcomes.Footnote 2 As a result of this action, new data on student performance are observed, and the belief about the effect of tutoring on student performance, $ \theta $
, is updated. This update connects the observed data, denoted by
$ \theta $
, is updated. This update connects the observed data, denoted by $ y $
, to the underlying effect
$ y $
, to the underlying effect $ \theta $
via the logic model, represented by the likelihood function,
$ \theta $
via the logic model, represented by the likelihood function, $ p\left(y|\theta \right) $
. The updated belief, or posterior distribution
$ p\left(y|\theta \right) $
. The updated belief, or posterior distribution $ p\left(\theta |y\right) $
, which quantifies the uncertainty about the true effect
$ p\left(\theta |y\right) $
, which quantifies the uncertainty about the true effect $ \theta $
given the data
$ \theta $
given the data $ y $
—is calculated using the formula
$ y $
—is calculated using the formula $ p\left(\theta |y\right)\hskip0.35em \propto \hskip0.35em p\left(y|\theta \right)p\left(\theta \right) $
.Footnote 3
$ p\left(\theta |y\right)\hskip0.35em \propto \hskip0.35em p\left(y|\theta \right)p\left(\theta \right) $
.Footnote 3
This new posterior belief becomes the prior for the next time step, allowing decision-makers to continuously learn as more data emerge. This iterative process of updating beliefs based on new evidence is what gives BATs their rigor and adaptability.
The initiative can cease based on a predefined criterion, such as when the cost of the next action outweighs the expected benefit. In the case of a tutoring program, the stopping rule might be when the expected benefit falls below that of an alternative intervention.
Some view the need to specify utilities, priors, and likelihood functions to be a drawback of BATs, but we argue the opposite. BATs enforce decision-making discipline by explicitly making the assumptions that are often implicit in traditional evaluations. Specifying utilities may surface critical value conflicts and multiple social goals (Parkhurst, Reference Parkhurst2016). Specifying priors encourages thorough consideration of existing evidence, while choosing a model prompts careful evaluation of the logic model and theory of change. This process also helps identify critical unknowns in the logic model, methods for testing them, and their impact on the likelihood of successfully scaling up a pilot or initiative.
3. BATs for social policy impact evaluation
Impact evaluations are a crucial tool in social policy—used by social sector organizations, government bodies, foundations, and other stakeholders to assess and improve the quality, efficiency, and effectiveness of policies and initiatives (Ravallion, Reference Ravallion2007). They play a significant role in the broader context of evidence-based policymaking, which is essential for ensuring transparency and productivity improvements through learning feedback loops (Pawson et al., Reference Pawson and Tilley2004; Gertler et al., Reference Gertler, Martinez, Premand, Rawlings and Vermeersch2016).
The prima facie role of impact evaluations is to help determine whether changes in outcomes are due to specific initiatives, or policies, by establishing a causal link between the initiative or policy and the intended outcomes. However, if impact evaluations are to usefully inform social policy they need to be embedded in a broader evidence system that integrates all sources of valuable information to support decision-makers at multiple decision points. Gugerty and Karlan (Reference Gugerty and Karlan2018a) and Gertler et al. (Reference Gertler, Martinez, Premand, Rawlings and Vermeersch2016) advocate for the development of right-fit evidence systems, and the structure of BATs and their decision-theoretic origins make them excellent candidates for such systems.
BATs, like RCTs, deliver rigorous impact evaluations, but they have the advantages that RCTs lack—(1) alignment with decision-making; (2) closer alignment with ethical principles; (3) cost and data efficiency; (4) a path toward personalization of supports and services; and (5) a path toward validating theories of change. These advantages, discussed below, enable BATs to readily expand to form a broader system of continuous organizational learning (Sections 2 and 5).
3.1. Alignment with decision-making
Decision-makers in social policy face a range of decisions, such as discontinuing inefficient initiatives, expanding successful ones, trialing promising innovations, adjusting the initiative’s parameters, and choosing combinations of different options (Gertler et al., Reference Gertler, Martinez, Premand, Rawlings and Vermeersch2016; Gugerty and Karlan, Reference Gugerty and Karlan2018a; Gugerty and Karlan, Reference Gugerty and Karlan2018b; Mitchell and Calabrese, Reference Mitchell and Calabrese2020).
Traditional impact evaluation methodologies and evidence systems meet these needs partially but leave significant gaps. For instance, consider the need for rigorous direct comparisons between offering an after-hours, in-person tutoring program versus an online learning course to address learning loss. As discussed in Section 2, RCTs famously test the $ p $
-value of an initiative’s effect. The
$ p $
-value of an initiative’s effect. The $ p $
-value framework does not quantify the probability that an in-person tutor provides better student outcomes than an online learning course. Indeed, the
$ p $
-value framework does not quantify the probability that an in-person tutor provides better student outcomes than an online learning course. Indeed, the $ p $
-value framework never provides the probability that a hypothesis is true—a quantity that is essential for any cost–benefit analysis of different initiatives between which a decision-maker needs to choose (Lammers et al., Reference Lammers, Richman, Holcomb and Jansen2023; Berry et al., Reference Berry, Carlin, Lee and Muller2010).
$ p $
-value framework never provides the probability that a hypothesis is true—a quantity that is essential for any cost–benefit analysis of different initiatives between which a decision-maker needs to choose (Lammers et al., Reference Lammers, Richman, Holcomb and Jansen2023; Berry et al., Reference Berry, Carlin, Lee and Muller2010).
In contrast, BATs decision-theoretic framework provides this probability, which then can be used in decision support systems to compare, for example, the expected benefits and expected costs of one initiative over another. Furthermore, by providing probability distributions over hypotheses the BATs framework also quantifies the uncertainty surrounding any decision—an essential component in comparing the risk associated with different policy options.
More generally, traditional impact evaluation techniques are rigorous in regards to only one component of the decision-making or policy lifecycle—the post-design but pre rollout to the target population component (Gugerty and Karlan, Reference Gugerty and Karlan2018b). Outside this phase, organizations may perform ad hoc analyses to evaluate the effectiveness of the initiative post rollout but these ad hoc approaches dilute the power of the rigorous methods. This manifests in external validity issues (Williams, Reference Williams2020) and failures in scaling up successful pilots (see, e.g., Epstein and Klerman, Reference Epstein and Klerman2012, and references therein).
The decision-theoretic BATs framework provides a flexible scaffold (Bothwell et al., Reference Bothwell, Avorn, Khan and Kesselheim2018) that extends the rigor of the formal trial through the entire life cycle of an initiative. Unlike traditional impact evaluations, BATs can be advantageous at nearly any point: in the early design phase when features are selected, in the trial phase where effectiveness for different cohorts is evaluated, and in the scaling phase where the most effective scaling pathway is designed—without loss of rigor or information at handoffs.
BATs enable direct comparisons between initiatives (see also Section 3.3), testing multiple intervention combinations, and identifying the most responsive cohorts (Berry et al., Reference Berry, Carlin, Lee and Muller2010; Juszczak et al., Reference Juszczak, Altman, Hopewell and Schulz2019). For example, does an in-person after-hours tutor lead to better student’s outcomes for only a subsection of the population, those under 12 years of age, say, while an online learning course leads to better outcomes for older students? This capability is crucial given the rapid growth in candidate interventions (Leigh, Reference Leigh2009) and is particularly relevant in social policy, where decision-makers need to choose between combinations of services and supports that are delivered to communities (Pawson et al., Reference Pawson, Greenhalgh, Harvey and Walshe2004a).
3.2. Ethics and beneficence
BATs designs offer several advantages and, on balance, ameliorate ethical concerns surrounding traditional fixed trial designs (Bédécarrats et al., Reference Bédécarrats, Guérin and Roubaud2020; Deaton and Cartwright, Reference Deaton and Cartwright2018; Legocki et al., Reference Legocki, Meurer, Frederiksen, Lewis, Durkalski, Berry, Barsan and Fetters2015), particularly when applied to social policy contexts. BATs approaches lead to faster results; they balance the information gain for future cohorts with benefits to current participants; they can include prior information in an explicit and principled fashion; and they provide clear formal channels for community input via utility formation and initiative design.
BATs’ efficiency results in smaller required sample sizes and its adaptive design offers participants a higher chance of receiving the most effective support or service, exposing fewer participants to ineffective initiatives. For example, if during a BAT it was found that in-person tutoring was more effective than an online course for children under 12, then the design of the initiative can be adapted so that participants under the age of 12 years are more likely to receive an in-person tutor than an online course, by making the probability that a participant is assigned to in-person tutoring versus an online course to depend upon the participant’s age. The extent to which this is done is controlled by the relative weights one attaches to the utility that arises from participant benefit versus that which arises from information gain.
In the context of social policy, commentators observe that although the ethical justification for randomization in RCTs is that the outcome is genuinely unknown, this statement is often misleading, Lilford (Reference Lilford2003). To say that an outcome is genuinely unknown is not the same as saying that all possible outcomes are equally likely (Lilford, Reference Lilford2003). In addition, when existing research strongly indicates likely positive effects, a randomized design that ignores this evidence effectively deprives control group participants of services from which they are likely to benefit. The BATs framework, by explicitly constructing and incorporating prior information into the initiative, is a principled and transparent mechanism to ensure that all participants are maximally informed.
Finally, and importantly, in the social policy context, the BAT framework promotes the close involvement of the community and on-the-ground staff in the design of the initiative—through explicit elicitation of priors and theories of change. The co-design of the initiative with the community is critical for meeting the requirement of beneficence (Deaton, Reference Deaton2020).
3.3. Cost and data efficiency
Government agencies and NGOs operate under significant budgetary constraints, making cost efficiency paramount (Thomas and Chindarkar, Reference Thomas and Chindarkar2019). The cost efficiency of impact evaluations themselves—the ability to extract the most rigorous information about the causal impact of an initiative at the lowest cost—is a crucial requirement for a modern evaluation system.
The decision-theoretic BAT is efficient by design. Consider the learning loss initiative in an RCT setting, where the goal is to roll it out nationally if a pilot study can demonstrate that after-hours, in-person tutoring of 6 hours per month results in an average improvement in student’s outcomes of at least 10%. Initially the impact of tutoring on student outcomes is assumed to be completely unknown. The pilot study is run and finds that the average improvement in student’s outcomes is 10% with a 95% confidence interval of (7%–13%), and so fails to establish statistical significance of a 10% improvement in average student outcomes. As a result, the initiative is not adopted and the valuable information the pilot delivered is not used. In contract, in a BAT setting, the pilot study is just a first step and has delivered a significant amount of information—a state of no prior knowledge of the initiative’s impact has now been updated to one where we are 95% confident that the average increase in student outcomes is between 7% and 13%. Indeed, the decision-maker now assesses the probability of the initiative to deliver at least a 10% improvement on average, to be approximately 50% (assuming a symmetric distribution about the true average effect). They can then decide whether this 50% probability is sufficient to roll out the initiative nationally, or whether to run another pilot to reduce the uncertainty about this quantity, or whether to abandon the idea—the choice between these options will be decided on the basis of the decision-maker’s utility.
3.4. Contextualization and personalization
One of the critical problems in evidence-based policymaking is how to best apply the evidence from the growing number of rigorous impact evaluations worldwide in the local context (Joyce and Cartwright, Reference Joyce and Cartwright2020; Williams, Reference Williams2020; Leviton and Trujillo, Reference Leviton and Trujillo2017). When robust transportable evidence from other jurisdictions is available, local decision-makers must determine the most beneficial strategies for their specific constituencies: identifying who benefits most, the best combination of initiatives for each sub-group, and defining these relevant sub-groups. BATs, through the construction of priors and logic models, offer a structured method for addressing these critical questions.
Governments can further improve the effectiveness and efficiency of social programs by adapting policies to local contexts and the needs of individuals, considering the local socioeconomic and cultural context that affects the implementation and outcomes of policies (Horner et al., Reference Horner, Blitz and Ross2014; Van Kerkhoff and Lebel, Reference Van Kerkhoff and Lebel2015). Personalization, viewed here as tailoring services and supports to the unique needs and circumstances of individuals (Harlock, Reference Harlock2010), can improve the utility of social programs (Duffy, Reference Duffy2010). For example, personalizing the number of tutoring hours per week for each student may improve outcomes if the optimal number of hours depends on the student’s individual responsiveness to tutoring and the effectiveness of tutoring at that student’s school (due to, e.g., availability of space allocated to tutoring). Bayesian methods excel at personalization and contextualization (Rendle et al., Reference Rendle, Freudenthaler, Gantner and Schmidt-Thieme2012) and are increasingly popular in the private sector (Grewal et al., Reference Grewal, Ailawadi, Gauri, Hall, Kopalle and Robertson2011; Schrage, Reference Schrage2021; Mostaghel et al., Reference Mostaghel, Oghazi, Parida and Sohrabpour2022).
3.5. Validating theories of change
A feature of BATs that proponents of RCTs often view as a weakness is that Bayesian inference depends on a logic model, as discussed in Section 2—effectively a quantified theory of change (Weiss, Reference Weiss1997)—whereas RCTs rely solely on the assumption of independence of individual observations. For social policy applications, the ability of the Bayesian framework to incorporate a theory of change is a significant benefit. It enables not only rigorous sharing of information across implementations, e.g., pilots of the same initiative across different locations or cohorts, but also, given enough data, the evaluation and validation of competing theories of change. In complex settings, such as social policy and environmental conservation, a number of theories of change may be plausible (Rogers and Weiss, Reference Rogers and Weiss2007). The BAT framework enables the incorporation of a mixture of competing theories of change for inference. As informative data are collected, the Bayesian framework will point to some theories as being more likely given the data than others. It can also accommodate mechanism experiments, such as those of Ludwig et al. (Reference Ludwig, Kling and Mullainathan2011). That is, in addition to the question “Does it work?” answered by classic RCTs, the use of the Bayesian framework can help us answer the question “Why does it work?” and enable us to discover high-value initiatives to test (Rogers, Reference Rogers, Stufflebeam, Madaus and Kellaghan2000).
4. Numerical example: Bayesian adaptive learning of the relation between student performance and external tutoring hours
In this section, we present the technical details and provide a simulated example to illustrate the data efficiency of BATs.
We revisit the practical scenario introduced in Section 2, where education policymakers design a tutoring program to address post-pandemic learning loss. A key decision involves determining the appropriate tutoring intensity—the number of tutoring hours provided to students each month. This example offers a simple demonstration of how the BAT framework operates in practice and highlights some of its key advantages.
The chosen example is simple for clarity; however, the BAT framework can handle much more complex scenarios. For instance, if the goal is to understand the causal pathways through which children attend and succeed at school, accounting for time and other factors, the utilities and likelihood functions become more intricate (as in Zhu et al. Reference Zhu, Marchant, Morris, Baur, Simpson and Cripps2023), but the underlying methodology remains the same.
4.1. Formal setting
We define the set of all possible actions to be tested or compared in the course of the BAT—such as interventions, services, or supports offered to participants in the cohorts and contexts of interest (including the control intervention, if one is used)—to be $ \mathcal{A}:= \left\{{\mathfrak{a}}_1,\dots, {\mathfrak{a}}_J\right\} $
. In our example, the set of actions considered by policymakers are after-school tutoring programs that differ only in the hours of tutoring offered per month. In this example, it is convenient to assume that the actions are sorted according to their natural order (e.g., they are real values).Footnote 4
$ \mathcal{A}:= \left\{{\mathfrak{a}}_1,\dots, {\mathfrak{a}}_J\right\} $
. In our example, the set of actions considered by policymakers are after-school tutoring programs that differ only in the hours of tutoring offered per month. In this example, it is convenient to assume that the actions are sorted according to their natural order (e.g., they are real values).Footnote 4
For each action, $ {\mathfrak{a}}_j\in \mathcal{A} $
, we associate an unknown quantity,
$ {\mathfrak{a}}_j\in \mathcal{A} $
, we associate an unknown quantity, $ {\theta}_j\hskip0.35em := \hskip0.35em f\left({\mathfrak{a}}_j\right) $
, known as the model response, representing the true underlying effect of the action. For each action, we also have an observation—a random variable
$ {\theta}_j\hskip0.35em := \hskip0.35em f\left({\mathfrak{a}}_j\right) $
, known as the model response, representing the true underlying effect of the action. For each action, we also have an observation—a random variable $ {Y}_j $
, with a distribution,
$ {Y}_j $
, with a distribution, $ p\left({Y}_j|{\mathfrak{a}}_j,{\theta}_j\right) $
, that depends on the corresponding action,
$ p\left({Y}_j|{\mathfrak{a}}_j,{\theta}_j\right) $
, that depends on the corresponding action, $ {\mathfrak{a}}_j $
, and its model response,
$ {\mathfrak{a}}_j $
, and its model response, $ {\theta}_j $
. The model response, in this case, denotes the unobservable “true” students’ learning gain, and the variable
$ {\theta}_j $
. The model response, in this case, denotes the unobservable “true” students’ learning gain, and the variable $ {Y}_j $
denotes the observable student performance
$ {Y}_j $
denotes the observable student performance $ y $
, for example, on assessments.
$ y $
, for example, on assessments.
The vector of model responses to all possible actions, $ \boldsymbol{\theta} \hskip0.35em := \hskip0.35em \left({\theta}_1,\dots, {\theta}_J\right) $
, is referred to as the model parameter vector (or simply, parameter). It models the noiseless relation between the actions and their subsequent model responses while the observation distributions,
$ \boldsymbol{\theta} \hskip0.35em := \hskip0.35em \left({\theta}_1,\dots, {\theta}_J\right) $
, is referred to as the model parameter vector (or simply, parameter). It models the noiseless relation between the actions and their subsequent model responses while the observation distributions, $ p\left({Y}_j|{\mathfrak{a}}_j,{\theta}_j\right) $
, typically represent the indirect and noisy version of each response.
$ p\left({Y}_j|{\mathfrak{a}}_j,{\theta}_j\right) $
, typically represent the indirect and noisy version of each response.
We define $ \mathbf{a}:= \left({a}_1,\dots, {a}_T\right) $
, to be the sequence of actions taken in the course of the BAT to achieve a goal defined by a social policy, such as balancing benefits to BAT participants, maximally learning from data, and reducing trial costs. Such a goal can be formalized by defining a utility function to be maximized. Each action,
$ \mathbf{a}:= \left({a}_1,\dots, {a}_T\right) $
, to be the sequence of actions taken in the course of the BAT to achieve a goal defined by a social policy, such as balancing benefits to BAT participants, maximally learning from data, and reducing trial costs. Such a goal can be formalized by defining a utility function to be maximized. Each action, $ {a}_t $
is chosen from the set of possible actions (i.e.,
$ {a}_t $
is chosen from the set of possible actions (i.e., $ {a}_t\in \mathcal{A} $
) and is carried out at time steps
$ {a}_t\in \mathcal{A} $
) and is carried out at time steps $ t=1,\dots, T $
.
$ t=1,\dots, T $
.
After executing each action $ {a}_t $
, we receive an observation,
$ {a}_t $
, we receive an observation, $ {y}_t $
drawn from the corresponding observation distribution. That is, if at time step
$ {y}_t $
drawn from the corresponding observation distribution. That is, if at time step $ t $
, an action
$ t $
, an action $ {a}_t={\mathfrak{a}}_j $
is taken (where
$ {a}_t={\mathfrak{a}}_j $
is taken (where $ j\in \left\{1,\dots, J\right\} $
) then a value
$ j\in \left\{1,\dots, J\right\} $
) then a value $ {y}_t\sim p\left({Y}_j|{\mathfrak{a}}_j,{\theta}_j\right) $
will be observed.
$ {y}_t\sim p\left({Y}_j|{\mathfrak{a}}_j,{\theta}_j\right) $
will be observed.
Let $ u\left({a}_t,{y}_t,\boldsymbol{\theta} |{\mathcal{D}}_{<t}\right) $
denote the utility of taking the action,
$ u\left({a}_t,{y}_t,\boldsymbol{\theta} |{\mathcal{D}}_{<t}\right) $
denote the utility of taking the action, $ {a}_t $
, and then observing a value,
$ {a}_t $
, and then observing a value, $ {y}_t $
, in a system that is modeled by a particular parameter,
$ {y}_t $
, in a system that is modeled by a particular parameter, $ \boldsymbol{\theta} $
, conditioned on the existing data,
$ \boldsymbol{\theta} $
, conditioned on the existing data, $ \mathcal{D} $
, that is, the collection of all previous actions and their subsequent observations,
$ \mathcal{D} $
, that is, the collection of all previous actions and their subsequent observations, $ {\mathcal{D}}_{<t}:= \left(\left({a}_1,{y}_1\right),\dots \left({a}_{t-1},{y}_{t-1}\right)\right) $
. There is no restriction on the choice of this utility function and it will be defined per social policy.
$ {\mathcal{D}}_{<t}:= \left(\left({a}_1,{y}_1\right),\dots \left({a}_{t-1},{y}_{t-1}\right)\right) $
. There is no restriction on the choice of this utility function and it will be defined per social policy.
By marginalizing the unknown values (i.e., the model parameter, $ \boldsymbol{\theta} $
, and the future observation
$ \boldsymbol{\theta} $
, and the future observation $ {y}_t $
), the utility of taking the action
$ {y}_t $
), the utility of taking the action $ {a}_t $
is:
$ {a}_t $
is:
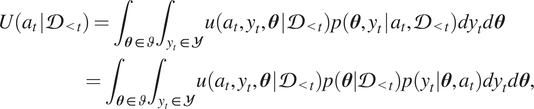 $$ {\displaystyle \begin{array}{l}U\left({a}_t\hskip0.1em |\hskip0.1em {\mathcal{D}}_{<t}\right)={\int}_{\boldsymbol{\theta} \in \vartheta }{\int}_{y_t\in \mathcal{Y}}u\left({a}_t,{y}_t,\boldsymbol{\theta} \hskip0.1em |\hskip0.1em {\mathcal{D}}_{<t}\right)p\left(\boldsymbol{\theta}, {y}_t\hskip0.1em |\hskip0.1em {a}_t,{\mathcal{D}}_{<t}\right){dy}_td\boldsymbol{\theta} \\ {}\hskip7em ={\int}_{\boldsymbol{\theta} \in \vartheta }{\int}_{y_t\in \mathcal{Y}}u\left({a}_t,{y}_t,\boldsymbol{\theta} \hskip0.1em |\hskip0.1em {\mathcal{D}}_{<t}\right)p\left(\boldsymbol{\theta} |{\mathcal{D}}_{<t}\right)p\left({y}_t|\boldsymbol{\theta}, {a}_t\right){dy}_td\boldsymbol{\theta}, \end{array}} $$
in which, $ \vartheta $
is the space of all possible parameters,
$ \vartheta $
is the space of all possible parameters, $ \boldsymbol{\theta} $
, and
$ \boldsymbol{\theta} $
, and $ \mathcal{Y} $
is the space of all possible observations. Note that the constraints such as those presented by communities or politicians should be reflected in the utility function. The specific chosen action,
$ \mathcal{Y} $
is the space of all possible observations. Note that the constraints such as those presented by communities or politicians should be reflected in the utility function. The specific chosen action, $ {a}_t^{\ast } $
is given by
$ {a}_t^{\ast } $
is given by
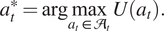 $$ {a}_t^{\ast }=\arg \underset{a_t\in {\mathcal{A}}_t}{\max}\;U\left({a}_t\right). $$
The utility function defined by Equation (1) is defined in a greedy manner, that is only based on the actions taken previously. This is a special case of a more general formula proposed by Müller et al. (Reference Müller, Berry, Grieve and Krams2006) where the utility is assigned to the entire sequence of actions, which includes both past and future actions. The greedy decision setting was chosen for computational feasibility and because it better represents the difficulties facing a decision-maker where taking actions and evaluating outcomes is time-consuming and costly.
4.2. Concrete example
We simulate a BAT to find the tutoring intensity (hours per month) that maximizes our utility function, described in Section 4.4, and show that using an adaptive trial framework substantially reduces the observation sample size required to reach a level of accuracy.
Our utility depends upon the characteristics of the unknown function $ \theta $
that maps the number of tutoring hours per month,
$ \theta $
that maps the number of tutoring hours per month, $ a $
, to the increase in students’ observed performance,
$ a $
, to the increase in students’ observed performance, $ y $
. In particular, we wish to learn the number of tutoring hours per month, which will maximize:
$ y $
. In particular, we wish to learn the number of tutoring hours per month, which will maximize:
-
(A) Expected increase in student performance.
-
(B) Expected rate of increase in student performance.
In addition, we wish to do this as efficiently as possible so that the tutoring hours must be chosen in an order that will maximally learn (reduce uncertainty) about the function $ \theta $
. These objectives are formalized as a utility function in Section 4.4.
$ \theta $
. These objectives are formalized as a utility function in Section 4.4.
Let the true learning gain, $ \theta $
, be a function of tutoring hours per month,
$ \theta $
, be a function of tutoring hours per month, $ \mathfrak{a} $
, and be in the form of the following logistic function:
$ \mathfrak{a} $
, and be in the form of the following logistic function:
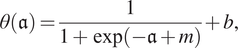 $$ \theta \left(\mathfrak{a}\right)=\frac{1}{1+\exp \left(-\mathfrak{a}+m\right)}+b, $$
with midpoint, $ m=6 $
and intercept,
$ m=6 $
and intercept, $ b=1 $
. We assume that observed student learning outcomes (such as the change in assessment results)
$ b=1 $
. We assume that observed student learning outcomes (such as the change in assessment results) $ y $
, given tutoring hours,
$ y $
, given tutoring hours, $ \mathfrak{a} $
, are a noisy signal around this true function. Specifically, we have
$ \mathfrak{a} $
, are a noisy signal around this true function. Specifically, we have
 $$ y=\theta \left(\mathfrak{a}\right)+\unicode{x025B}, \hskip2em \mathrm{where}\hskip0.24em \unicode{x025B} \sim \mathcal{N}\left(0,{\sigma}_{\unicode{x025B}}^2\right). $$
In Equation 4, $ \mathcal{N}\left(0,{\sigma}_{\unicode{x025B}}^2\right) $
denotes a normal distribution with mean
$ \mathcal{N}\left(0,{\sigma}_{\unicode{x025B}}^2\right) $
denotes a normal distribution with mean $ 0 $
and standard deviation
$ 0 $
and standard deviation $ {\sigma}_{\unicode{x025B}} $
which we set to be
$ {\sigma}_{\unicode{x025B}} $
which we set to be $ {\sigma}_{\unicode{x025B}}=0.1 $
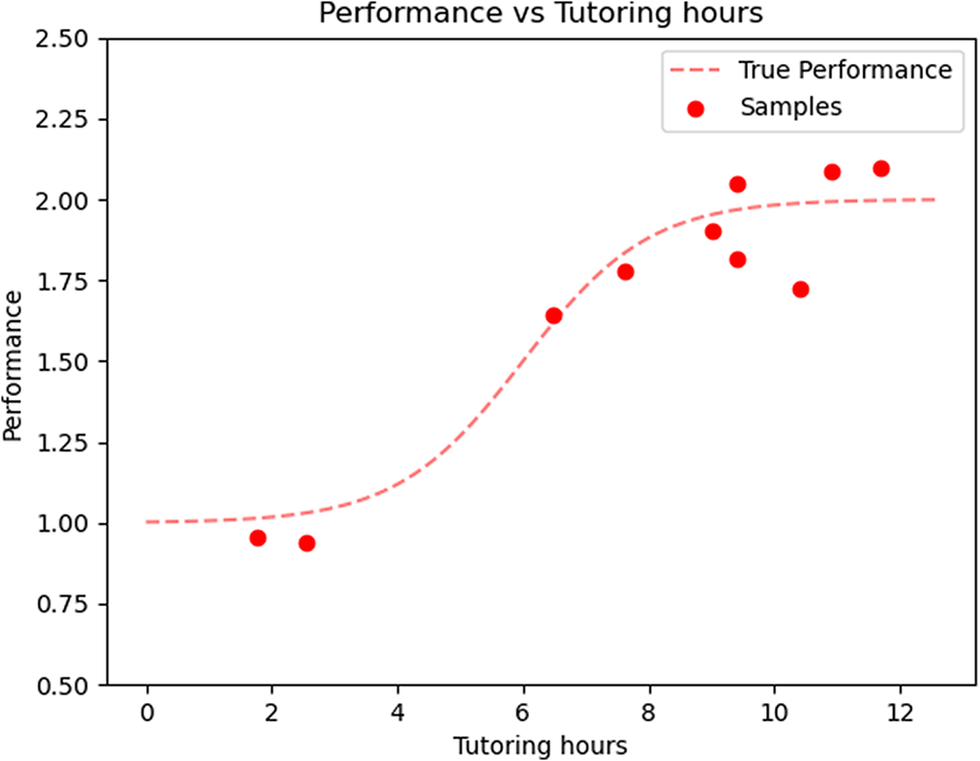
. Figure 3 plots the true performance,
$ {\sigma}_{\unicode{x025B}}=0.1 $
. Figure 3 plots the true performance, $ \theta \left(\mathfrak{a}\right) $
(dashed red line) along with 10 randomly sampled observations,
$ \theta \left(\mathfrak{a}\right) $
(dashed red line) along with 10 randomly sampled observations, $ y $
, drawn from this illustrative model.
$ y $
, drawn from this illustrative model.
Ten samples are drawn from the model defined by Equations (3) and (4), where $ m=6 $
,
$ m=6 $
, $ b=1 $
, and
$ b=1 $
, and $ {\sigma}_{\unicode{x025B}}=0.1 $
. The true performance,
$ {\sigma}_{\unicode{x025B}}=0.1 $
. The true performance, $ \theta \left(\mathfrak{a}\right) $
, is represented by the dashed line.
$ \theta \left(\mathfrak{a}\right) $
, is represented by the dashed line.
We wish to design a trial to learn the function $ \theta \left(\mathfrak{a}\right) $
, and specifically the features (A) and (B) defined above, given experimental data. In a Bayesian context, a natural estimate of this function is its posterior mean, denoted by
$ \theta \left(\mathfrak{a}\right) $
, and specifically the features (A) and (B) defined above, given experimental data. In a Bayesian context, a natural estimate of this function is its posterior mean, denoted by $ \hat{\theta} $
. To obtain this estimate, we begin by placing a prior over this function. We choose a prior with two desirable properties:
$ \hat{\theta} $
. To obtain this estimate, we begin by placing a prior over this function. We choose a prior with two desirable properties:
1. The estimate of function is relatively smooth,
2. The prior is flexible enough to admit a large range of estimated functions.
A convenient prior with these properties is a Gaussian process prior, $ \mathcal{GP} $
(Williams and Rasmussen, Reference Williams and Rasmussen2006), so that we have
$ \mathcal{GP} $
(Williams and Rasmussen, Reference Williams and Rasmussen2006), so that we have
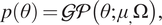 $$ p\left(\theta \right)=\mathcal{GP}\left(\theta; {\mu}_{,}\Omega \right), $$
where the mean $ \mu =0 $
and the covariance matrix,
$ \mu =0 $
and the covariance matrix, $ \Omega $
, is chosen to be a Radial basis function with length scale 2.0 (Wood, Reference Wood2013). This prior ensures smoothness but does not impose many other restrictions. For example, it does not suppose that the function is monotonic.
$ \Omega $
, is chosen to be a Radial basis function with length scale 2.0 (Wood, Reference Wood2013). This prior ensures smoothness but does not impose many other restrictions. For example, it does not suppose that the function is monotonic.
Next, we need a likelihood function that connects the observed outcomes $ y $
to
$ y $
to $ \theta \left(\mathfrak{a}\right) $
. This is given by Equation (4), so that
$ \theta \left(\mathfrak{a}\right) $
. This is given by Equation (4), so that $ y\mid \theta \left(\mathfrak{a}\right)\sim N\left(\theta \left(\mathfrak{a}\right),{\sigma}_{\unicode{x025B}}\right) $
. The task of a trial is to design an experiment that learns
$ y\mid \theta \left(\mathfrak{a}\right)\sim N\left(\theta \left(\mathfrak{a}\right),{\sigma}_{\unicode{x025B}}\right) $
. The task of a trial is to design an experiment that learns $ \theta \left(\mathfrak{a}\right) $
and its characteristics as efficiently as possible by generating data
$ \theta \left(\mathfrak{a}\right) $
and its characteristics as efficiently as possible by generating data $ y $
to update our prior belief
$ y $
to update our prior belief $ p\left(\theta \right) $
.
$ p\left(\theta \right) $
.
For practical applications, the model straightforwardly generalizes to incorporate personalization, contextualization, and continuous improvement as tutoring is offered to more participants. For example, the likelihood model can be modified to account for differences in response to tutoring across student cohorts. Alternatively, the model can incorporate and differentiate in-school versus after-school tutoring, and borrow information between the two modes. The flexible framework can handle many useful variations.
4.3. Two trials
To demonstrate the efficiency of the adaptive design, we compare its performance against a fixed-design trial using an identical sample size, $ n=12 $
.
$ n=12 $
.
4.3.1. Fixed design
In the first trial, we fix the number of tutoring hours $ \mathbf{a}=\left({a}_1,\dots, {a}_{12}\right) $
to be equally spaced between in the interval [0,12] and record the outcomes of student performance
$ \mathbf{a}=\left({a}_1,\dots, {a}_{12}\right) $
to be equally spaced between in the interval [0,12] and record the outcomes of student performance $ \mathbf{y}=\left({y}_1,\dots, {y}_{12}\right) $
, so that our data denoted by
$ \mathbf{y}=\left({y}_1,\dots, {y}_{12}\right) $
, so that our data denoted by $ \mathcal{D} $
is
$ \mathcal{D} $
is $ {\mathcal{D}}_{1:12}=\left\{\left({a}_1,{y}_1\right),\dots \Big({a}_{12},{y}_{12}\Big)\right\} $
.
$ {\mathcal{D}}_{1:12}=\left\{\left({a}_1,{y}_1\right),\dots \Big({a}_{12},{y}_{12}\Big)\right\} $
.
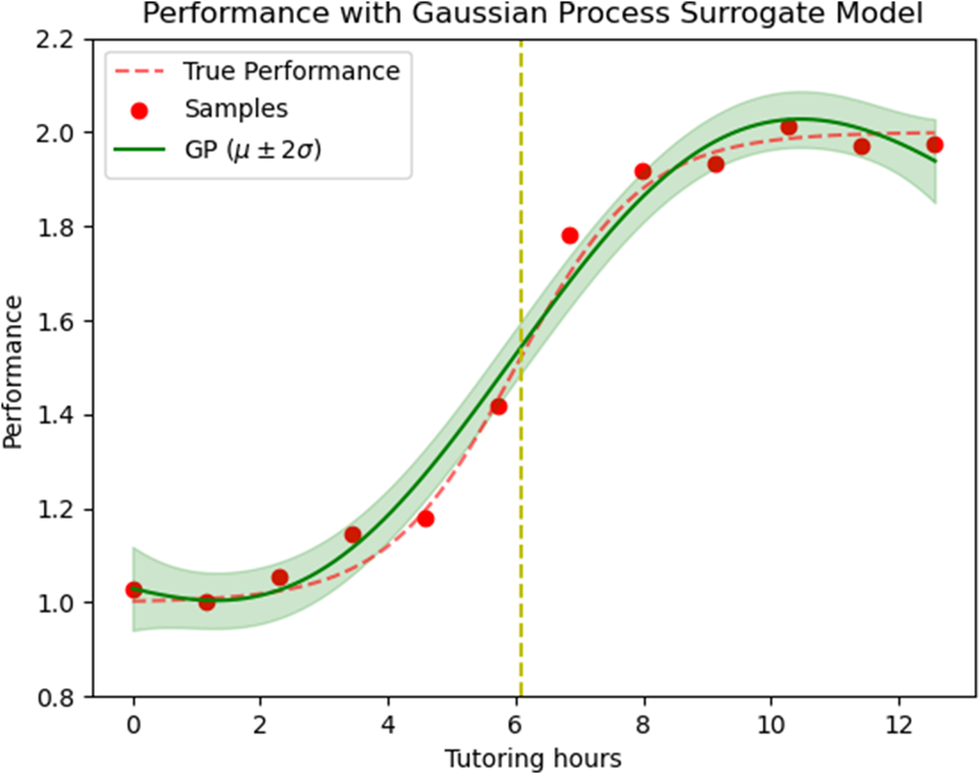
Figure 4 shows a plot of this data together with an estimate of the function $ \hat{\theta}={\mu}_{{\mathcal{D}}_{1:12}} $
(solid green line) and the true function (dotted red line) and the shaded credible intervals
$ \hat{\theta}={\mu}_{{\mathcal{D}}_{1:12}} $
(solid green line) and the true function (dotted red line) and the shaded credible intervals $ {\mu}_{{\mathcal{D}}_{1:12}}\pm 2\cdot {\sigma}_{{\mathcal{D}}_{1:12}}\left(\mathfrak{a}\right) $
Footnote 5.
$ {\mu}_{{\mathcal{D}}_{1:12}}\pm 2\cdot {\sigma}_{{\mathcal{D}}_{1:12}}\left(\mathfrak{a}\right) $
Footnote 5.
Posterior Gaussian process, $ \mathcal{GP}\left(\theta; {\mu}_{{\mathcal{D}}_{1:12}},{\Omega}_{{\mathcal{D}}_{1:12}}\right) $
for the fixed design trial, fitting the students’ learning gain,
$ \mathcal{GP}\left(\theta; {\mu}_{{\mathcal{D}}_{1:12}},{\Omega}_{{\mathcal{D}}_{1:12}}\right) $
for the fixed design trial, fitting the students’ learning gain, $ \theta $
, versus external tutoring hours (
$ \theta $
, versus external tutoring hours ( $ \mathfrak{a} $
) where the observations,
$ \mathfrak{a} $
) where the observations, $ {\mathcal{D}}_{1:12} $
, are depicted by filled circles. The red dashed line shows the true learning gain,
$ {\mathcal{D}}_{1:12} $
, are depicted by filled circles. The red dashed line shows the true learning gain, $ \theta \left(\mathfrak{a}\right) $
, and the green line and shaded 95% credible interval represent
$ \theta \left(\mathfrak{a}\right) $
, and the green line and shaded 95% credible interval represent $ {\mu}_{{\mathcal{D}}_{1:12}}\left(\mathfrak{a}\right)\pm 2\sqrt{\Omega_{{\mathcal{D}}_{1:12}}\left(\mathfrak{a},\mathfrak{a}\right)} $
. Yellow line: The optimal tutoring hours where a combination of features (A) and (B) (formalized by (8)) maximizes utility.
$ {\mu}_{{\mathcal{D}}_{1:12}}\left(\mathfrak{a}\right)\pm 2\sqrt{\Omega_{{\mathcal{D}}_{1:12}}\left(\mathfrak{a},\mathfrak{a}\right)} $
. Yellow line: The optimal tutoring hours where a combination of features (A) and (B) (formalized by (8)) maximizes utility.
4.3.2. Adaptive design
Another possible design is the following
Algorithm 1
-
1. Set $ t=1 $
.
$ t=1 $
. -
2. Randomly draw
$ {a}_t $
uniformly from the interval [0,12]. -
3. Observe
$ {y}_t $
. -
4. Set
$ t=t+1 $
. -
5. Compute
$ {\mu}_{{\mathcal{D}}_{<t}}\left(\mathfrak{a}\right) $
and
$ {\sigma}_{{\mathcal{D}}_{<t}}\left(\mathfrak{a}\right) $
and the utility function
$ {U}_3\left(\mathfrak{a}|{\mathcal{D}}_{<t}\right) $
, given by Equation (6). -
6. Find
$ {\mathfrak{a}}^{\ast }=\arg {\max}_x\;{U}_3\left(\mathfrak{a}|{\mathcal{D}}_{<t}\right) $
. -
7. Set
$ {a}_t={\mathfrak{a}}^{\ast } $
. -
8. Repeat Steps 3–7 until
$ t=12 $
.


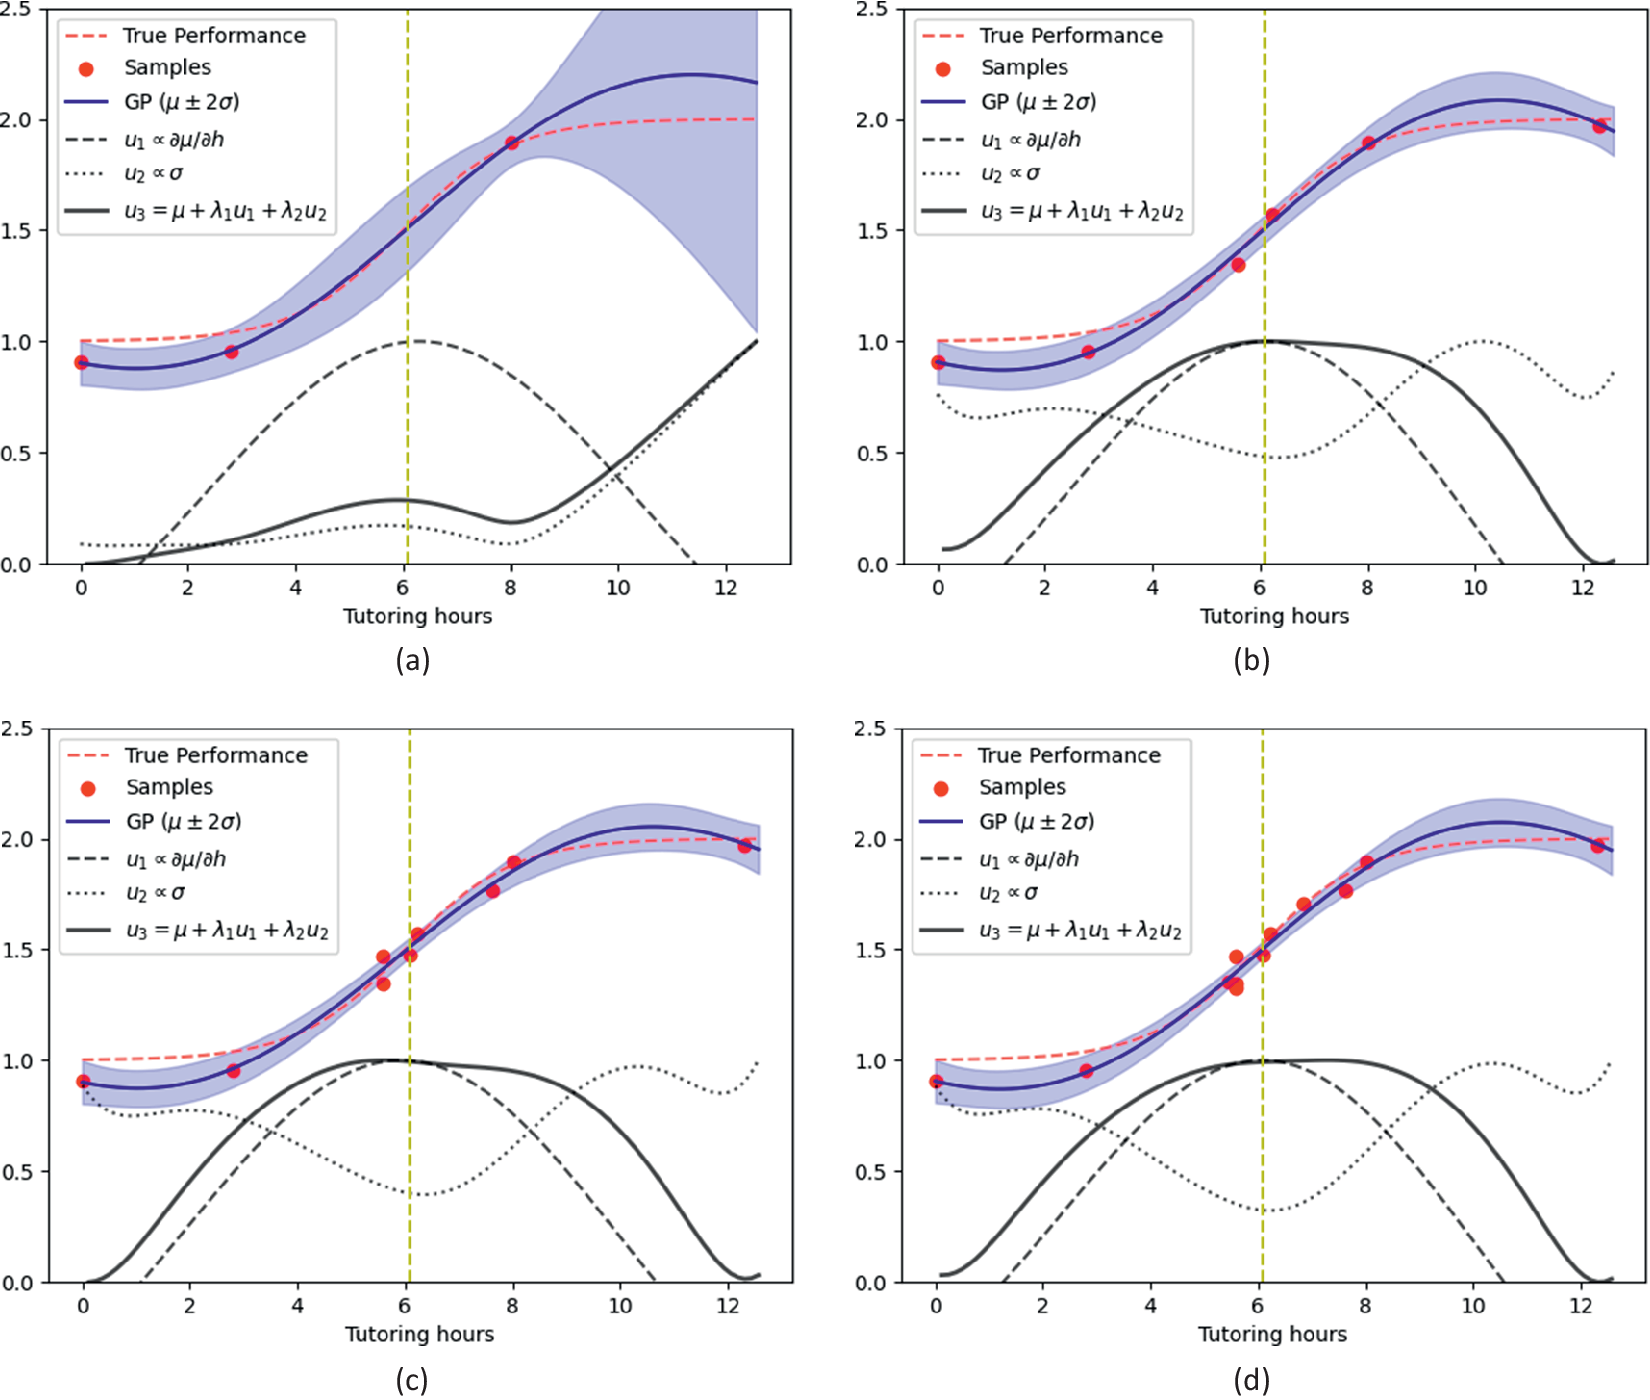
Figure 5, panels $ (a) $
,
$ (a) $
, $ (b) $
,
$ (b) $
, $ (c) $
, and
$ (c) $
, and $ (d) $
, shows the estimates of
$ (d) $
, shows the estimates of $ {\mu}_{{\mathcal{D}}_{<t}}\left(\mathfrak{a}\right) $
(blue solid lines) and corresponding 95% credible intervals (blue shaded area) after applying Algorithm 1 for
$ {\mu}_{{\mathcal{D}}_{<t}}\left(\mathfrak{a}\right) $
(blue solid lines) and corresponding 95% credible intervals (blue shaded area) after applying Algorithm 1 for $ t\in \left\{\mathrm{3,6,9,12}\right\} $
, respectively. As before, the true performance,
$ t\in \left\{\mathrm{3,6,9,12}\right\} $
, respectively. As before, the true performance, $ \theta \left(\mathfrak{a}\right) $
(that should be approximated by GP) is plotted by the red dashed line; the filled circles represent the existing data,
$ \theta \left(\mathfrak{a}\right) $
(that should be approximated by GP) is plotted by the red dashed line; the filled circles represent the existing data, $ {\mathcal{D}}_{<t} $
.
$ {\mathcal{D}}_{<t} $
.
Bayesian adaptive trial (BAT) applied to model (4). Red dashed line: The true performance, $ \theta \left(\mathfrak{a}\right) $
, to be approximated (see Equation (3)). Circles,
$ \theta \left(\mathfrak{a}\right) $
, to be approximated (see Equation (3)). Circles, $ {\mathcal{D}}_{<t} $
represents data points; blue line represents GP’s mean,
$ {\mathcal{D}}_{<t} $
represents data points; blue line represents GP’s mean, $ {\mu}_{{\mathcal{D}}_{<t}}\left(\mathfrak{a}\right) $
; shaded blue region represents 95% credible interval around the GP’s mean; dashed black line represents the slope of GP’s mean, (up to a proportionality constant)
$ {\mu}_{{\mathcal{D}}_{<t}}\left(\mathfrak{a}\right) $
; shaded blue region represents 95% credible interval around the GP’s mean; dashed black line represents the slope of GP’s mean, (up to a proportionality constant) $ \frac{\partial {\mu}_{{\mathcal{D}}_{<t}}\left(\mathfrak{a}\right)}{\partial \mathfrak{a}} $
; dotted line represents the standard deviation of the GP (up to a proportionality constant)
$ \frac{\partial {\mu}_{{\mathcal{D}}_{<t}}\left(\mathfrak{a}\right)}{\partial \mathfrak{a}} $
; dotted line represents the standard deviation of the GP (up to a proportionality constant) $ {\sigma}_{{\mathcal{D}}_{<t}}\left(\mathfrak{a}\right) $
; and solid back line represents the utility function (6) with
$ {\sigma}_{{\mathcal{D}}_{<t}}\left(\mathfrak{a}\right) $
; and solid back line represents the utility function (6) with $ {\lambda}_1=30 $
and
$ {\lambda}_1=30 $
and $ {\lambda}_2=10 $
. Yellow line represents tutoring hours where a combination of features (A) and (B) (formalized by (8)) is maximized. The results are plotted after adaptively collecting three data points (panel
$ {\lambda}_2=10 $
. Yellow line represents tutoring hours where a combination of features (A) and (B) (formalized by (8)) is maximized. The results are plotted after adaptively collecting three data points (panel $ a $
), 6 data points (panel
$ a $
), 6 data points (panel $ b $
), 9 data points (panel
$ b $
), 9 data points (panel $ c $
) and 12 data points (panel
$ c $
) and 12 data points (panel $ d $
).
$ d $
).
In addition, Figure 5, panels $ (a) $
,
$ (a) $
, $ (b) $
,
$ (b) $
, $ (c) $
, and
$ (c) $
, and $ (d) $
, shows the utility functions (defined in Section 4.4),
$ (d) $
, shows the utility functions (defined in Section 4.4), $ {U}_1\left(\mathfrak{a}|{\mathcal{D}}_{<t}\right) $
,
$ {U}_1\left(\mathfrak{a}|{\mathcal{D}}_{<t}\right) $
, $ {U}_2\left(\mathfrak{a}|{\mathcal{D}}_{<t}\right) $
, and
$ {U}_2\left(\mathfrak{a}|{\mathcal{D}}_{<t}\right) $
, and $ {U}_3\left(\mathfrak{a}|{\mathcal{D}}_{<t}\right) $
for
$ {U}_3\left(\mathfrak{a}|{\mathcal{D}}_{<t}\right) $
for $ t\in \left\{\mathrm{3,6,9,12}\right\} $
. The dashed black line,
$ t\in \left\{\mathrm{3,6,9,12}\right\} $
. The dashed black line, $ {U}_1 $
, is proportional to the slope of the expected performance curve versus tutoring hours. As such, the peak of this curve corresponds to the optimal tutoring hours,
$ {U}_1 $
, is proportional to the slope of the expected performance curve versus tutoring hours. As such, the peak of this curve corresponds to the optimal tutoring hours, $ {\mathfrak{a}}_{\mathrm{II}}^{\ast } $
, where the effect of tutoring is maximal (see Equation 7). Similarly, the dotted black line,
$ {\mathfrak{a}}_{\mathrm{II}}^{\ast } $
, where the effect of tutoring is maximal (see Equation 7). Similarly, the dotted black line, $ {U}_2 $
, is proportional to the GP’s posterior standard deviation and maximizes at the tutoring hours,
$ {U}_2 $
, is proportional to the GP’s posterior standard deviation and maximizes at the tutoring hours, $ {\mathfrak{a}}_{\mathrm{II}}^{\ast } $
, where the relation between the tutoring hours and performance is the most uncertain (see Equation 9). The solid black curve,
$ {\mathfrak{a}}_{\mathrm{II}}^{\ast } $
, where the relation between the tutoring hours and performance is the most uncertain (see Equation 9). The solid black curve, $ {U}_3 $
, represents a utility function that is a linear combination of objectives I–III, that is:
$ {U}_3 $
, represents a utility function that is a linear combination of objectives I–III, that is:
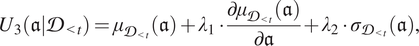 $$ {U}_3\left(\mathfrak{a}|{\mathcal{D}}_{<t}\right)={\mu}_{{\mathcal{D}}_{<t}}\left(\mathfrak{a}\right)+{\lambda}_1\cdot \frac{\partial {\mu}_{{\mathcal{D}}_{<t}}\left(\mathfrak{a}\right)}{\partial \mathfrak{a}}+{\lambda}_2\cdot {\sigma}_{{\mathcal{D}}_{<t}}\left(\mathfrak{a}\right), $$
with combination weights chosen to be $ {\lambda}_1=30 $
and
$ {\lambda}_1=30 $
and $ {\lambda}_2=10 $
.
$ {\lambda}_2=10 $
.
It can be seen that only after a few draws, the overall utility function, $ {U}_3 $
(6), is maximized in the adjacency of
$ {U}_3 $
(6), is maximized in the adjacency of $ \mathfrak{a}=6 $
h.
$ \mathfrak{a}=6 $
h.
4.3.3. Comparison of trials
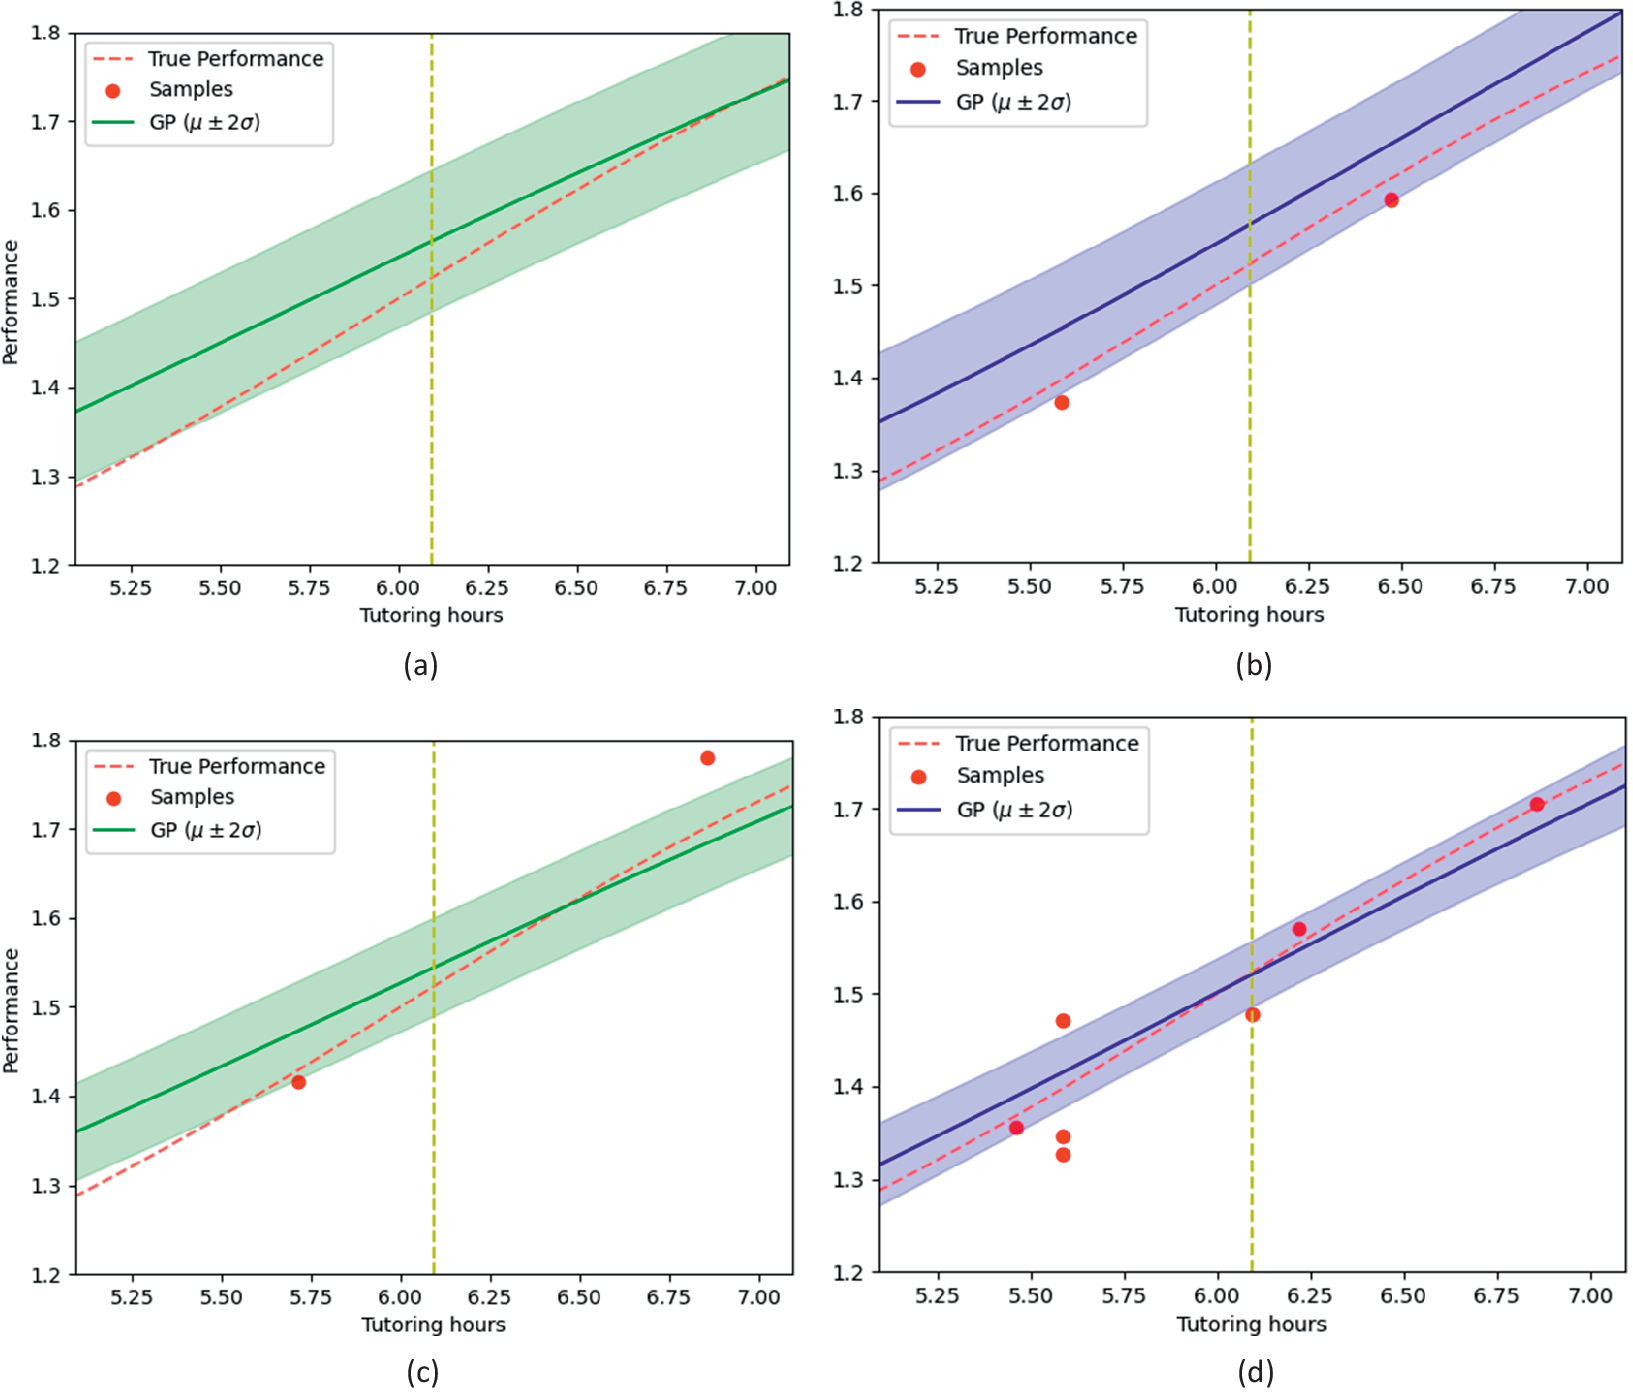
Figure 6 panels (a) and (b) compare the performance of the fixed design (a) and the adaptive design (b) for $ t=6 $
, while panels (c) and (d) are similar plots for
$ t=6 $
, while panels (c) and (d) are similar plots for $ t=12 $
. Figure 6 demonstrates the superiority of the adaptive design both in terms of accuracy and efficiency. For both
$ t=12 $
. Figure 6 demonstrates the superiority of the adaptive design both in terms of accuracy and efficiency. For both $ t=6 $
and
$ t=6 $
and $ t=12 $
, the estimated function from the adaptive trial design in the vicinity of the optimal rate of learning is closer to the true function than the estimate from the fixed trial design. Additionally, the uncertainty in the estimate for the adaptive trial design for
$ t=12 $
, the estimated function from the adaptive trial design in the vicinity of the optimal rate of learning is closer to the true function than the estimate from the fixed trial design. Additionally, the uncertainty in the estimate for the adaptive trial design for $ t=6 $
is less than the uncertainty in the fixed design for
$ t=6 $
is less than the uncertainty in the fixed design for $ n=12 $
. This shows that by being adaptive, and specific about the quantities we wish to learn, we get better results in the adaptive trial design with half of the samples needed for the fixed trial design.
$ n=12 $
. This shows that by being adaptive, and specific about the quantities we wish to learn, we get better results in the adaptive trial design with half of the samples needed for the fixed trial design.
Fixed design (left column) versus Bayesian adaptive trial (BAT) (right column). Red dashed line represents the true performance, $ \theta \left(\mathfrak{a}\right) $
, to be approximated. Circles,
$ \theta \left(\mathfrak{a}\right) $
, to be approximated. Circles, $ {\mathcal{D}}_{<t} $
represents the data points; blue and green lines represent GP’s mean,
$ {\mathcal{D}}_{<t} $
represents the data points; blue and green lines represent GP’s mean, $ {\mu}_{{\mathcal{D}}_{<t}}\left(\mathfrak{a}\right) $
; shaded blue/green regions represent 95% credible intervals around the GP’s mean; and yellow vertical line represents tutoring hours at which the linear combination of the performance and effect of tutoring is maximized (see (8)). First row: Six data points collected from the interval [0,12] (a subset of which are in the interval [5,7]) (a) by fixed design and (b) by BAT. Second row: Twelve data points collected from the interval [0,12] (c) by fixed design and (d) by BAT.
$ {\mu}_{{\mathcal{D}}_{<t}}\left(\mathfrak{a}\right) $
; shaded blue/green regions represent 95% credible intervals around the GP’s mean; and yellow vertical line represents tutoring hours at which the linear combination of the performance and effect of tutoring is maximized (see (8)). First row: Six data points collected from the interval [0,12] (a subset of which are in the interval [5,7]) (a) by fixed design and (b) by BAT. Second row: Twelve data points collected from the interval [0,12] (c) by fixed design and (d) by BAT.
We now provide details on the construction of the utility functions.
4.4. Utility function
In this example, we consider three different utility functions which, for ease of exposition, only depend on the action, $ \mathfrak{a} $
, and performance,
$ \mathfrak{a} $
, and performance, $ \theta $
. As mentioned earlier, in this illustrative example, the utility function is a linear combination of three objectives:
$ \theta $
. As mentioned earlier, in this illustrative example, the utility function is a linear combination of three objectives:
I. Maximizing the students’ performance. Clearly, the prime goal of providing tutoring hours, $ \mathfrak{a} $
(per student per month), is to maximize students’ expected performance. In the mathematical formalism, this is equivalent to finding a tutoring hour,
$ \mathfrak{a} $
(per student per month), is to maximize students’ expected performance. In the mathematical formalism, this is equivalent to finding a tutoring hour, $ {\mathfrak{a}}_{\mathrm{I}}^{\ast } $
, such that:
$ {\mathfrak{a}}_{\mathrm{I}}^{\ast } $
, such that:
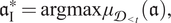 $$ {\mathfrak{a}}_{\mathrm{I}}^{\ast }=\mathrm{argmax}\hskip0.1em {\mu}_{{\mathcal{D}}_{<t}}\left(\mathfrak{a}\right), $$
since given the existing data, $ {\mathcal{D}}_{<t} $
, the expected performance is approximated by the GP’s (posterior) mean,
$ {\mathcal{D}}_{<t} $
, the expected performance is approximated by the GP’s (posterior) mean, $ {\mu}_{{\mathcal{D}}_{<t}}\left(\mathfrak{a}\right) $
.
$ {\mu}_{{\mathcal{D}}_{<t}}\left(\mathfrak{a}\right) $
.
Note that according to the presented model, increasing the tutoring hours, $ \mathfrak{a} $
(per student per month) monotonically increases the expected student’s performance. However, providing tutoring hours is costly, and given a limited budget, assigning boundless tutoring hours per student is not feasible. This leads to a second objective:
$ \mathfrak{a} $
(per student per month) monotonically increases the expected student’s performance. However, providing tutoring hours is costly, and given a limited budget, assigning boundless tutoring hours per student is not feasible. This leads to a second objective:
II. Maximizing the effect of tutoring. Given the limited resources, it is desirable to find tutoring hours that lead to a maximal increase in the student’s performance. This is equivalent to finding a point, $ {\mathfrak{a}}_{\mathrm{II}}^{\ast } $
, where the slope of the performance versus tutoring curve is maximal. That is:
$ {\mathfrak{a}}_{\mathrm{II}}^{\ast } $
, where the slope of the performance versus tutoring curve is maximal. That is:
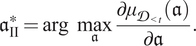 $$ {\mathfrak{a}}_{\mathrm{II}}^{\ast }=\mathrm{arg}\hskip0.5em \underset{\mathfrak{a}}{\max}\frac{\mathrm{\partial}{\mu}_{{\mathcal{D}}_{<t}}(\mathfrak{a})}{\mathrm{\partial}\mathfrak{a}}. $$
Similar utility functions have been demonstrated to succeed in robotics for the exploration of physical terrain, focusing on those areas with maximal slope (Morere et al., Reference Morere, Marchant and Ramos2017).
Note that objectives (A) and (B) that are introduced in the introduction of this section are obtained if a linear combination of I and II is maximized. This corresponds to the following utility function:
 $$ {U}_{1,2}\left(\mathfrak{a}|{\mathcal{D}}_{<t}\right)={\mu}_{{\mathcal{D}}_{<t}}\left(\mathfrak{a}\right)+{\lambda}_1\cdot \frac{\partial {\mu}_{{\mathcal{D}}_{<t}}\left(\mathfrak{a}\right)}{\partial \mathfrak{a}}, $$
where we choose $ {\lambda}_1=30 $
.
$ {\lambda}_1=30 $
.
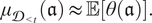
Objectives I and II are both based on the assumption that given the existing data, $ {\mathcal{D}}_{<t} $
, the expected performance versus tutoring,
$ {\mathcal{D}}_{<t} $
, the expected performance versus tutoring, $ \unicode{x1D53C}\left[\theta \left(\mathfrak{a}\right)\right] $
, is approximated sufficiently well by GP’s mean,
$ \unicode{x1D53C}\left[\theta \left(\mathfrak{a}\right)\right] $
, is approximated sufficiently well by GP’s mean, $ {\mu}_{{\mathcal{D}}_{<t}}\left(\mathfrak{a}\right) $
. That is:
$ {\mu}_{{\mathcal{D}}_{<t}}\left(\mathfrak{a}\right) $
. That is:
$$ {\mu}_{{\mathcal{D}}_{<t}}\left(\mathfrak{a}\right)\approx \unicode{x1D53C}\left[\theta \left(\mathfrak{a}\right)\right]. $$
Otherwise stated, objectives I and II are two different kinds of exploitation (of the already gathered data $ {\mathcal{D}}_{<t} $
) and can only be attained if the relation between the performance and tutoring is established by sufficient exploration. This leads to a third objective:
$ {\mathcal{D}}_{<t} $
) and can only be attained if the relation between the performance and tutoring is established by sufficient exploration. This leads to a third objective:
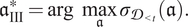
III. Minimizing the uncertainty in the relation between tutoring hours and performance. The uncertainty in the curve fitting is reflected in GP’s posterior standard deviation, $ {\sigma}_{{\mathcal{D}}_{<t}}\left(\mathfrak{a}\right):= \sqrt{K_{{\mathcal{D}}_{<t}}\left(\mathfrak{a},\mathfrak{a}\right)} $
. As such, a pure explorative objective can be defined by gathering new data from a setting that is associated with maximal uncertainty, this is, the tutorial hour (per month),
$ {\sigma}_{{\mathcal{D}}_{<t}}\left(\mathfrak{a}\right):= \sqrt{K_{{\mathcal{D}}_{<t}}\left(\mathfrak{a},\mathfrak{a}\right)} $
. As such, a pure explorative objective can be defined by gathering new data from a setting that is associated with maximal uncertainty, this is, the tutorial hour (per month), $ {\mathfrak{a}}_{\mathrm{III}}^{\ast } $
, where GP’s standard deviation is maximal:
$ {\mathfrak{a}}_{\mathrm{III}}^{\ast } $
, where GP’s standard deviation is maximal:
 $$ {\mathfrak{a}}_{\mathrm{III}}^{\ast }=\mathrm{arg}\hskip0.5em \underset{\mathfrak{a}}{\max }{\sigma}_{{\mathcal{D}}_{<t}}(\mathfrak{a}). $$
Putting everything together, we generate the next data-point, $ \left({a}_{t+1},{y}^{\left[t+1\right]}\right) $
, by assessing students’ performance after
$ \left({a}_{t+1},{y}^{\left[t+1\right]}\right) $
, by assessing students’ performance after $ {a}_{t+1} $
hours of monthly training, where
$ {a}_{t+1} $
hours of monthly training, where $ {a}_{t+1} $
is the quantity that maximizes a linear combination of the introduced objectives I–III:
$ {a}_{t+1} $
is the quantity that maximizes a linear combination of the introduced objectives I–III:
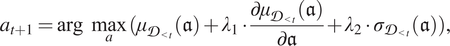 $$ {a}_{t+1}=\mathrm{arg}\hskip0.5em \underset{a}{\max }({\mu}_{{\mathcal{D}}_{<t}}(\mathfrak{a})+{\lambda}_1\cdot \frac{\mathrm{\partial}{\mu}_{{\mathcal{D}}_{<t}}(\mathfrak{a})}{\mathrm{\partial}\mathfrak{a}}+{\lambda}_2\cdot {\sigma}_{{\mathcal{D}}_{<t}}(\mathfrak{a})), $$
where $ {\lambda}_1 $
and
$ {\lambda}_1 $
and $ {\lambda}_2 $
are the tunable parameters that determine the trade-off between the three objectives.
$ {\lambda}_2 $
are the tunable parameters that determine the trade-off between the three objectives.
5. BATs and organizational learning
BATs represent not only an efficient experimental methodology, but also a foundational shift toward a right-fit evidence system. The most effective way to learn what works—and under what conditions—is through embedding empirical experimentation within the contexts where initiatives are intended to operate. Public sector initiatives inherently serve as such experiments.
A pivot toward a culture that values empirical experimentation and learning from each initiative, regardless of its outcome, has many advantages (see, e.g., Jovanovic and Nyarko, Reference Jovanovic and Nyarko1995; Senge, Reference Senge2006; Provera et al., Reference Provera, Montefusco and Canato2010). It promotes more efficient utilization of resources, as it acknowledges and leverages the valuable insights gained from the experiences of these programs, rather than discarding information when evaluations are not favorable, and also contributes to a more responsible and sustainable approach to governance (Farson and Keyes, Reference Farson and Keyes2006; Dahlin et al., Reference Dahlin, Chuang and Roulet2018).
The adoption of rigorous impact assessments and their use for organizational learning face several obstacles. Decision-making in practice is rarely a straightforward process of weighing evidence; rather, it is shaped by political dynamics, where the power and influence of interest groups often determine what is considered and implemented (Parkhurst, Reference Parkhurst2016). In addition, policy advisors and service providers frequently view impact evaluations as unwelcome “scrutiny” (Davis et al., Reference Davis, Althaus and Bridgman2018).
BATs cannot address many of these issues; however, in environments where political needs tip the scale toward incorporating evidence in decision-making processes, they can provide a valuable analytical scaffold. Even in politically charged environments, evidence retains influence, and in today’s budget-constrained contexts, leaders are increasingly prioritizing evidence on what truly works. When adopted, BATs can potentially help catalyze a gradual cultural shift within the organizations—from the rigid binary of “success and failure” typically reinforced by traditional evaluations to a mindset centered on continuous learning and improvement. Furthermore, moving away from binary answers to probabilistic thinking may help mitigate some of agency problems that hinder the broader adoption of impact evaluations.
BATs can help in multistakeholder distributed decision-making environments (Cairney, Reference Cairney2021). They offer a flexible framework to reinterpret the same data using different priors and utilities (see Sections 2 and 4 for definitions), reflecting the diverse perspectives and objectives of relevant stakeholders.
6. Conclusions
This article underscores the transformative potential of the BAT framework as an impactful and efficient methodology for social policy impact evaluations and, more broadly, right-fit evidence systems. By mitigating the limitations of traditional evaluation methods like RCTs, BATs offer a dynamic, cost-effective, and highly adaptable approach that is in line with the policy cycle. The ability of BATs to integrate various data types through Bayesian reasoning, while continuously adapting to new information, makes them well-suited for real-world policy applications where complexity and variability are the norms. This approach aligns with the need for more agile and rigorous methods in policy evaluation, especially in contexts where decisions must be made swiftly and with limited resources. The success of BATs in fields such as medicine and marketing further underscores their potential in the realm of social policy.
As technological and algorithmic advancements continue to evolve, the implementation of BATs in social policy could mark a significant shift toward more effective, evidence-based decision-making. This shift is not just about adopting a new methodological framework; it represents a broader movement toward a culture of continuous learning and adaptive management in the pursuit of social good. Ultimately, BATs stand to enhance our ability to discern the most impactful and beneficial policy interventions, thus fostering a more informed, efficient, and responsive approach to social policy development and implementation.
Abbreviations
- BAT
-
Bayesian adaptive trial
- RCT
-
randomized controlled trial
Data availability
The code to implement the numerical example discussed in Section 4 is available by accessing the Github repository https://github.com/human-technology-institute/BAT-for-social-policy.
Author contribution
Conceptualization: all authors; Data curation: N/A; Formal analysis: S.C., A.L., and H.M.A.; Funding acquisition: S.C and R.M.; Investigation: all authors; Methodology: all authors; Project administration: S.C. and G.F.; Software: H.M.A. and R.M.; Supervision: S.C.; Validation: S.C., A.L., and H.M.A.; Visualization: S.C. and H.M.A.; Writing—original draft: S.C., A.L, and H.M.A; Writing—review and editing: all authors.
Funding
This research was supported by the Paul Ramsay Foundation under the Thrive: Finishing School Well project.
Competing interest
The authors declare no competing interests. Although B.G. is an employee of the funding organization, the Paul Ramsay Foundation, he has not been involved in decision-making processes related to the allocation or management of grant funding, thus mitigating a perceived conflict of interest.


 Open access
Comments
No Comments have been published for this article.