


Introduction
Recent measurements of glacier mass balance with satellites show that mountain glaciers all over the world generally had negative mass balances in the first decades of the 21st century (Zemp and others, Reference Zemp2015 and Reference Zemp2019; Marzeion and others, Reference Marzeion, Kasser, Maussion and Champollion2018; Wouters and others, Reference Wouters, Gardner and Moholdt2019; Hugonnet and others, Reference Hugonnet2021; Thomson and others, Reference Thomson, Brun, Braun and Zemp2021). The rising temperatures and resulting increased glacier melting envisaged by Hansen and others (Reference Hansen1981) and National Research Council (1985) are therefore well underway. The satellite measurements refer to different periods within the past two decades, e.g., for 2002–16 using the GRACE satellite (Wouters and others, Reference Wouters, Gardner and Moholdt2019) and 2000–19 using satellite altimetry (Hugonnet and others, Reference Hugonnet2021). It is difficult to directly compare the early 21st century mass balances found in these studies with earlier 20th century changes because of the lack of global satellite coverage in the earlier period (Zemp and others, Reference Zemp2015 and Reference Zemp2019). Before the early 21st century, glacier mass balances were only available from fieldwork on a few hundred individual glaciers (Cogley and Adams, Reference Cogley and Adams1998; Dyurgerov and Meier, Reference Dyurgerov and Meier2000; Braithwaite, Reference Braithwaite2002; Cogley, Reference Cogley2009; Huss and Bauder, Reference Huss and Bauder2009) and even these data are open to some criticisms. For example, Cogley and Adams (Reference Cogley and Adams1998) thought that larger glaciers in their dataset have more negative balances than typical (smaller) glaciers. Braithwaite (Reference Braithwaite2009) suggested the then-existing dataset had glaciers with higher precipitation than the global average due to inclusion of so many glaciers in maritime and mid-latitude situations, and relatively few glaciers from the drier high latitudes or Central Asia.
The present paper addresses the changes that must have happened over recent decades to turn glacier mass balances from close to zero for 1961–90 (Cogley and Adams, Reference Cogley and Adams1998) to the generally more negative balances of the early 21st century (Wouters and others, Reference Wouters, Gardner and Moholdt2019; Hugonnet and others, Reference Hugonnet2021). For the present study, we identify individual glaciers with year-to-year data for surface mass balance over the past few decades, and we study their changes.
Glacier surface mass balance
Ahlmann (Reference Ahlmann1948) developed mass balance concepts and techniques in a series of studies around the North Atlantic. Based on Ahlmann's work, several groups started multi-year measurement programmes, some of which continue to the present day. The first continuing series, reported in the literature of the time, is from Storglaciären in northern Sweden (Schytt, Reference Schytt1962), starting in 1946. Similar programmes started soon afterwards in Norway (Storbreen), France (Sarennes), Switzerland (Limmern and Plattalva) and the USA (Lemon Creek). By the 1960s, a basic network of surface mass balance measurements in most parts of the world had started to develop, partly inspired by the International Hydrological Decade 1965–1974 (Meier, Reference Meier1970).
Direct measurement of mass balance at the glacier surface is very laborious as it involves measuring stakes and snow pits at many sites on the glacier and then averaging the single – site data to give whole – glacier balances. We can trace the development of mass balance concepts and methods through Ahlmann (Reference Ahlmann1948), Meier (Reference Meier1962), Schytt (Reference Schytt1962), Glen (Reference Glen1963), Østrem and Stanley (Reference Østrem and Stanley1969), Unesco/lASH (1969), Hoinkes (Reference Hoinkes1970), Østrem and Brugman (Reference Østrem and Brugman1991), Kaser and others (Reference Kaser, Fountain and Jansson2003) and Cogley and others (Reference Cogley2011).
Ahlmann (Reference Ahlmann1948) thought he could measure annual accumulation and annual ablation, but Unesco/lASH (1969) shows we can only measure the net balances of winter and summer seasons, and we now call these winter and summer balances. The winter balance relates to the maximum transient balance at the end of the winter season (Unesco/lASH, 1969), but this is not true for so-called ‘summer-accumulation’ glaciers, where winter and summer balances are undefined (Sakai and Fujita, Reference Sakai and Fujita2017). Aside from this, workers do not always measure winter balances, even where the concept is valid. For example, the twice – yearly visits to a remote glacier needed to measure winter and summer balances may be quite burdensome and not feasible for all years.
Cogley and others (Reference Cogley2011) amended the notation of Unesco/lASH (1969) so we now write the mass balance equation as:

where B a, B w and B s are whole-glacier averages of annual, winter and summer balances respectively. The sign convention is that B s is intrinsically negative. The whole-glacier averaging of mass balance components, first proposed by Ahlmann (Reference Ahlmann1948), is useful because it allows us to compare mass balance averages (in m w.e. a−1) for glaciers of greatly differing sizes (as we do in the present study).
The World Glacier Monitoring Service (WGMS), formerly the Permanent Service on the Fluctuations of Glaciers, archives most (if not all?) measurements of surface mass balance (WGMS, Reference WGMS2022).
Some long series of mass balance data in the latest WGMS database (WGMS, Reference WGMS2022) predate Ahlmann (Reference Ahlmann1948) and seem to contradict our historical narrative starting with Ahlmann (Reference Ahlmann1948). The answer is that early workers on Alpine glaciers made measurements for various purposes, which modern glaciologists can re-evaluate as mass balance data (Geibel and others, Reference Geibel2022). A good example of such ‘rescue’ data is from Rhonegletscher, Switzerland, where Chen and Funk (Reference Chen and Funk1990) analysed ablation measurements in Mercanton (Reference Mercanton1916) and, with some extrapolations, obtained the winter, summer and annual balances for the years 1884/5 to 1908/9 that now appear in WGMS (Reference WGMS2022). Another example of rescue data is from Claridenfirn, Switzerland, where Huss and others (Reference Huss2021) calculated mass balances from a long series of snow accumulation measurements (Müller and Kappenberger, Reference Müller and Kappenberger1991). Geibel and others (Reference Geibel2022) may inspire workers in other regions to look for measurements made on their glaciers by surveyors and hydrologists before the formal start of mass balance studies.
Figure 1 shows the length of mass balance record available from different glaciers in the WGMS database (WGMS, Reference WGMS2022). Two very long records are for Swiss rescue data, but most of the records for 482 glaciers (up to 2020) are very short. For example, the mean length of series is 13.6 years and median length is only 6 years. This shows that most studies run only for a few very years on any glacier. Of great interest for the present paper, are the relatively few glaciers (17 to 38) with mass balance records longer than about 50–60 years, as these are the series that potentially span the period 1961–2020 chosen for our study. These data come from only a few regions.
Length of mass balance records 1885–2020. Data from WGMS (Reference WGMS2022).

Hoinkes (Reference Hoinkes1970), acknowledged the pioneering work of Ahlmann (Reference Ahlmann1948) but said his method is only one of three mass balance methods, the ‘direct’ or ‘glaciological’ method in his terminology, which we now call surface balance or sometimes conventional balance (Cogley and others, Reference Cogley2011). We will not discuss the ‘hydrological’ method identified by Hoinkes (Reference Hoinkes1970) but his ‘geodetic’ method is very important (Cogley and others, Reference Cogley2011). Hoinkes (Reference Hoinkes1970) explains that glacier volumes from accurate surveying or mapping at two time points, combined with an appropriate density, converts long – term volume changes into geodetic mass balances (Cogley and others, Reference Cogley2011). Using high – quality maps from the late 19th or early 20th century until present, Bauder and others (Reference Bauder, Funk and Huss2007) and Haeberli and others (Reference Haeberli, Hoelzle, Paul and Zemp2007) inferred century – scale geodetic balances for 23 Alpine glaciers.
Hoinkes (Reference Hoinkes1970) was mainly referring to geodetic balances based on mapping from land stations and/or from aircraft but from about 1960 onwards, with the Corona KH4 family, the coverage of glaciers by satellites with stereo capabilities has increased enormously, see Table 7.1 in Raup and others (Reference Raup, Andreassen, Bolch, Bevan and Tedesco2015). Coverage became global in the early 21st century, leading to the 2000–19 global mean mass balance of Hugonnet and others (Reference Hugonnet2021). Another satellite method for measuring mass balance uses the Gravity Recovery and Climate experiment (GRACE) which is a gravimetric rather than geodetic method (Cogley and others, Reference Cogley2011). The 2002–16 global average mass balance assessment by Wouters and others (Reference Wouters, Gardner and Moholdt2019) uses GRACE.
Field scientists cannot measure surface balances without error, but no error term appears in Eqn (1) because the equation defines summer balance as the difference between winter and annual balances. This is the convention followed in WGMS (Reference WGMS2022). Aside from year – to – year measurement errors, long series of surface mass balance are probably not completely homogeneous because of changes in personnel and procedures, as well as changes in the altitude/area sampling – space for the glacier. Workers can compare average surface balances over a few years with available geodetic balances and should correct archived mass balance data if appropriate (Andreassen, Reference Andreassen1999; Østrem and Haakensen, Reference Østrem and Haakensen1999; Thibert and others, Reference Thibert, Blanc, Vincent and Eckert2008; Zemp and others, Reference Zemp2013; Andreassen and others, Reference Andreassen, Elvehøy, Kjøllmoen and Engeset2016; Thomson and others, Reference Thomson, Zemp, Copland, Cogley and Ecclestone2017; O'Neel and others, Reference O'Neel2019; Mukherjee and others, Reference Mukherjee2022).
Research design
The WMO guideline on climate normals (WMO, 2017) inspired our research design. In the WMO system, a climatological standard normal refers to an average for the most recent 30 – year period, which is now 1991–2020. However, WMO (2017) suggest retention of the 1961–90 period as a standard reference period for assessments of future climate changes. Our research design is therefore to compare glacier surface balances in 1991–2020 with those in 1961–90. As we expect different changes for different glaciers (Braithwaite and Hughes, Reference Braithwaite and Hughes2022), we prefer to follow changes in surface balances for individual glaciers over the 1961–2020 period, and we explain how to do this in the following section of the paper.
In Table 1, we illustrate changes in mean mass balance for different periods using data from the WGMS database (WGMS, Reference WGMS2022), discussed in the previous section. The few records 1885–1930 are from Swiss rescue glaciers while the mass balance network started to develop in the latter half of 1931–60 in a few regions. The greatly expanded network for 1961–2020 is noteworthy with more than half the available records (58%) in the last three decades 1991–2020. Except for 1901–30, mean balances are significantly less than zero (at 95% level) with most negative balances for the last 30 years. For the present study, therefore, we compare mass balances for the past two 30 – year periods, as these are the periods containing most of the available data and showing largest contrast in mean mass balance.
Mean annual balances B (in m w.e. a−1) in different periods 1885–2020 in the WGMS database (WGMS, Reference WGMS2022)

N is number of records in each period, % is the parentage of total record, and 95%? is ‘Yes’ if mean balance is significantly different from zero at 95% probability level.
We demonstrate the changes in air temperatures over recent decades with a tool on the GISS-NASA website (GISTEMP Team, 2022 and Lenssen and others, Reference Lenssen2019). This tool allows the user to choose different temperature anomalies to plot onto a map of the world (Fig. 2).
Global distribution of June–August temperature anomaly for 1991–2020 with respect to 1961–1990 base period. From GISTEMP Team (2022) and Lenssen and others (Reference Lenssen2019).
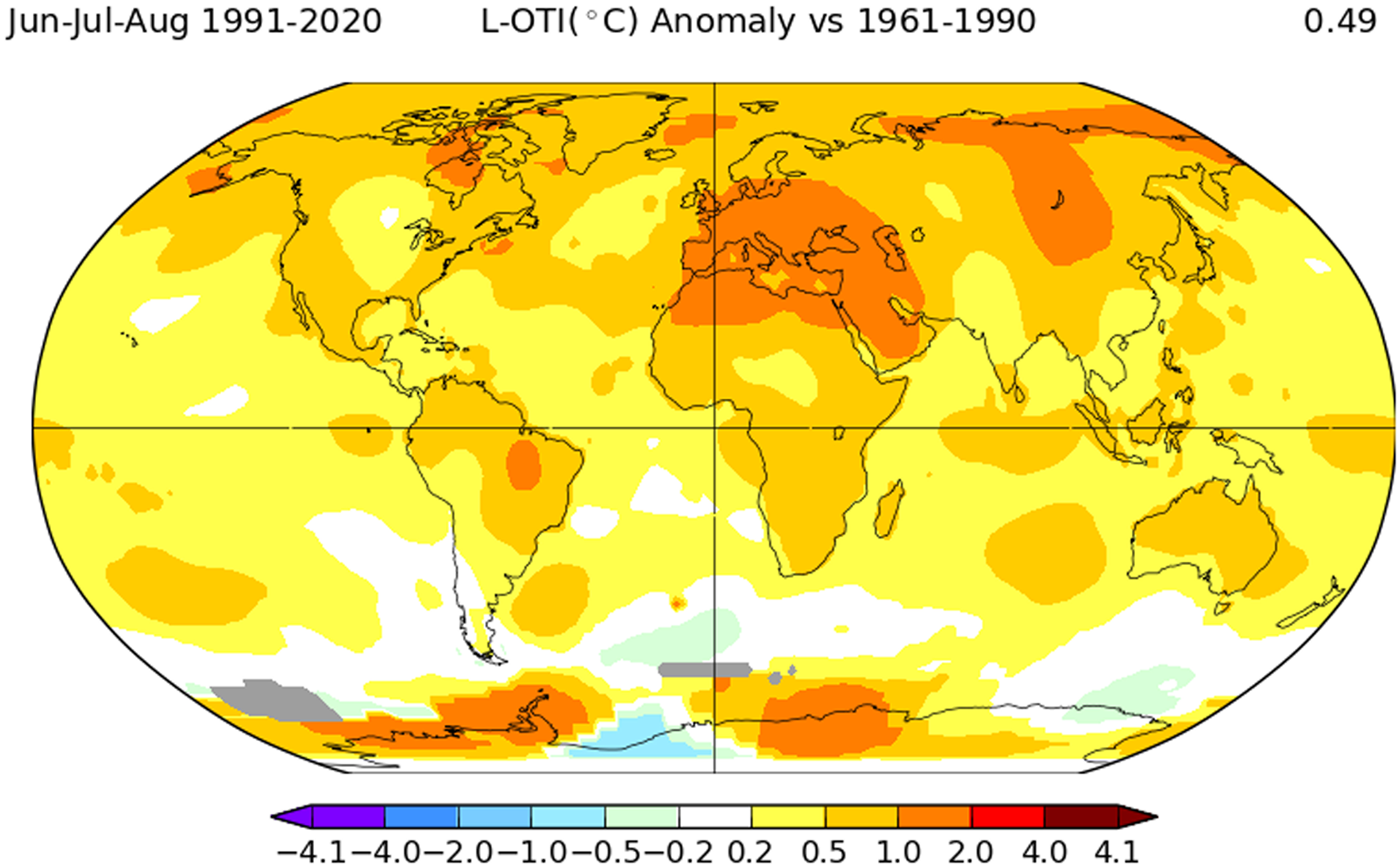
The anomalies are based on data for monthly mean temperatures at about 7929 stations all over the world in the Global Historic Climate Data Network (GHCN, version 4). We chose to plot 1991–2020 June–August temperature anomalies relative to the 1961–90 base period because June–August (or May–September) temperatures are more relevant for glacier melting in the Northern Hemisphere (Braithwaite and Hughes, Reference Braithwaite and Hughes2022) than annual temperatures.
Figure 2 shows strong warming (>1°C) across Europe, the Mediterranean, North Africa and the Middle East, which is consistent with the high 1991–2018 temperature anomalies found for the Alps (Braithwaite and Hughes, Reference Braithwaite and Hughes2022). Summer temperature anomalies for other areas with glacier cover (western N. America, Iceland, Scandinavia and Asia) are generally lower (<1°C) but still positive. There is no strong amplification of summer temperatures at high latitudes in Arctic Canada or Svalbard, although such amplification occurs for other seasons (not shown here). The positive temperature anomalies in Fig. 2, suggest that glacier melting should be higher for all areas in 1991–2020 compared with 1961–90 because of higher summer temperatures.
Available mass balance data 1961–2020
We compare mean mass balances for two periods for available surface balance data series. We average the balance Eqn (1) for the different periods so the change in annual balance, given by Eqn (2), between periods 1 and 2 is:

where the overbar denotes time-averages of annual balances $\bar{B}_{a, 2}$ and $\bar{B}_{a, 1}\;$
 for periods 1 and 2. The annual balance $\bar{B}_{a, 2}$
 , given by Eqn (3), results from changes in both winter ΔB w,2−1 and summer ΔB s,1−2 balances from period 1 to 2 according to:

Although Eqns (1) and (2) are exact, we introduce the error term into Eqn (3) to balance the equation where winter and summer balances are available for fewer years than annual balances. This is frequently the case. Eqn (3) describes a sort of ‘inertia’ whereby annual balances remain constant between periods if there are no changes in winter and summer balances.
Eqn (3) refers to changes in mean surface balance between periods. The change in surface balance within periods will be a combination of random inter-annual fluctuations, long-term trend and occasional isolated spikes or troughs (Pelto, Reference Pelto2018; Thibert and others, Reference Thibert, Dkengne Sielenou, Vionnet, Eckert and Vincent2018; Braithwaite and Hughes, Reference Braithwaite and Hughes2022).
For this study, we choose periods 1 and 2 to be 1961–90 and 1991–2020 respectively to fit WMO (2017). These periods include most available long series of mass balance data outside the Alps (Table 1). This means we have relatively complete 1961–90 annual balances for 51 glaciers and complete 1991–2020 balances for 81 glaciers (Table 2). Measurements on some glaciers with complete records for 1961–90 ceased while new measurement series started on other glaciers so there are only 37 glaciers with complete annual balance data for both periods. They do not include any glaciers from Greenland, Iceland, Southern Asia or from the Southern Hemisphere.
Geographical distribution of glaciers with complete mass balance records for 1961–2020, 1961–1990 and 1991–2020

Data from WGMS (Reference WGMS2022).
Table A1 in the Appendix shows mean balances for 1961–90 and 1991–2020 for the 37 glaciers and changes of winter and summer balances for 25 glaciers. For inclusion in the dataset, there must be 28–30 years of annual balances in 1991–2020, while we are more relaxed in allowing as few as 20 years of data in 1961–90. The latter choice avoids excluding too many glaciers from the earlier period, and we justify it by the lack of large trends in 1961–90. The errors in Eqn (3) are quite small for individual glaciers with as few as 20 years data for winter and summer balances in either of the 30-year periods.
In Table A1, there are few glaciers from North America because many measurements series there only started in the 1980s and 1990s (Pelto, Reference Pelto2018). There are 14 glaciers from the Alps, including eight glaciers previously studied by Braithwaite and Hughes (Reference Braithwaite and Hughes2022) and five rescue glaciers from Huss and others (Reference Huss, Dhulst and Bauder2015). The Academy of Sciences of the former USSR started mass balance work in the 1950s in Russia and Central Asia (Grosswald and Kotlyakov, Reference Grosswald and Kotlyakov1969) but many of their programmes ceased in the early 1990s so there are only three Russian/Asian glaciers in Table A1 with full records for 1961–2020. The Russian/Asia glaciers with records for only 1961–90 are interesting as they include high – precipitation glaciers like IGAN and Obrucheva (Voloshina, Reference Voloshina1988) as well as more continental glaciers.
Changes in mean mass balance
We start by comparing variations within the sample represented by Table A1. Figure 3 shows the means and 95% confidence intervals of the five terms in Eqn (3) for 25 glaciers. The mean balance for 1961–90 is significantly less than zero (at 95% level) although positive balances do occur for 7 out of 25 individual glaciers. In principle, changes in both winter and summer balances should cause changes in annual balance, but changes in winter balance are relatively small although evenly distributed between positive and negative changes for individual glaciers. Changes in summer balance are significantly negative, and the error in Eqn (3) is close to zero on average and varies little between glaciers. The mean balance for 1991–2020 is much more negative than the mean balance for 1961–90, and this mainly reflects negative changes in summer balances between the two periods.
Means and 95% confidence intervals of the five terms in the balance equation for 25 glaciers. Error on x-axis refers to error in Eqn (3).

The results in Fig. 3 do not support the idea that 1961–90 annual balances were very close to zero. Indeed, Fig. 4 suggests that a moderately negative balance for 1961–90 for a particular glacier is a driver for highly negative balance for the same glacier in the following period 1991–2020.
1991–2020 mean annual balance vs 1961–90 mean annual balance for 25 glaciers.

The hatched lines in Fig. 4 partition the data into small negative changes (less than −0.5 m w.e. a−1), large negative changes (between −0.5 and −1.0 m w.e. a−1) and very large negative changes (more than −1.0 m w.e. a−1). The most notable point is for Ts.Tuyuksuyskiy in Kazakhstan where there is little difference in annual balance between the two periods. We return to this glacier after further data analysis.
The high latitude glaciers (Arctic and Svalbard) in Fig. 4 all show low changes while glaciers in North America show both low and large changes, from South Cascade to Lemon Creek, as do glaciers from Scandinavia, from low changes on Nigardsbreen to high changes on Ålfotbreen. The latter glaciers both had positive balances for 1961–90 but the 1991–2020 mean balance for Nigardsbreen is still positive. It is important therefore to say that not all glaciers are losing mass. Glaciers from the Alps show a wide range of changes from small to very large negative.
In principle, the different annual balances for the two periods (Fig. 3) should reflect effects of changes in both winter and summer balances. The 1991–2020 mean balance is significantly correlated (at 5% significance level with sample size 25) with (a) the change in summer balance between the two periods, and (b) the mean balance for 1961–90 mean. In contrast, the correlations between 1991–2020 balance and (c) the change in winter balance and (d) error in the balance Eqn (3) are small. We tested this further with stepwise regression whereby we treated 1991–2020 balance as the dependant variable and used the other variables as independent variables. Change in summer balance alone accounts for 59% of the variance of 1991–2020 balance in Table A1, and this rises to 89% with 1961–90 balance as a second independent variable.
We eliminate the effect of 1961–90 mean balance by calculating changes in annual balance between the two periods. This is highly correlated with the change in summer balance (r = 0.90, significant at 1% level for a sample size of 25) and almost uncorrelated with changes in winter balance (r = 0.02, not significant at 1% level). The hatched line in Fig. 5 shows the expected 1:1 relation between changes in annual and summer balances if other factors were zero. The largest deviation from the 1:1 line is for Ts.Tuyuksuyskiy but we still cannot state definitely that this glacier is anomalous.
Change in annual balance vs change in summer balance for 25 glaciers. Both changes are from 1961–1990 to 1991–2020.

Changes in summer temperature
Supposing that changes in summer temperature cause changes in summer balance (Braithwaite and Hughes, Reference Braithwaite and Hughes2022), we extrapolated 1961–2020 monthly mean temperatures from the CRU/UEA TS 4.5 gridded climatology (Harris and others, Reference Harris, Osborn and Jones2020) for the gridpoint nearest each glacier to the median altitude of each glacier, available from metadata in WGMS (Reference WGMS2022). We used a vertical lapse rate of 0.006°C m−1. which is close to the global average (Farnsworth and others, Reference Farnsworth2021). Distances from glaciers to the nearest gridcell in the climatology are all <37 km. Summer temperature anomalies for each year in the period 1961–2020 are the differences between summer temperature for that year and the mean summer temperature for 1961–90. In this way, the mean temperature anomaly for 1961–90 is zero, and the mean anomaly for 1991–2020 is the change in mean summer temperature during that period.
We calculate anomalies for two summer temperature parameters, i.e., June–August and May–September mean temperatures. We choose these seasonal averages to represent melting conditions on the glaciers. For glaciers in the Alps, May–September temperatures characterise the melting period at the median altitude (Braithwaite and Hughes, Reference Braithwaite and Hughes2022) and the same is probably true for the other glaciers except for those at high latitudes. For Arctic and Svalbard glaciers, June–August temperatures may be a more realistic index of melting conditions in different years. As we are working with anomalies, the precise choice of vertical lapse rate in each region is not critical.
We compare mean temperature anomalies for May–September and June–August in Fig. 6. The close clustering of anomalies for each region suggests very similar temperature changes across the widely spaced glaciers in each region, separated by hundreds of kilometres. This justifies our decision early in the study not to interpolate temperatures between the nearest grid points around each glacier.
1991–2020 temperature anomalies for May–September vs June–August for 25 glaciers

The glaciers of the Alps show the highest temperature anomalies for both June–August and for May–September. Scandinavia and Russia/Asia have similar but lower values for both anomalies, while high latitude glaciers have slightly higher temperature anomalies for May–September compared with June–August.
Mass balance and summer temperature
Changes in summer balance for the 25 glaciers are plotted against temperature anomalies in Fig. 7. We use the anomaly for June–August for consistency with the map in Fig. 2 but Fig. 6 shows similar variations for both anomalies.
Change in summer balance from 1961–90 to 1991–2020 vs 1991–2020 June–August temperature anomalies for 25 glaciers.

The hatched lines denote a range in temperature-sensitivity for summer balance (BS sensitivity) from −0.2 to −1.0 m w.e. a−1 °C−1. This range in sensitivity is generally consistent with model projections for 1°C temperature rises (Oerlemans and Hoogendoorn, Reference Oerlemans and Hoogendoorn1989; Braithwaite and Olesen, Reference Braithwaite and Olesen1990; Oerlemans and Fortuin, Reference Oerlemans and Fortuin1992; Braithwaite and Zhang, Reference Braithwaite and Zhang1999 and, Reference Braithwaite and Zhang2000; de Woul and Hock, Reference de Woul and Hock2005; Braithwaite and Raper, Reference Braithwaite and Raper2007). The most striking point in Fig. 7 is that Ts.Tuyuksuyskiy does not show any sensitivity to temperature increase. The apparent anomaly for this glacier in Fig. 4 could have been explained if temperatures did not increase for this particular glacier but it is now clear from Fig. 7 that 1991–2020 temperatures were higher than 1961–90 temperatures for this glacier, as for other glaciers.
The three Arctic glaciers in Fig. 7 have low summer balance changes and small temperature – sensitivity in rough agreement with modelling by Braithwaite and Raper (Reference Braithwaite and Raper2007). The three glaciers from N. America show a range of temperature – sensitivity from low to high, and the same is true for Scandinavia and the Alps. The Scandinavian glaciers show a range in temperature – sensitivity from low (Storglaciären) to high (Ålfotbreen) with apparent grouping in the intermediate range: Engabreen, Gråsubreen, Nigardsbreen and Hellstugubreen comprising Group 1 in Fig. 7 and Rembesdal and Storbreen comprising Group 2. The sensitivities in Fig. 7 refer to multi – year averages, but temperature-sensitivity for any glacier may increase with time (Shaw and others, Reference Shaw2023).
Discussion
The 37 glaciers studied here cannot be representative of the more than 200 000 glaciers in the world but may constitute a snapshot of different glacier types. The glaciers show multi-decade changes from 1961–90 to 1991–2020 in annual balance (for 36 out of 37 glaciers), and changes in winter and summer balance (for 25 glaciers). Glacier mass balances became more negative in the period 1991–2020 compared with 1961–90 mainly due to rising summer temperature in the latter period. It is known from satellite measurements that very many glaciers have negative balances in the first decades of the 21st century (Wouters and others, Reference Wouters, Gardner and Moholdt2019; Hugonnet and others, Reference Hugonnet2021) and we suggest this is a result of the recent rises in summer temperature imposed on glaciers with less negative balances a few decades ago.
Some apparent anomalies in Scandinavian glaciers relate to increases in winter balances in 1991–2020 due to changes in atmospheric circulation in parallel with rising temperature (Andreassen and others, Reference Andreassen, Elvehøy, Kjøllmoen and Engeset2020).
Surface balance measurements should continue on as many glaciers as possible, but it is unrealistic to expect a much greater number of records in the 21st century compared with the global coverage of modern remote sensing. The latter is not (yet?) capable of resolving seasonal or inter – annual changes in balance so study of surface balances for individual glaciers is still worthwhile, even if only for a few hundred glaciers. This is because glaciers experience different temperature and precipitation conditions each year, so their year-to-year balances contain valuable clues to causes of glacier changes.
Our own future research will address the differences in temperature – sensitivity for summer balances as shown in Fig. 7. Our present research design concentrates on glaciers with long records, greatly limiting the number of glaciers studied. For the future, we will include more glaciers by regression studies (Braithwaite and Hughes, Reference Braithwaite and Hughes2022) on about 118 glaciers with more than 20 years of record in WGMS (Reference WGMS2022). Even then, this expanded dataset will exclude some interesting areas because of shortness of mass balance record.
The negative balance trends for observed glaciers here are clear from this study but it is not clear that all glaciers will disappear entirely in response to continued climatic warming (Kuhn, Reference Kuhn1995). This is because glaciers may become decoupled from regional climate as they become much smaller with local topoclimatic controls taking over (Hughes, Reference Hughes2014). For example, in the Dinaric Alps, Montenegro and the High Atlas, Morocco, snow patches and recent niche glaciers existed in highly anomalous climatic settings, and the relationship between regional climate and mass balance breaks down (Hughes, Reference Hughes2010; Hughes and others, Reference Hughes2020).
Conclusions
We analyse surface balance changes for 37 glaciers in the Northern Hemisphere with available data through the period 1961–2020. For 36 of the glaciers, annual balances for 1991–2020 are more negative than for 1961–90 balance. For 25 glaciers, with winter and summer balance data, changes in mean balances from 1961–90 to 1991–2020 are mainly due to increasingly negative summer balance as a result of rising summer temperatures in all glacier regions. Glaciers are therefore not sustainable under the 1991–2020 mean summer climate, and temperatures need to fall below those of 1961–90 to restore balanced budgets. The 1991–2020 summer temperature anomalies relative to the 1961–90 mean are largest for glaciers in the Alps (nearly 1.5°C) but there is a wide range in temperature – sensitivity for surface balance that requires further investigation.
Acknowledgements
The University of Manchester has supported RJB with an Honorary Senior Research Fellowship since 2010. We use archived glacier and climate data from various agencies including WGMS, NASA/GISS and CRU/UEA and we are deeply grateful to all those who fund, compile, validate and distribute such data for use by the wider community. We thank the Scientific Editor Prof. Luke Copland and two anonymous referees for their comments.
Appendix
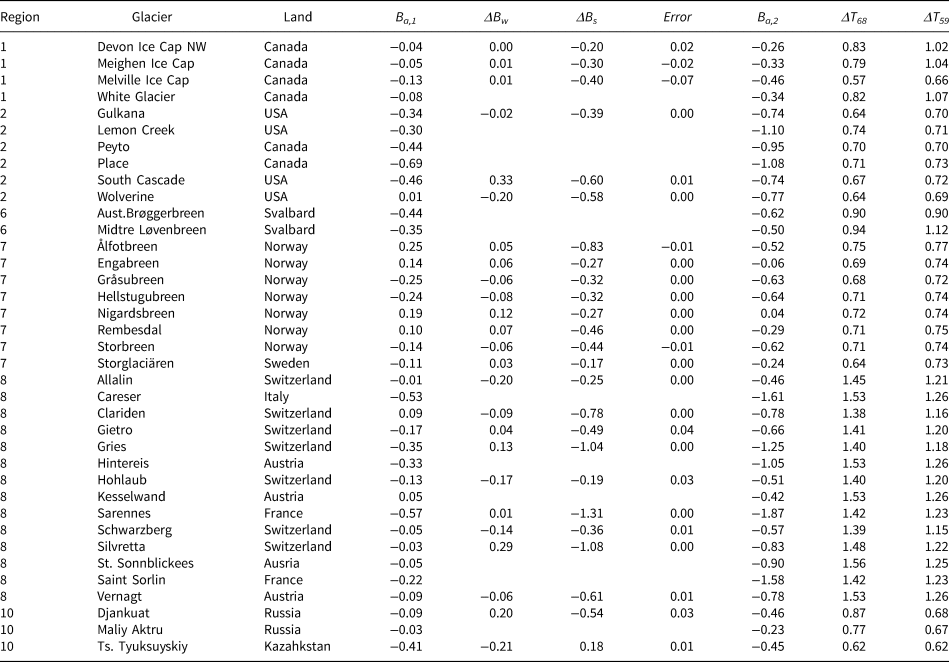
Mass balance statistics for 37 glaciers with complete data for 1961–2020


 Open access