

Introduction
Bed-reflection power (BRP) has been used by practitioners of ice-penetrating radar to characterize the subglacial properties of ice sheets (e.g. Reference Shabtaie, Whillans and BentleyShabtaie and others, 1987; Reference Bentley, Lord and LiuBentley and others, 1998; Reference Gades, Raymond, Conway and JacobelGades and others, 2000; Reference Catania, Conway, Gades, Raymond and EngelhardtCatania and others, 2003; Reference Raymond, Catania, Nereson and Van der VeenRaymond and others, 2006; Reference Jacobel, Welch, Osterhouse, Pettersson and MacGregorJacobel and others, 2009; Reference LangleyLangley and others, 2011) and glaciers (e.g. Reference Copland and SharpCopland and Sharp, 2001; Reference Pattyn, Nolan, Rabus and TakahashiPattyn and others, 2005, Reference Pattyn, Delcourt, Samyn, Smedt and Nolan2009; Reference Gades, Raymond and ConwayGades and others, 2012). Most of these studies have been conducted on ice masses with little temperate ice content, and high BRP has been linked to temperate basal conditions (e.g. Reference Bentley, Lord and LiuBentley and others, 1998; Reference Gades, Raymond, Conway and JacobelGades and others, 2000; Reference Catania, Conway, Gades, Raymond and EngelhardtCatania and others, 2003), enhanced sliding (e.g. Reference Pattyn, Nolan, Rabus and TakahashiPattyn and others, 2005, Reference Pattyn, Delcourt, Samyn, Smedt and Nolan2009) and the presence of subglacial water (e.g. Reference Shabtaie, Whillans and BentleyShabtaie and others, 1987; Reference Copland and SharpCopland and Sharp, 2001; Reference LangleyLangley and others, 2011). Investigation of the temperate Black Rapids Glacier, Alaska, USA, by Gades and others (2012) is an exception to this, in which variations in BRP revealed more about the distribution of till at the bed than changes in basal hydrological conditions.
While the BRP measured at a radar receiver is assumed to be related to bed properties or hydrology, it is also affected by ice thickness, temperature and composition (e.g. Reference Robin, Evans and BaileyRobin and others, 1969; Reference Winebrenner, Smith, Catania, Conway and RaymondWinebrenner and others, 2003; Reference MacGregor, Winebrenner, Conway, Matsuoka, Mayewski and ClowMacGregor and others, 2007; Reference MatsuokaMatsuoka, 2011). It is common to deal with the ice-thickness effect by applying a correction, which may involve judiciously chosen subsets of the data (e.g. Reference Gades, Raymond, Conway and JacobelGades and others, 2000). Interpretations related to basal conditions are then made on the basis of corrected BRP, either using interpolated maps of BRP (e.g. Reference Copland and SharpCopland and Sharp, 2001) or BRP extracted along a transect (e.g. Reference Gades, Raymond, Conway and JacobelGades and others, 2000; Pattyn and others, 2009).
We use radar data from a surge-type polythermal glacier in Yukon, Canada, to investigate whether BRP provides insight into the present flow regime, which is characterized by high rates of basal motion over a well-defined region (Reference De Paoli and FlowersDe Paoli and Flowers, 2009). We first explore the relationship between raw BRP and variables that have been hypothesized or demonstrated to influence bed reflectivity. After applying an ice-thickness correction, we use an unsupervised image-classification algorithm to segment the glacier into contiguous areas defined by similar BRP. Using an automated-segmentation scheme both reduces the dimensionality of the dataset and avoids some sources of interpretation bias. We interpret the results in light of what is known about the thermal, hydrological and dynamical regime of the glacier.
Study Site
The study glacier is located in a subarctic environment in the St Elias Mountains of Yukon (Fig. 1). It spans an elevation range of 1970-2960 m a.s.l., has an equilibrium-line altitude (ELA) of ~ 2550 m a.s.l., occupies an area of 5.3 km2 and is up to 200 m thick. Using ice-penetrating radar and borehole thermometry, Reference Wilson and FlowersWilson and others (2013) documented a polythermal structure in which temperate ice from the accumulation area gives way to cold ice near the glacier terminus, but were unable to determine precisely how far down-glacier temperate basal conditions extend. Forward (Reference Flowers, Pimentel and SchoofFlowers and others, 2011) and inverse (Reference De Paoli and FlowersDe Paoli and Flowers, 2009) modelling using surface velocity measurements suggests a flow regime dominated by sliding and/or bed deformation over the central region of the glacier which has been interpreted as a ‘slow surge’ (Frappé and Clarke, 2007). While this site was originally selected for a comparative glacier mass-balance study (e.g. Reference MacDougall and FlowersMacDougall and Flowers, 2011), its current dynamics present an interesting opportunity to examine BRP in a polythermal glacier for the signatures of bed thermal state and hydrological regime.
Study area. Inset shows location (open circle) in the St Elias Mountains of southwest Yukon, Canada. (a) Contours of glacier surface elevation, with approximate ELA shown as a dashed line. Plan-view distribution of temperate ice from Reference Wilson and FlowersWilson and others (2013) is shaded. Arrows indicate annual surface flow velocities measured at a network of stakes from 2006 to 2011. (b) Ice thickness. The approximate region of enhanced basal flow (Reference De Paoli and FlowersDe Paoli and Flowers, 2009) is delimited in (a) and (b) with straight bold lines.

Methods
Data collection and processing
Ice-penetrating radar data were collected in spatially overlapping surveys in May of 2008, 2009 and 2011 with the system described by Reference Mingo and FlowersMingo and Flowers (2010) (see Table 1). We use an impulse transmitter (Reference Narod and ClarkeNarod and Clarke, 1994) with resistively loaded dipole antennas of 10 MHz centre frequency in the transmitting unit, while identical antennas and a computer-controlled digitizer comprise the receiving unit. Based on the width of reflected pulses, we estimate the range resolution to be 10-12 m (half the pulse width, assuming a wave speed in ice of 1.68 x 10⁸ms–1).
Radar system components and specifications for surveys conducted in 2008, 2009 and 2011

In 2008-09, we employed an 8-bit NI-5133 digitizer, which has a 50 MHz bandwidth for all but the lowest voltage input range. At the lowest input range, corresponding to the highest receiver gain, bandwidth is reduced to 35 MHz. In 2011 we used a 100MHz bandwidth 12-bit Pico-4227 digitizer to accommodate antennas with higher centre frequencies (>35MHz) which we used for other purposes (Reference Wilson and FlowersWilson and others, 2013). The Pico-4227's 12-bit analog-to-digital converter allowed a significant increase in the lowest detectable voltage (‘noise floor’): 24 μV compared with 156μV for the 8-bit digitizer. For both digitizers, the optimum device input range was used to calculate the minimum detection level: 100 mV peak-to-peak and 40 mV peak-to-peak, respectively for the Pico-4227 and the NI-5133. The ability of the Pico-4227 to store all traces within a given stack in its onboard memory before transferring data to the computer, in contrast to the NI-5133 which must transfer each trace individually, in principle increases the horizontal resolution in the survey direction by reducing the distance travelled between stacks.
A USB-powered wide area augmentation system (WAAS)-capable GPS receiver with NMEA0183 data output provided geolocation. We mapped glacier surface elevations separately using real-time kinematic GPS. The radar data were processed using a de-mean (high-pass) filter and frequency-wavenumber migration. Migration can improve the horizontal resolution of a diffraction-limited system to a theoretical value of λ/2 (Reference Welch, Pfeffer, Harper and HumphreyWelch and others, 1998); in our case λ/2 = 8.4 m. No gain control was applied to the data, in order to avoid changing the BRP.
Calculation and classification of BRP
Following Gades and others (2000), we define BRP as
where a is the voltage measured at the receiving antenna, and sample numbers t 0 and t 1 together define a window along the fast time axis around the bed reflection. Gades and others (2000) use a summation window that is centred on the reflection waveform. Reference Copland and SharpCopland and Sharp (2001), by contrast, choose an asymmetric reflection window that begins 100 ns prior to the first peak in the reflected wavelet and continues 400 ns afterward. This larger window captures the full bed wavelet (Reference Copland and SharpCopland and Sharp, 2001), but potentially includes the effects of secondary reflections. We test a centred window chosen to fit the theoretical width of a single radar cycle (100ns) as well as the asymmetric window used by Copland and Sharp (2001). The choice to operate on data that have undergone two-dimensional migration is expected to have ramifications for the calculation of BRP on small horizontal scales, but based on tests with unmigrated data does not greatly alter the pattern of BRP at spatial scales greater than -20 m.
The reflections observed in 2011 are systematically brighter than those recorded in 2008-09. The transmitter and antennas were identical between all surveys, so differences in bed-reflection power could have arisen from (1) true temporal variations in BRP (e.g. Pattyn and others, 2009) between 2008-09 and 2011, (2) systematic differences in coupling between the antennas and the glacier between surveys or (3) differences in system power either transmitted or received. There is little reason to believe a systematic shift in bed character (and thus BRP) occurred between 2009 and 2011, or that coupling differed significantly between surveys, given the similar conditions under which they were conducted. Our metadata indicate that a 20MHz hardware-level filter was enabled 90% of the time with the NI-5133 digitizer, resulting in non-negligible signal attenuation at frequencies greater than 10 MHz. In an additional 5% of the data the lowest voltage input range was used, thus effectively reducing the bandwidth from 50 to 35 MHz. Given the broadband response of resistively loaded dipole antennas, and based on spectral analyses of sample radargrams with and without the filter enabled, we hypothesize that the differences in digitizer bandwidth and the use of the NI-5133 hardware filter are together largely responsible for the significant differences in BRP between the 2008-09 and 2011 datasets. Despite some uncorrected inconsistencies within 10% of the 2008-09 dataset, we find that regions of the bed that appear systematically bright (high BRP) in our final results are independently bright in all years (2008, 2009, 2011) when considered separately.
In light of the foregoing discussion, spatial consistency in BRP measurements from different surveys is substantially improved if we normalize BRP independently for 2008-09 and 2011. The 2011 survey covered all accessible regions of the glacier, as did the combined surveys of 2008-09; our approach to normalization should not, therefore, introduce spatial bias in the dataset. Alternative, but less successful, approaches tested include combining all data directly or normalizing by year rather than instrumental configuration. This normalization is done separately from correcting for attenuation through the ice column (described below).
We experiment with various methods of identifying spatial patterns in BRP. First we highlight regions above a prescribed threshold. In a second method, we partition the glacier into contiguous regions of distinct BRP by interpolating the data across the glacier bed and using a spectral-clustering routine (e.g. von Luxburg, 2007) implemented as part of the scikit-learn project. Spectral clustering has been developed in the machine-learning community and permits a body of data to be divided into a prescribed number of clusters, k, by partitioning a similarity graph, 𝒢, such that connections between clusters have low weight. Because the cluster selection is automatic, it avoids human bias in selecting data subsets. For spatial data such as BRP distribution, individual clusters are defined as contiguous spatial patches comprising pixels whose interconnections have higher weights (reflecting similar values of BRP in adjacent pixels) than the connections between pixels identified as separate clusters. The similarity graph, 𝒢, encodes a representation of the connection weights between adjacent pixels in the dataset. There are numerous methods by which to partition the similarity graph into clusters. Reference Von LuxburgVon Luxburg (2007) gives a useful tutorial-based review of spectral-clustering methods, while scikit-learn is a package that provides the spectral-clustering algorithms used here.
For this application, we first construct 𝒢 by creating network connections between 50 m x 50 m pixels in the gridded BRP map and adjacent pixels (von Neumann neighbourhood). We then apply weights, Wi , as a function of the BRP difference, ΔBRP, between each pixel and the standard deviation across all of the connections in 𝒢:

with i an integer referencing the image pixel (graph node) and β = 10 a scaling parameter that controls the steepness of the weighting function. The weighting for small ΔBRP increases with the value of β.
Empirical predictors of BRP
We compare the BRP dataset to ice thickness, h, ice-thickness gradient, ∣∂h/∂l∣ where l is distance in the direction of maximum thickness gradient, and radar-scattering-layer thickness, s. Each of these comparisons is motivated by the hypothesis that raw BRP may be enhanced or diminished as a function of these variables. The existence of a functional relationship between ice thickness and radar wave energy is well known (e.g. Reference Bogorodsky, Bentley and GudmandsenBogorodsky and others, 1985), while the ice-thickness gradient is the quantity that correctly represents apparent bed slope, or bed slope relative to the ice surface. Ice thickness is determined from the same radar data that are used to calculate BRP, and interpolated to create a digital model on a 20 m x 20 m grid. Assuming that the glacier bed has some specular reflection characteristics, apparent bed slope (or ice-thickness gradient) would be expected to correlate with reduced BRP.
Losses due to internal scattering can be neglected in some settings (e.g. Pattyn and others, 2009), but it is not known whether they need to be considered in glaciers with significant volumes of temperate ice. We calculate scattering-layer thickness as a proxy for internal losses by mapping the upper surface of the radar-scattering layer observed over most of the glacier (Reference Wilson and FlowersWilson and others, 2013) and assuming this layer extends to the bed. To identify the scattering layers within each transect, we first high-pass filter the data and then plot voltage magnitude to enhance the internal contrast within each section. The upper horizon of the scattering layer within a given radargram is then manually digitized (see Reference Wilson and FlowersWilson and others, 2013, for details). Scattering-layer thickness is then defined as the depth from the scattering surface down to the bed reflection.
Finally, in an attempt to relate BRP to basal hydrological conditions (e.g. Reference Copland and SharpCopland and Sharp, 2001) we calculate subglacial fluid potential (Reference ShreveShreve, 1972),
with gravitational acceleration g = 9.8 ms–2, bed elevation z, densities of water ρw = 1000 kg m–3 and of ice ρi = 910kgm–3 and f = [0,1], where f = 1 represents the hydrostatic assumption. We then compute the upstream area (UA) based on Φ with 0 ≤ f ≤ 1, using an iterative pit-filling scheme applied to the fluid potential (Reference Wang and LiuWang and Liu, 2006) followed by the D-∞ flow-routing algorithm (Reference TarbotonTarboton, 1997). The flow-routing algorithm computes the total area ‘upstream’ of each node, where that area is equal to the number of upstream pixels multiplied by pixel area. Fluid potential, Φ, is used only to define flow direction, so the upstream area has dimensions of length-squared. To suppress the dominant downslope control on the upstream area and to reduce its sensitivity to uncertainties in the bed map, we compute
where CA is a control area chosen such that UA/CA is a dimensionless quotient.
As a crude metric to evaluate the correlation between regions of high BRP and regions that may be preferentially connected to the subglacial drainage system, we calculate the mean of Uc over all pixels where average BRP is above a prescribed threshold and normalize this quantity, Uc + , by the mean over the entire glacier bed, Ū c :
The dimensionless E is then one possible measure of the increased likelihood of high BRP being measured over pixels with high upstream area. E = 0 indicates no preferential association between high BRPand high Uc. To compute Uc + , we identify locations with BRP values in the 70th percentile or above after BRP has been averaged at a scale of 50 mx50 m.
To determine the robustness of E as a correlation metric, we perform a suite of Monte Carlo simulations in which we randomly shuffle the gridded BRP values in space and then recalculate E. By performing this operation many times, we can determine the expected variance in a randomly distributed field, which allows us to evaluate whether our real results exhibit a significantly greater correlation with upstream area than random distributions of BRP. We find that performing 3 x 10⁴ simulations leads to a convergence of the variance toward a constant value.
Results and Discussion
Sensitivity of BRP to summation window
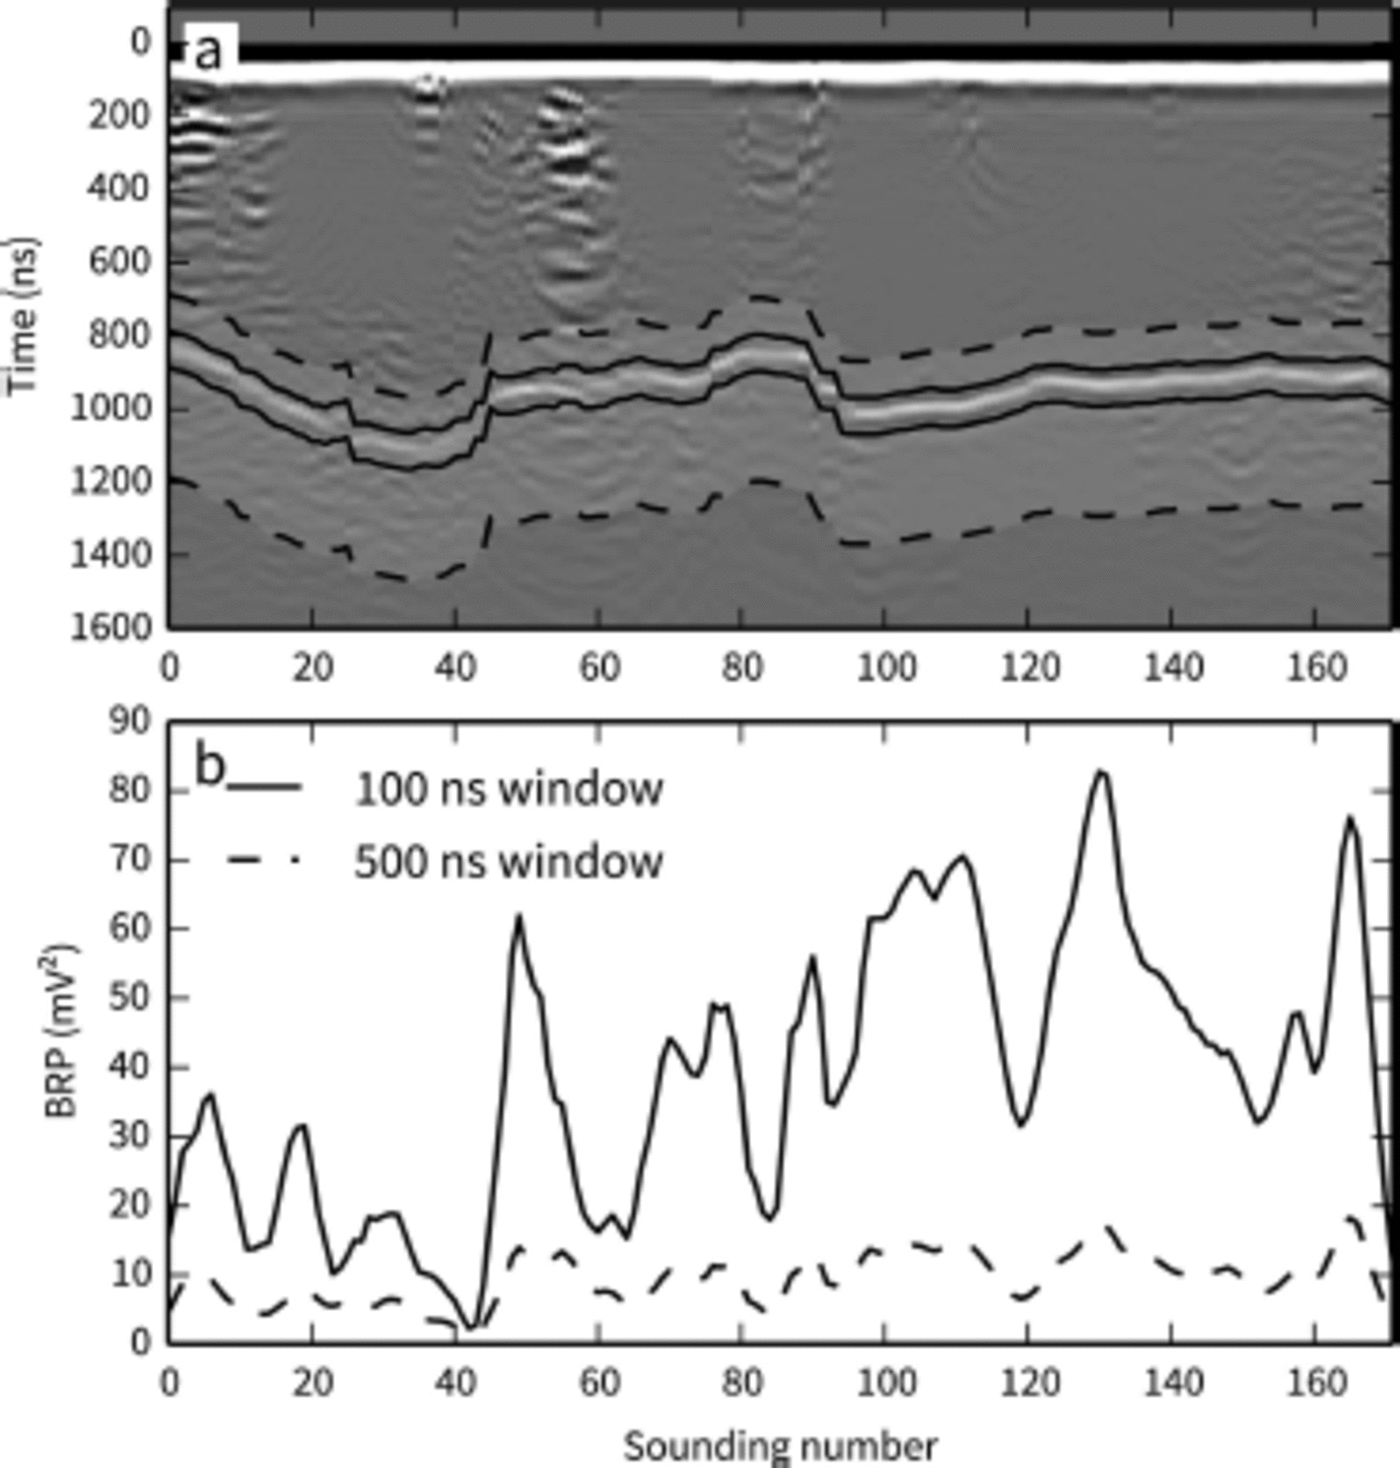
The general structure of the BRP is similar using the different summation windows, with the larger (500 ns) window producing systematically lower BRP (Fig. 2). Although larger summation windows capture additional reflections that follow the chosen bed reflection, the 500 ns window is sufficiently large that calculated BRP is always lower than that computed with the 100 ns window. We adopt the 100 ns window for all subsequent calculations.
Summation windows used to calculate BRP. (a) Summation windows shown on a sample radargram. (b) Corresponding BRP. Solid curve shows the summation window symmetric about the bed reflection and equal to the theoretical width of a single radar cycle. Dotted curve shows the asymmetric window used by Reference Copland and SharpCopland and Sharp (2001) on John Evans Glacier.
Relationship of BRP to hypothesized predictors
We find an approximately exponential relationship between BRP and ice thickness (Fig. 3a), although variability due to other factors is high. The large degree of scatter is not surprising for a polythermal glacier with complex bed geometry: temperature variations and changes in bed angle and roughness will influence the attenuation rate of radar waves in ice and the energy reflected toward the receiving antennas, respectively. Correlation between BRP and variables other than ice thickness is much weaker. The thickness of the englacial scattering layer (Fig. 3b) appears to be correlated with BRP, but this is due to the correlation between ice thickness and BRP (Fig. 3a) and the correlation between ice thickness and scattering thickness (not shown). When BRP is corrected for ice thickness, the correlation with scattering thickness vanishes. BRP decreases only weakly with ice-thickness gradient (Fig. 3c) (cf. Reference Copland and SharpCopland and Sharp, 2001).
Scatter plots of BRP and variables demonstrated or hypothesized to influence BRP measurements. (a) Ice thickness, h. Black dots represent a subset of the data where no internal scattering is observed. R2 refers to the coefficient of determination. (b) Normalized thickness of internal scattering layer. (c) Magnitude of ice-thickness gradient, ∣dh/d∣ (apparent bed slope).

Performing a multiple regression of BRP on h or any of the other variables discussed above does not meaningfully improve the predictability of BRP. We therefore conclude that of the variables tested, ice thickness alone provides the best avenue for a correction to the raw data. To characterize spatial variability in basal conditions in the next section, bed-reflection power is corrected by an exponential model intended to account for signal attenuation within the ice column due to absorption and reflection as well as geometric spreading (Reference Gades, Raymond, Conway and JacobelGades and others, 2000):
with adjustable parameter, b = -0.036 m–1, used to minimize squared residuals. This is equivalent to the fitting approach used by Reference Gades, Raymond, Conway and JacobelGades and others (2000), with the exception that we use the entire dataset to derive the correction. Although BRPcorr remains a dimensionless scale of bed reflectivity, it can take on values greater than 1.
We have experimented with modified correction techniques, such as selecting subsets of the data in deriving the ice-thickness correction on the basis of signal uniformity (e.g. Reference Gades, Raymond, Conway and JacobelGades and others, 2000), proximity to the flowline (e.g. Pattyn and others, 2009) or low internal reflection power (e.g. Reference Copland and SharpCopland and Sharp, 2001). We find that these techniques do not yield better correlations between BRP and ice thickness for our data.
Spatial pattern of corrected BRP
High values of BRP are found preferentially in the central ablation area of the glacier (Fig. 4), while isolated lines of high BRP are also observed in the accumulation area. The heterogeneous nature of the BRP data makes manual delineation of the glacier into regions characterized by different bed reflectivity difficult and subjective. Analysis using spectral clustering also identifies a zone of high BRP in the central region of the glacier (Fig. 5), though its expression varies with the prescribed number of segments, k.
BRP corrected for ice thickness. (a) All data averaged at a scale of 50 m x 50 m. Greyscale shows dimensionless values of BRPcorr from Eqn (6). (b) BRP higher than the 70th percentile shown in black with all other values in grey. (c) Same as (b) for the 80th percentile. (d) Same as (b) and (c) for the 90th percentile. The approximate region of enhanced basal flow is delimited in all panels with straight bold lines.

Classification results based on corrected BRP using spectral clustering. Numbers indicate the mean value and standard deviation of BRPcorr within the region. The approximate region of enhanced basal flow is delimited by straight bold lines.

When the central region is partitioned into more than one segment (i.e. for k > 8) higher BRP values are found in the western half of this region, reflecting generally higher measured BRP there and a broader swath of high BRP values (Fig. 4).
The glacier terminus is consistently partitioned as a region of low BRP in this analysis. The paucity of data in certain areas (Fig. 4) suggests that caution should be used in interpreting Figure 5. For example, the uppermost glacier shows consistently high BRP, yet the sampling density in this area is relatively low. Likewise the western tributary is an area of low BRP but also suffers from a low sampling density. Owing to the omnidirectional antenna radiation patterns in the across-track direction, across-track off-nadir reflections may also have some influence on calculated BRP that we are unable to correct for. This comprises an additional source of uncertainty that would express itself most strongly in the presence of steep across-track bed slopes. Inspection of the bed topography (Reference WilsonWilson, 2012) alongside the BRP maps suggests that steep slopes and high BRP coincide in several areas (e.g. in the uppermost reaches of the glacier). Other regions of higher BRP appear unrelated to steep bed slopes, including those in the western half of the central region of the glacier.
The use of differently sized summation windows creates small differences in the segmentation results; however, the general patterns reported above are persistent. Higher values of the parameter β (Eqn (2)) increase the segmentation sensitivity to BRP variations over short distances. This, in turn, increases the likelihood that localized areas of anomalous BRPare separately classified. Small values of β de-emphasize the importance of BRP magnitude relative to segment spatial continuity, resulting in more uniformly sized segments.
Interpretation
Generally low values of BRP near the glacier terminus are consistent with the thin (<75 m) and radar-transparent (cold) ice found there (Reference Wilson and FlowersWilson and others, 2013). Surface flow speeds in this region are low, generally ≤5ma–1 (Reference De Paoli and FlowersDe Paoli and Flowers 2009). The thin ice in this region permits rapid heat loss to the atmosphere, driving the bed toward subfreezing temperatures (Wilson and Flowers, 2013; Reference Wilson and FlowersWilson and others, 2013). During the melt season channelized drainage is observed at the glacier terminus, and a collapse feature in the glacier surface has revealed water flowing at the bed some distance (~500 m) upstream of the terminus. These anecdotal observations, combined with the generally low BRP in this area, suggest that subglacial water near the terminus is confined to limited areas of the bed. Inter-annually persistent moulins over the lower kilometre of the glacier, where the ice is thin and deformation rates low, also argue for localization of basal water.
The western tributary, occupying a largely sheltered cirque, is a region characterized by low BRP. Generally low rates of surface ablation in this area (Reference MacDougall and FlowersMacDougall and Flowers, 2011) would limit the influx of water and release of latent heat into the snowpack, and therefore support cold conditions over at least part of the glacier bed. High BRP in the uppermost reaches of the glacier (Fig. 5) seems to support a temperate bed, which is consistent with observations of englacial radar scattering throughout much of the ice column (Reference Wilson and FlowersWilson and others, 2013).
The central region of the glacier delineated in Figures 1, 4 and 5 is characterized by a dynamic regime in which basal flow rates (sliding and/or substrate deformation) presently accommodate 50–100% of measured surface motion (Reference De Paoli and FlowersDe Paoli and Flowers, 2009). Forward modelling has shown this motion to be consistent with elevated basal water pressures (Reference Flowers, Pimentel and SchoofFlowers and others, 2011) facilitating basal lubrication. We might therefore expect higher values of BRP in this region, which has been interpreted to be surging (Reference De Paoli and FlowersDe Paoli and Flowers, 2009). Figures 4 and 5 provide some evidence for this, though in both analyses the onset of high BRP occurs down-glacier of the onset of high basal flow. Significant crevassing in this area is a source of radar clutter, which may depress the measured BRP, highlighting a potential shortcoming of our simple correction based on ice thickness alone. High values of BRP downstream of the region of high basal flow (Figs 4 and 5) may indicate temperate bed conditions below the transition identified as the ‘surge front’, consistent, at least in part, with the findings of Reference Wilson and FlowersWilson and others (2013) (see shading in Fig. 1a).
An association between high BRP and enhanced basal motion could be corroborated by a correlation between high BRP and basal lubrication. Subglacial hydraulic upstream area (Fig. 6) may be a proxy for either enhanced or reduced basal lubrication, depending on the propensity for efficient drainage system development. Near the glacier terminus, the upstream area (Uc in Fig. 6) is more likely to indicate favourable locations for channel development; further upstream, higher Uc may indicate areas of preferential lubrication. The greater number and width of high upstream-area features in the western half of the central region suggest broader or more numerous subglacial pathways. This subglacial hydraulic geometry may contribute to the generally higher BRP in the western, compared to the eastern, region of the central glacier (Fig. 5; k ≥ 8).
Maps of subglacial hydraulic upstream area and correlation with corrected BRP. (a) Relationship between regions of high BRP (BRPcorr above 70th percentile) and regions of high upstream area, quantified by E (Eqn (5)), for a range of flotation fractions, f (circles). Shaded contours indicate standard deviations of E of 1-3σ, based on Monte Carlo simulations in which measured values of BRP are randomly shuffled in space. (b) Uc (Eqn (4)) for flotation fraction f = 0.5 (Eqn (3)). (c) Same as (b) for f= 1. The central region of enhanced basal flow is delimited with straight bold lines in (b) and (c).

On a glacier-wide basis, Figure 6a shows that the correlation between high BRP and high Uc , as described by the metric E (Eqn (5)), is positive for any value of the flotation fraction, f. For f > 0:35, E is above the 3σ level for randomly generated results and we calculate the likelihood of a random realization of E to be 1 :2500. While upstream area is limited to describing highly simplified geometric controls on subglacial water flow, Figure 6a shows a statistically significant spatial coincidence of high BRP and high values of Uc , hinting at some relationship between BRP and basal lubrication. Whether BRP provides additional insight into the complex relationship between fast flow and subglacial conditions cannot be unambiguously established here (cf. Reference MatsuokaMatsuoka, 2011). Despite this, it is intriguing to find elevated BRP where we know significant sliding and/or substrate deformation to be occurring.
Conclusion
We have calculated BRP from 10 MHz ice-penetrating radar data covering most regions of a small surge-type polythermal glacier. While thermal and compositional variations are known to affect radar attenuation (e.g. Reference MatsuokaMatsuoka, 2011), we did not find significant relationships between BRP and various proxies for englacial properties in the polythermal glacier investigated. Using an automated-segmentation scheme offers an objective means of partitioning the glacier into regions of high and low BRP, and provides a complement to the spatially averaged but uninterpolated pattern of BRP. For most values of the segmentation parameter, k, this analysis indicates a region of high BRP that overlaps a zone of high sliding/bed deformation previously interpreted as a slow surge (Reference De Paoli and FlowersDe Paoli and Flowers, 2009). High values of BRP were found elsewhere, where sliding/bed deformation plays a much smaller role but where temperate basal conditions are nevertheless expected. Glacier-wide correlations between high BRP and high values of subglacial hydraulic upstream area may be suggestive of a relationship between BRP and basal lubrication, though establishing the validity of such a relationship would require additional independent data. Though many of our results can be intuitively explained, the ambiguities that remain may allude to BRP being a better indicator of subglacial conditions for predominantly cold glaciers than for glaciers with a significant content of temperate ice.
Acknowledgements
This work was carried out with the permission of the Kluane First Nation, Parks Canada and the Yukon Territorial Government. The Polar Continental Shelf Program (PCSP) and the Kluane Lake Research Station (KLRS) provided support with field logistics. We are grateful for field assistance from numerous people, particularly Alex Jarosch and Flavien Beaud. Whistler–Blackcomb Resort facilitated field-testing of our radar equipment. Research funding was provided by the Natural Sciences and Engineering Research Council of Canada (NSERC), Simon Fraser University (SFU), the SFU Community Trust Endowment Fund, the Canada Research Chairs Program and the Canada Foundation for Innovation. Three anonymous reviewers made suggestions that led to an improved manuscript.


