


Nothing disturbs confidence as much as monetary experiments.
– Leonardus Trip, president of De Nederlandsche Bank(authors’ translation, De Locomotief, 5 February 1935)I
While countries were rapidly abandoning the gold standard in the early 1930s, a succession of Dutch governments remained fixated on preserving the fixed guilder–gold exchange rate. They saw the continued adherence to the gold standard in almost religious terms, and their belief in the stabilising power of gold remained unchecked because they were able to exploit domestic political institutions to pacify any opposition to their policy stance. This context left those tasked with implementing monetary policy – principally the Netherlands’ central bankers working at De Nederlandsche Bank (DNB) – with the gargantuan task of maintaining the status quo while the status was decidedly no longer quo. We ask: how were Dutch central bankers able to remain on the gold standard all the way until its collapse in September 1936?
The current consensus is that the gold standard limited the degrees of freedom available to policymakers by tying their economy's fate to their currency's fixed exchange rate – referred to as ‘golden fetters’ (Eichengreen Reference Eichengreen1992; Eichengreen and Temin Reference Eichengreen, Temin, Crafts and Fearon2013). Our analysis of the Dutch case is consistent with this view. But we also show how the interwar gold standard had sufficient in-built flexibility for policymakers to ‘go Dutch’ and ‘bend’ the rules – which augments the view (due to Bordo and Kydland Reference Bordo and Kydland1995) that the gold standard represented a policy rule that only offered flexibility when it was temporarily suspended with a credible commitment of reinstatement. Instead, our analysis demonstrates that the gold standard rule was not a binding constraint for the Netherlands; this small open economy enjoyed sufficient autonomy to execute policies designed to ensure continued financial and exchange rate stability, all while remaining firmly within the gold bloc. This finding is closest to Bazot et al. (Reference Bazot, Bordo and Monnet2016, Reference Bazot, Monnet and Morys2019) – and Nurkse (Reference Nurkse and Brown1944) before them – who document ways in which policymakers could ‘massage’ the gold standard from inside the system.
How did this flexibility-within-the-rules manifest itself? Following the UK's decision to devalue sterling, we document that the Netherlands’ central bankers were able to drive their policy rate away from the most important international policy rates by employing a sophisticated suite of policy measures that together limited capital mobility. We conclude that DNB officials were willing, and crucially also able, to use practically any means necessary to remain on gold. We then calculate the cost of DNB's policy prowess: the degree to which the Dutch economy underperformed.
We contribute to the literature on fixed exchange rate regimes in three ways. First, our analysis constitutes an exploratory case study as we describe the full policymaking process through to its operationalisation by drawing on both quantitative and qualitative sources. Second, our analysis is a unique case study because the Dutch were among the first to rejoin and the last to leave the interwar gold standard. Third, our case allows us to ‘test’ one of the cornerstones of macroeconomic theory: the policy trilemma, illustrated in Figure 1 (Mundell Reference Mundell1960, Reference Mundell1961; Fleming Reference Fleming1962). Combining archival material with high-frequency macroeconomic data permits us to assess the trade-offs DNB officials faced between 1925 and 1936 when balancing independent monetary policy (i.e. the central bank's ability to drive local interest rates away from those of its major trading partners) with free capital mobility (e.g. permitting arbitrage on domestic gold markets).
The Mundell–Fleming monetary policy trilemma
Note: Countries must choose any two from the three policy options. In a fixed exchange rate regime, a country must either sacrifice its independent monetary policy, or restrict capital mobility.

Many empirical contributions to the literature on monetary policy under fixed exchange rate regimes are historical in nature. Scholars remain particularly fascinated by metallist monetary systems like gold standards. The classical gold standard (1870–1914) is typically framed as a piece of successful policymaking (Bordo and Rockoff Reference Bordo and Rockoff1996; O'Rourke and Williamson Reference O'rourke and Williamson2001; López-Córdova and Meissner Reference López-Córdova and Meissner2003; Officer Reference Officer and Whaples2008). Meanwhile, the interwar gold standard (1925–36) is presented as a policy failure, even as a major cause of the Great Depression (Temin Reference Temin1976). At the very least, it is argued to have inhibited policymakers from fighting the effects of the Great Depression (Eichengreen Reference Eichengreen1992). A direct link between the standard and the banking crises of the 1930s has also been established (Bernanke and James Reference Bernanke, James and Hubbard1991).
Most contributors agree that the interwar standard suffered from the absence of a strong ‘monetary hegemon’ (Kindleberger Reference Kindleberger1986), leading to a lack of international policy coordination (Eichengreen Reference Eichengreen, Buiter and Marston1984), and the subordination of gold convertibility to other political priorities (Bordo and Kydland Reference Bordo and Kydland1995). Apolitical central banking did not help; countries with independent, technocratic, central banks had a preponderance to choose damaging deflationary policies (Simmons Reference Simmons1996). The interwar gold standard's eventual collapse has been attributed to different factors in different countries, including their domestic political economy (e.g. Wandschneider Reference Wandschneider2008), and the pressures of currency speculation (e.g. Wolf Reference Wolf2008). There exists a broad consensus that the gold standard was a key cause of the collapse of the global economy during the Great Depression, and that leaving the gold standard was a necessary condition for recovery (Eichengreen and Temin Reference Eichengreen and Temin2000). We describe how DNB navigated a destabilised fixed exchange rate regime, all the way until the very end of the regime's lifespan. We show that in the absence of a monetary hegemon, the Netherlands’ central bank was willing and able to go it alone.
The techniques used by central banks to achieve policy autonomy under metallist monetary systems have already been the subject of academic enquiry. Works typically consider convertibility restrictions, foreign exchange interventions and domestic lending policies. Bazot et al. (Reference Bazot, Bordo and Monnet2016, Reference Bazot, Monnet and Morys2019), who review this literature for the classical gold standard era, conclude that countries were successfully able to use these techniques to isolate their domestic economy from foreign shocks. But while Belgium's central bank has received the attention of Ugolini (Reference Ugolini2012) for the classical gold standard and Van der Wee (2012) for the interwar standard, no modern study has explored the neighbouring Dutch case in this context. Conceptually similar to our study is Hsieh and Romer (Reference Hsieh and Romer2006), who demonstrate how US central bankers managed to implement an expansionary monetary policy in 1932 while remaining on gold. Like us, they show that the gold standard was not a binding constraint. Related contributions on other country case studies include Mouré (Reference Mouré2002) on France, and Straumann (Reference Straumann2010) on Switzerland.
While policy autonomy has not been a focus to date, the Dutch experience of the interwar gold standard has been the subject of several important studies. Contributions to an edited volume (Griffiths Reference Griffiths1987) highlight the fact that Dutch support for this exchange rate regime came from diverse interest groups, even though it put most at an economic disadvantage. In particular, Schoorl (Reference Schoorl and Griffiths1987) argues the Netherlands’ most influential economists prioritised moral over economic considerations, which meant leaving gold was considered akin to defaulting on sovereign debt obligations. De Vries (Reference De Vries1989, Reference De Vries1994) focuses on the actions of key policymakers during the successive central bank presidencies of Gerard Vissering (1912–31) and Leonardus Trip (1932–41), largely absolving them of culpability for the consequences of their policy choices because they were considered best practice at the time. Langeveld (Reference Langeveld2004) focuses on the politics of Hendrikus Colijn, who as the Netherlands’ finance minister – and subsequently as prime minister – was an ardent proponent of the gold standard. Most recently, Straumann (Reference Straumann2010) revisited the argument that the conservative mentality of Dutch policymakers inhibited them from responding to the decline of the gold standard.
Research by Joost Jonker and Jan Luiten van Zanden constitutes a particularly important contribution to the Dutch historiography. Jonker and Van Zanden (Reference Jonker, Van Zanden and Feinstein1995) argue that the Netherlands avoided a financial crisis during the Great Depression, not because of any active policy decision, but rather because it had experienced one in the early 1920s; the banking system had already undergone the reforms necessary to withstand further adversity and so the government could continue its (monetary) policy unabated. Meanwhile, Jonker (Reference Jonker1996) tracks DNB's haphazard institutional evolution towards modern central banking up to 1930, arguing that the bank struggled to overcome conflicts of interest arising from its dual status as the government's bank and a private profit-making business organisation. Finally, Van Zanden (Reference Van Zanden and Van Zanden1996) links the Netherlands’ adherence to gold with the country's poor performance during the 1930s, concluding that the policy to remain on gold was probably a mistake.
We contribute by showing how the Dutch, with DNB at their helm, remained on the gold standard all the way to September 1936. We document the dynamics of monetary policy management across the interwar period. Our focus on monetary policy implementation and operationalisation also adds a new dimension to analyses of the interwar gold standard in general. We reveal how a central bank created and exploited policy tools designed to deliver on a promise of financial and exchange rate stability. We expose how a small and open economy – a class of economy typically considered most vulnerable to international economic fluctuations – was able to exert considerable monetary policy autonomy.
We find that DNB reacquired its monetary policy independence following sterling's devaluation in 1931. DNB then used this independence to stabilise the guilder's exchange rate and ensure domestic financial stability. It negotiated formal international agreements with other central banks to offset temporary exchange rate deviations. It also struck informal agreements with domestic banks, obliging them to seek permission to transport gold internationally and forbidding them to speculate against the guilder. As of about May 1931, DNB started to hoard gold and eliminated arbitrage opportunities by seizing control of all trade in gold bullion.
But while DNB delivered on its promise to stay on gold, this policy choice created difficult trade-offs. We construct a counterfactual in which we examine what could have happened to the Dutch economy if the country had consistently followed the UK and the policies set by the Bank of England (BoE) from May 1931, the point at which DNB appears to have first changed its gold policy. This counterfactual suggests that Dutch policymakers could have avoided a deepening of the Great Depression. Going Dutch meant going it alone, irrespective of the policy choices of other countries. But going Dutch came at a cost, including sacrificing future economic prosperity.
Section II provides necessary historical and institutional context. Section III focuses on DNB's interest rate policy and Section IV on capital mobility policy. Section V evaluates DNB's policy framework in a counterfactual analysis. Section VI concludes. Appendix A describes DNB's use of other policy instruments; Appendix B presents international macroeconomic comparisons; Appendix C contains technical details on our counterfactuals (Appendices A–C are available online).
II
The UK returned to the gold standard in April 1925 at pre-war parity. It joined the US, which had re-entered in 1919, and the countries of Central and Eastern Europe, which were forced to join in 1924 to combat hyperinflation. The Netherlands followed the UK in its timing, and coordinated its policies with Australia, New Zealand, South Africa and the Dutch East Indies. By the end of 1925, some 35 currencies were officially or de facto convertible into gold (Eichengreen Reference Eichengreen1992, p. 192). Figure 2 reports the exchange rate of the Dutch guilder and key currencies between 1925 and 1936. The gold standard fixed exchange rates as soon as countries joined. They only increased in volatility after the UK left, in September 1931.
Exchange rate of the Dutch guilder (FL) (monthly frequency), 1925–36
Note: Depicted are the exchange rates (ln(1+r)) of the NL guilder expressed in UK pounds, US dollars, FR francs and DE reichsmarks. The vertical lines denote the date of the UK's departure from the gold standard in September 1931.
Source: Centre for Financial Stability, using Bohlin (Reference Bohlin, Edvinsson, Jacobson and Waldenström2010).

There were subtle, yet important, differences in the way countries linked their currencies to gold (Eichengreen Reference Eichengreen1992). The UK adopted a gold bullion standard; gold coin had been withdrawn from circulation and the BoE was no longer legally required to sell gold to the public. A second group, which included Belgium, adopted a gold exchange standard, by which a limited share of reserves could be held in the currencies of other gold standard members. The Netherlands was initially able to sustain a full gold coin standard, where anyone had the right to exchange their paper money for gold.
It was initially up to the Netherlands’ central bankers to judge the proportion of the money supply that was covered by gold and gold-backed foreign exchange. Then, in 1929, the Netherlands’ finance ministry insisted on 40 per cent backing – echoing US legislation (Friedman and Schwartz Reference Friedman and Schwartz1963, p. 149) – of which 80 per cent had to be held in the vaults of DNB (Vanthoor Reference Vanthoor2004, p. 133). But this was merely a formality; DNB's ample reserves meant that it easily achieved the reserve requirement. By its own admission DNB had a significant surplus of gold (DNB 1926). Political neutrality during World War I meant it had benefitted from an influx of gold as the Netherlands became a financial safe haven.
DNB officials faced three perennial concerns. The first was the exchange rate at which currencies rejoined gold. The Dutch rejoined at pre-war parity; the guilder was exchangeable for 0.6 grams of pure gold. The contemporary consensus was that sterling was overvalued by at least 10 per cent, and the French franc undervalued by the same amount (Irwin Reference Irwin2012). Some prominent Dutch economists, later famously including Jan Tinbergen, argued that the guilder was similarly overvalued (Tinbergen Reference Tinbergen1936, Reference Tinbergen, Klaassen, Koyck and Witteveen1959). The second concern was the absence of a strong monetary policy anchor. The BoE no longer had the capacity or authority to lead the world's central bankers (Kindleberger Reference Kindleberger1986). The lack of international policy coordination that resulted rendered it difficult for central bankers to maintain their policy regime's credibility (Bordo and Kydland Reference Bordo and Kydland1995; Obstfeld and Taylor Reference Obstfeld and Taylor2003).
The third, interrelated, concern was a perceived global shortage of gold and a ‘hot money problem’, where foreign-owned funds moved erratically from one financial centre to another in response to changing interest rates (James Reference James1992; Graff et al. Reference Graff, Kenwood and Lougheed2014). On the eve of the interwar standard, South Africa produced more than half of the global gold supply (Swanepoel and Fliers Reference Swanepoel and Fliers2021). This supply was then traded in London, effectively making the UK host to the financial centre of the interwar standard. However, the UK's poor export performance undermined attempts to re-establish its leadership position. Gold sterilisation policies in France and the US made matters worse (Friedman and Schwartz Reference Friedman and Schwartz1963, pp. 283, 297; James Reference James1992). By the 1930s, central banks were essentially competing with one another (Eichengreen Reference Eichengreen1992; Irwin Reference Irwin2012), and countries wishing to remain on gold consequently had to ‘go Dutch’ and solve problems independently.
Despite these three concerns, DNB was well equipped to fix the value of the guilder to gold, even after the UK had left the standard. While DNB's ample gold reserves were a necessary condition, they were not sufficient. Other important conditions were its government-given mandate, its domestic influence over other policy spheres, and its strong international reputation. DNB's domestic influence can be traced back to its founding in 1814, when the bank was established to improve the money circulation.Footnote 1 The bank was founded as a stock exchange-listed corporation with a profit motive and a government concession to operate as the country's sole bank of issue. The proto-central bank had a dual status as the government's bank, dutybound to fulfil public functions, and as a large commercial bank.
DNB was required to pay a percentage of its profits to the Dutch Treasury as part of its 1903 charter renewal. Successive finance ministers then surreptitiously bought up shares in DNB, which became a nationalised corporation in all but name (Petram Reference Petram2016, p. 228). While DNB had no de jure responsibilities as a lender-of-last-resort, the bank was forced into the role when it headed the syndicate that rescued the Dutch short-term money market during World War I (Jonker Reference Jonker1996). By the end of the war, DNB had firmly cemented its position at the head of the Dutch financial system. This position was largely based on informal arrangements and reputation.
DNB's 1918 charter renewal made its informal leadership position more formal (Van Zwet Reference Van Zwet2001). Aside from permitting it to invest its funds more flexibly throughout the Dutch economy, the new charter empowered central bankers to supervise the banking sector: (i) all of the country's financial institutions were obliged to send DNB any news of changes to their boards’ composition; (ii) DNB actively participated in the corporate policy formation of financial firms by parachuting its directors onto the boards of its clients; and (iii) DNB could choose the financial terms for its short-term debt instrument, its bill rediscounting facility (Colvin et al. Reference Colvin, De Jong and Fliers2015).Footnote 2 In return for its new powers, the charter increased the state's share of DNB's profits to 75 per cent (Van Zwet Reference Van Zwet2001).
During the banking crisis of the 1920s, DNB was instrumental in the rescue of several systemically important commercial banks (Colvin Reference Colvin2014). DNB's dual private and public objectives finally became irreconcilable and DNB was forced to pivot towards becoming a modern central bank (Jonker Reference Jonker1996). The most important subsequent change to the rules governing DNB's activities came in 1932, when a law was introduced to cover the recent losses DNB incurred on its foreign exchange holdings. Sterling's exit from the gold standard in September 1931 had taken officials at DNB and prime minister Charles Ruijs de Beerenbrouck's cabinet by surprise and led to enormous losses (De Vries Reference De Vries1989, pp. 441–84).Footnote 3 The government's willingness to support DNB highlights how essential it was, for political leaders, that the bank provided the nation with financial and exchange rate stability.
The most important political actor in the period under study was the politician Hendrikus Colijn – a former military officer and a long-time Royal Dutch Shell executive with close ties to the Nederlandsche Handel-Maatschappij, one of the Netherlands’ largest banks. He led the socially conservative Anti-Revolutionaire Partij (Anti-Revolutionary Party), and was finance minister during the 1920s banking crisis as part of a coalition government led by Ruijs de Beerenbrouck, the leader of the Roomsch-Katholieke Staatspartij (Roman Catholic State Party). Colijn then briefly became prime minister in 1925–6 and presided over the guilder's return to the gold standard. Following an interlude back in private business, he regained the role of prime minister from Ruijs de Beerenbrouck in 1933 and kept his cabinet leadership position until World War II (Langeveld Reference Langeveld2004).
In terms of Colijn's economics, De Vries (Reference De Vries and Noordegraaf1981, pp. 123–4) argues that he saw the gold standard as a ‘natural mechanism’ which acted as an economic anchor against inflation. This was the prevailing economic orthodoxy and much in line with the Austrian school perspective that was popular in the Netherlands (Dullaard Reference Dullaard1984). Colijn venerated gold standard membership and treated it as a matter of national prestige. To him, leaving the standard was equivalent to reneging on sovereign debt (Szàsz Reference Szász1995). Colijn believed the only moral course was to continue repaying the country's debt using the gold-backed currency it had initially been raised in; the guilder had to continue to be ‘as good as gold’.
The fact that other countries were leaving gold following the UK's departure only drove Colijn to double-down on his policy instruction to central bankers. In 1933 Colijn was quoted as saying ‘there will be no monetary policy experiments’ under his watch.Footnote 4 Colijn neutralised political opposition by bringing competitors into his cabinet. The most important example of this was appointing Max Steenberghe, a leading figure in the Catholic Party – then the single-largest party in parliament – to the role of trade and industry minister (Langeveld Reference Langeveld2004). Colijn did not change his views when Belgium was forced off the standard in 1935.Footnote 5 Later that same year, Colijn even coerced Queen Wilhelmina into delaying national elections after his cabinet temporarily collapsed by suggesting that she would otherwise cause the fall of the guilder.Footnote 6 On the eve of the collapse of the standard in 1936, Colijn wrote to the League of Nations about his continued unwavering belief in the power of gold: ‘my ideas are unchanged and I dare say: unchangeable’.Footnote 7
DNB stuck to its mandate throughout the interwar period, and never publicly contradicted Colijn's gold politics. In private, however, DNB officials voiced concerns about the incompatibility of the government's domestic agenda with the gold standard. An example of such incompatible policies include Colijn's decision to link agricultural subsidies with new policies aimed at reducing unemployment and deflating wages (Langeveld Reference Langeveld2004, pp. 98–9). Ernst Heldring, an influential financier and a DNB non-executive director, argued privately in January 1933 that the government had displayed very little leadership on the gold standard by refusing to debate its future.Footnote 8
DNB's influence over the private sector went far beyond its formal statutory powers. This can be partially inferred from the eminence of its directors and their connections. In 1925, DNB's board comprised 26 members, all of whom were people with substantial banking and industrial or political experience. DNB president Gerard Vissering had previously presided over the Vereeniging voor den Effectenhandel (stock traders’ association), and was a former director of the Amsterdamsche Bank (De Vries Reference De Vries2013b). DNB's vice-president, Samuel Pieter van Eeghen, was one of the most well-connected individuals of Dutch capitalism in the twentieth century (De Jong et al. Reference De Jong, Fliers and Westerhuis2021).
DNB's directors also enjoyed a large international network. Vissering was frequently invited to write opinions on matters of international coordination and economic policy. He was called to China in 1911 to advise on Chinese monetary policy (Vissering Reference Vissering1914; Matsuoka Reference Matsuoka1936). And in 1925, he was instrumental in providing the South African government with monetary policy advice, jointly with economists Edwin Walter Kemmerer and John Maynard Keynes (Richards Reference Richards1925; Swanepoel and Fliers Reference Swanepoel and Fliers2021).
Career central banker Leonardus Trip, Vissering's successor from 1931, further extended DNB's influence. He was installed on government advisory committees on domestic policy spheres unrelated to central banking – positions from which he advanced austerity politics and curtailed the expansionary fiscal policy measures advocated by some of Colijn's coalition cabinet colleagues (Nekkers and Salzmann Reference Nekkers and Salzmann1990; De Vries Reference De Vries1994, p. 89). He carved out an important niche using his position at the newly established Bank for International Settlements (BIS) to advance his views on independent central banking.Footnote 9 Trip's domestic and international profile enabled him to support his government and ensure that other policy areas were kept compatible with monetary policy.
III
We have described how the Dutch government remained enthralled by gold, and how DNB enabled this addiction. We continue by focusing in on the latter with an analysis of the day-to-day operationalisation of monetary policy. Central banks are typically confronted with three desirable, yet jointly unattainable objectives (see Figure 1): (i) to stabilise the exchange rate; (ii) to enjoy free international capital mobility; and (iii) to engage in monetary policy oriented towards domestic goals.Footnote 10 Following Shambaugh (Reference Shambaugh2004) and Obstfeld et al. (Reference Obstfeld, Shambaugh and Taylor2005), we assume that engaging in independent monetary policy is defined by a central bank's ability to drive local interest rates away from the market rate (or ‘world’ rate). Given that leaving the gold standard was not seriously considered as a policy direction, DNB consequently faced a dilemma rather than a trilemma: in a fixed exchange rate regime, the central bank was forced to choose between independent monetary policy and free capital mobility. That officials were themselves aware of this dilemma is evident from DNB's 1931–2 annual report: ‘It is often forgotten that the standard is only a means to an end, which finds its footing in sufficient freedom of international capital movement and a sufficient elasticity in the economic system of the different countries’ (authors’ translation, DNB 1932, p. 14).
DNB officials considered the UK, and to a much lesser extent the US, as the guilder's monetary policy anchor prior to 1931. When the Netherlands rejoined the gold standard in April 1925, DNB's annual report described how the value of the guilder should be benchmarked against the pound and the dollar (DNB 1925). DNB president Vissering communicated this policy to the public: ‘Dutch monetary policy should principally focus on the UK's monetary policy’ (Het Centrum, 19 May 1925). After 1931, we find no evidence in policymakers’ media communications that they focused any longer on other countries when it came to their monetary policy formation.Footnote 11
DNB arranged to store part of its excess reserves in London and New York to facilitate the speedy adjustment of the guilder's exchange rate. While international gold shipments enabled the Dutch to return to the gold standard, other monetary policy instruments were necessary to maintain gold parity. The most prominent among these policy levers was the central bank base rate, something already noted by contemporary economists (e.g. Ettinger Reference Ettinger1940). Figure 3 depicts the principal Dutch policy rate between 1920 and 1939: the overnight discount window on bills of exchange (the disconto rate). We find policy rates became more volatile after countries rejoined the gold standard; the Dutch (and UK) policy rate became 12 times more volatile after April 1925.
Policy rate of DNB (monthly frequency), 1920–39
Note: Depicted is the key policy rate set by DNB. Vertical lines denote the Netherlands' entry (April 1925), the UK's departure (September 1931) and the Netherlands' departure (September 1936) from the gold standard.
Source: Own calculation, using DNB (2011).

To examine the degree to which DNB was able to drive local interest rates away from the world rate (typically understood as the policy rate of the monetary benchmark or hegemon), we obtain policy rates for the Netherlands (R d,t), UK, US, France and Germany (where each is used as a potential benchmark country, R f,t). Figure 4 depicts these series. Following Bordo and MacDonald (Reference Bordo and MacDonald2003, Reference Bordo and MacDonald2005), Shambaugh (Reference Shambaugh2004) and Obstfeld et al. (Reference Obstfeld, Shambaugh and Taylor2005), we estimate autoregressive distributed lag models (ARDL) and examine the cointegration of DNB's policy rate (R d,t) and foreign policy rates (R f,t). Our models capture the co-movement of policy rates correcting for time series properties such as auto-correlation and non-stationarity. Below is the base specification for testing the cointegration of central bank policy rates:
 $$\Delta R_{d, t} = \theta \,( {{\rm c} + R_{d, t-1}-\beta R_{\,f, i, t-1}} ) + B{\rm \Delta }R_{\,f, i, t} + u_{i, t}$$
Central bank policy rates of selected countries (monthly frequency), 1925–36
Note: Depicted are the key policy rates set by the Netherlands, UK, US, France and Germany. The vertical lines denote the UK's departure from the gold standard in September 1931.
Source: Own calculation using for NL: DNB (2011). Remaining data sourced by Centre for Financial Stability using for UK: Hills et al. (Reference Hills, Thomas and Dimsdale2015); US: Board of Governors (2020); FR: Loubet (Reference Loubet1900), Flandreau and Zumer (Reference Flandreau and Zumer2004) and Homer and Sylla (Reference Homer and Sylla2005); DE: Deutsche Bundesbank (1976, p. 276).

This empirical setup allows us to assess the short-run response of DNB's interest rate policy to changes in (for example) the UK's policy rate (B), assess the speed of adjustment (in months) back from any deviation from the long-run relationship between policy rates (θ), and the degree of cointegration between the rates (β). If β = 1, monetary policy is fully dependent on foreign policy. Alternatively, if DNB has significant freedom in setting policy, we expect β ≠ 1 and (/or) the long-run relationship to be unstable.Footnote 12 Table 1 reports the reduced form estimations, and Table 2 summarises our results: (i) for the period when the UK was still on the gold standard (April 1925 – September 1931); and (ii) after the UK departed from gold (October 1931 – September 1936).
Cointegration of interest rates (before and after UK departure from the gold standard)

Note: Reported are the ARDL estimation results for Equation 1 for different time periods. The variables of interest are explained in the text and in the note under Figure 4. Tests for breakpoints using ADF, Zt and Za statistics yields no significant break dates. T-statistics in parentheses. Significance levels: *** p < 0.01, ** p < 0.05, * p < 0.1, n.s. = not significant.
Summary of econometric findings on the monetary policy independence of the Netherlands

Note: Summary of results in Table 1.
(i) For the first period (April 1925 – September 1931) we find the adjustment speed (θ) is always negative. This suggests DNB on average was able to restore interest rate equilibria – within 12 months for the UK, and five for France.  $\beta _{f_{UK}}$ is statistically different from zero and approximately equal to one; DNB linked its policy rate to that of the BoE. This implies DNB sacrificed its independent monetary policy with regards to the UK. We also test alternative policy rates which could have been the object of DNB's focus. $\beta _{f_{US}}$ is significantly different from both zero and one; there is no perfect cointegration between DNB's policy rate and the rate set by the Federal Reserve. Similarly, we find DNB did not consider France or Germany to be benchmarks.
(ii) For the second period (October 1931 – September 1936) we find a significant change in regime. As argued elsewhere (see, e.g., Obstfeld and Taylor Reference Obstfeld, Taylor, Bordo, Goldin and White1998), the UK's departure from gold prompted a watershed of policy changes around the world. After September 1931, DNB decoupled its monetary policy from all countries ( $\beta _{f_i}$ is indistinguishable from zero) and only changed its interest rate policy to offset short-run changes (θ < 0). We find short-run equilibria were quickly restored by DNB; the Netherlands’ central bank took between 2.7 and 3.2 months to incorporate foreign interest rate changes.Footnote 13 We find that DNB offset all changes in foreign monetary policy to stabilise the Dutch guilder and keep the guilder's peg with gold.Footnote 14
In summary, and consistent with qualitative evidence, we find that DNB linked its monetary policy to that of the BoE between April 1925 and September 1931. However, sterling's devaluation precipitated a change in policy at the central bank. Officials decoupled the country's monetary policy from that of the BoE and went it alone; they did not reorientate towards France or the US. Within the framework of the policy trilemma, the implications of this finding are twofold. First, if DNB regained its independent monetary policy, then it must have sacrificed international capital mobility. Second, given the competing demands of policymakers at the time, DNB would most likely have had to deploy additional policy instruments to protect the guilder and maintain economic stability.Footnote 15
IV
DNB's decisions to initially link and later decouple its policy from the UK means the central bank must also have made decisions about the other corners of the policy trilemma. Following Shambaugh (Reference Shambaugh2004) and Obstfeld et al. (Reference Obstfeld, Shambaugh and Taylor2005), we define ‘perfect’ capital mobility as the ability to enjoy free arbitrage on open markets.Footnote 16 Because the fixed exchange rate regime constituted a peg with gold, we refer specifically to arbitrage on gold markets.
When the guilder first rejoined in 1925, DNB made the conscious choice to avoid any interference in gold markets. In Vissering's 1926 report to shareholders he points out that 50 million guilders in gold flowed into the country because of their policy stance (DNB 1926, p. 5). The gold influx primarily originated from London. Figure 5 shows the development of DNB's gold reserves; the central bank kept them relatively stable before rejoining, and then, in the immediate run-up to April 1925, it sold approximately 15 per cent to the UK (Vanthoor Reference Vanthoor2004). This permitted the guilder to rejoin at the value of 10 guilders = 6.048 grams of pure gold, equal to its pre-1914 parity. DNB again kept its reserves relatively stable after rejoining.
Gold reserves on DNB's balance sheet (monthly frequency), 1920–39
Note: Depicted is an index of the stock of gold coin and bullion held by DNB. Vertical lines denote the Netherlands' entry (April 1925), the UK's departure (September 1931) and the Netherlands' departure (September 1936) from the gold standard.
Source: Own calculation, using DNB (1920–39).

We think there is sufficient circumstantial evidence to suggest that DNB officials changed their policy stance towards gold some five months before sterling's devaluation in September 1931. Minuted internal discussions between central bankers indicate concerns about the long-term viability of the sterling–gold exchange rate. Speculation about sterling's possible devaluation was a regular discussion point from about May 1931.Footnote 17 There was also a marked change in the behaviour of DNB's gold and foreign exchange departments that month, when the central bank started accepting large shipments of gold and selling off foreign bills of exchange. The 50 per cent increase in DNB's gold reserves between May and September 1931 suggests that this represents a significant break in policy (see Figure 5). Internal meeting minutes reveal where the gold influx was coming from: much initially originated from the Reichsbank, but DNB was also buying up the holdings of domestic banks.Footnote 18
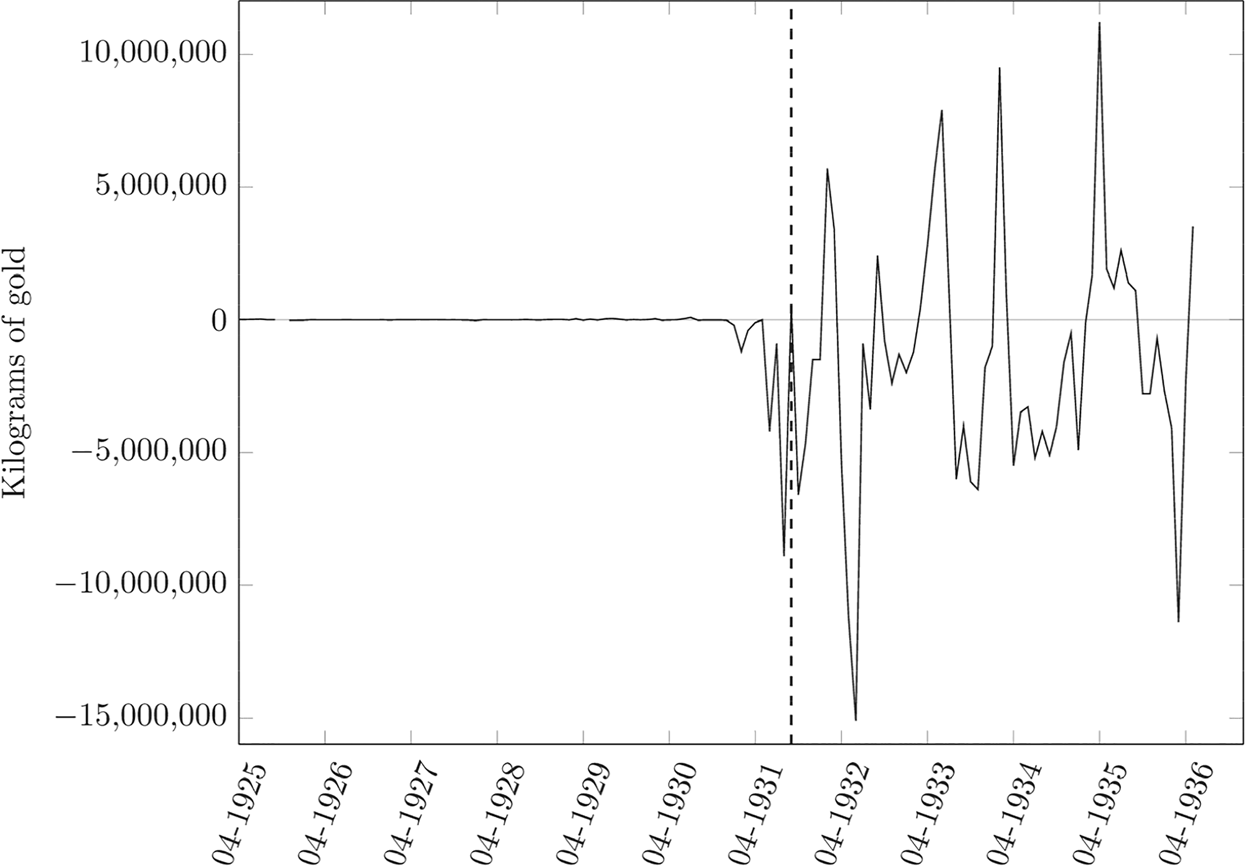
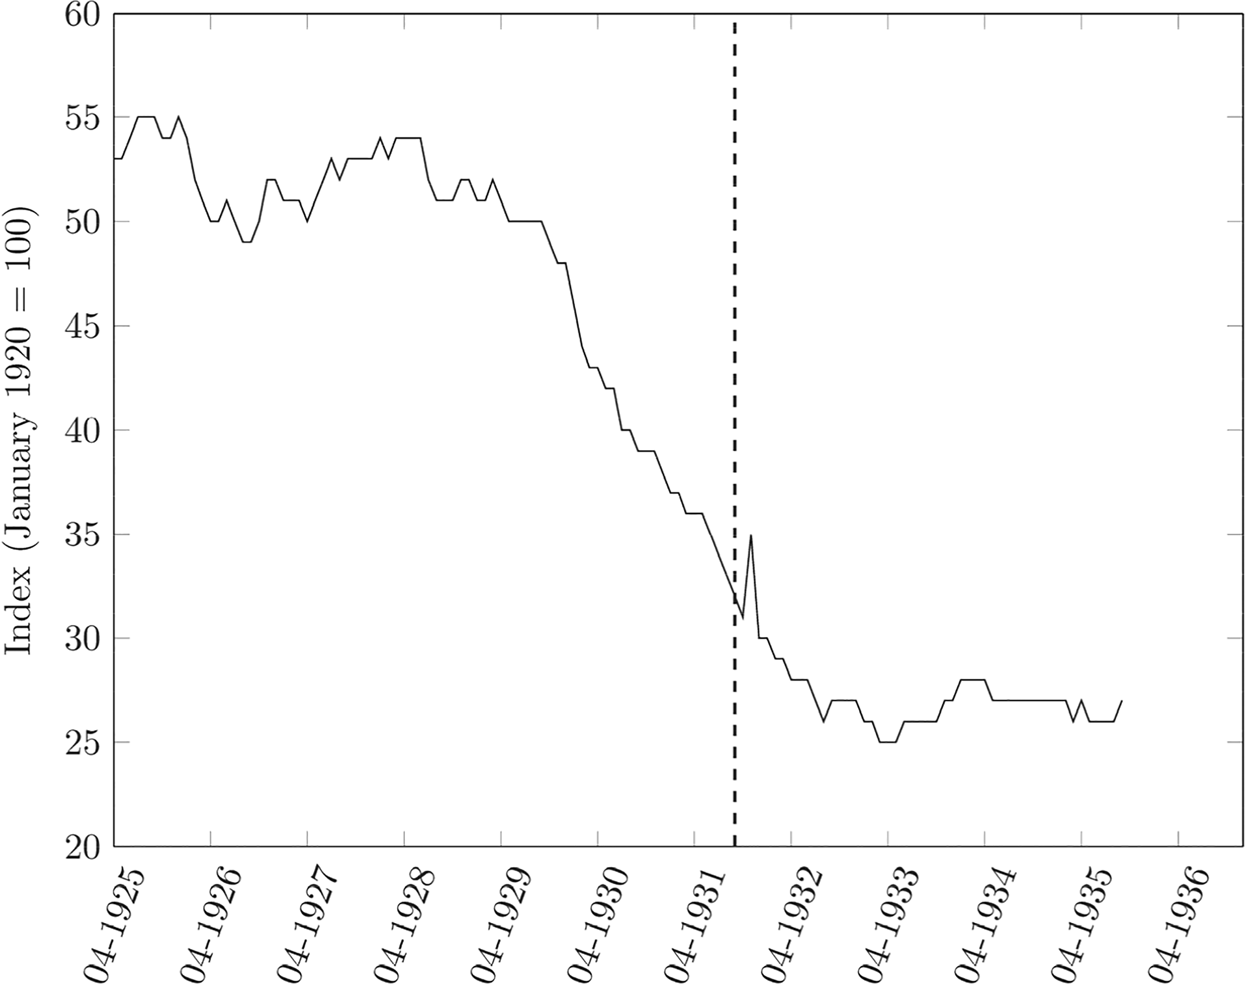
We collect data on the day-to-day functioning of gold markets to better understand how DNB dealt with international capital mobility. Figure 6 shows the monthly net trade (exports–imports) in gold and highlights that the Dutch gold market was relatively quiet prior to May 1931. Significant discrepancies in import and export prices persisted because of the limited trade volume (Figure 7). These discrepancies allowed significant arbitrage to take place. Gold prices in the Dutch market were very volatile prior to about May 1931, representing the potential for arbitrage opportunities for Dutch gold traders (i.e. buying cheap South African gold, and selling it on at a high price). Then, trade volatility significantly increased and implied price differences disappeared in the immediate build-up to sterling's devaluation. This suggests that DNB had already taken control of the domestic gold market prior to September 1931 – as suggested by Nurkse (Reference Nurkse and Brown1944, p. 146).Footnote 19
Net trade in gold and gold materials in the Netherlands (monthly frequency), 1925–36
Note: Quantity of gold exported subtracted from the quantity of gold imported to the Netherlands (in kg). The vertical line denotes the UK's departure from the gold standard in September 1931.
Source: Own calculation, using CBS (1925–36).
Implied price difference between gold exports and imports in the Netherlands (monthly frequency), 1925–36
Note: Import price subtracted from export price (in guilders). The vertical line denotes the UK's departure from the gold standard in September 1931.
Source: Own calculation, using CBS (1925–36).

We find DNB became ever more vigilant in its efforts to protect the fixed guilder–gold exchange rate following sterling's devaluation. In addition to its revised gold policy and reclaiming monetary policy independence, the central bank changed its policy in three ways that together equate to de facto exchange controls: (i) it exerted more control over who could buy and sell gold; (ii) it expanded measures to alleviate temporary gold imbalances with other central banks; and (iii) it reached informal anti-speculation agreements with domestic commercial banks.Footnote 20
(i) DNB required banks to ask for permission to transport gold internationally by drawing on its authority as de facto regulator and supervisor of Dutch financial institutions. DNB then actively used this power and became increasingly reluctant to provide gold conversion services. A letter from the League of Nations to Trip in December 1931 reveals that DNB intensified its vigilance against speculation and its hesitance to facilitate the international trade in guilders and gold.Footnote 21 These controls were kept out of the media spotlight; when pressed, central bankers presented their actions as ‘best practice’.Footnote 22 Later, following speculation against the US dollar in March 1933, DNB introduced a package of measures to partially suspended free capital mobility. It refused outright to issue new gold coins – de facto moving the Netherlands to a gold bullion standard in which only bankers had access to the precious metal underpinning the currency.Footnote 23 Later that month, DNB agreed a temporary ban on the private shipment of gold through the postal service, further extending its control of the currency.Footnote 24 In June, DNB's board increased the burden of information requested of bankers when they approached the central bank for gold; they had to justify their gold demand, including the intended destination of any international shipment.Footnote 25 And from July DNB compelled commercial banks to declare their foreign gold holdings in their requests for bullion – an attempt to ration gold.Footnote 26
(ii) DNB sold practically all its foreign exchange reserves to purchase gold in the aftermath of sterling's devaluation. Consequently, it was no longer flexible in its ability to counteract currency speculation. It had to rely instead on interventions in gold markets. A series of ‘pendulum accords’ partially solved this constraint. Bilateral deals struck between DNB and other central banks, both inside and outside the gold standard, allowed temporary deviations in the exchange rates between currencies to be countered with gold located in the vaults of the other country's central bank. This meant gold did not have to be shipped as frequently, cutting transaction costs and keeping more gold in play. The gold would simply be ‘earmarked’, or relabelled.Footnote 27
(iii) Finally, and more informally, DNB struck up gentlemen's agreements with the Netherlands’ key commercial banks from May 1933.Footnote 28 Their stated purpose was to facilitate DNB in collecting the information relevant to deciding on domestic policies with regards to gold markets and credit provision (DNB 1932, pp. 22–3). These agreements provided new sources of market intelligence. When combined with DNB's revised gold policy and its reclaimed monetary policy independence, this intelligence allowed officials to actively manipulate gold convertibility requirements, delay gold or foreign exchange orders and force temporary anti-speculation measures on the country's financial institutions. DNB's ability to control gold markets combined formal regulation with informal measures and proved extremely powerful. Ultimately, these capital controls constituted ad hoc policies to influence the willingness and ability of private parties to move gold across international borders.
De Jong (Reference De Jong1967, pp. 517–22) described similar manipulations of gold flows in the Dutch case during the pre-war classical gold standard. We show how the practice continued into the 1920s, and was intensified during the 1930s. DNB's decision to first link and later decouple its monetary policy – and to first allow for perfect capital mobility and later to restrict gold markets – was made with the intention of protecting the guilder's international value. But while DNB was able to reduce arbitrage opportunities in the gold market, the use of additional measures suggests that these actions proved insufficient on their own to protect domestic financial stability. Indeed, we find that DNB supplemented its interest rate policy and capital controls with several further policy instruments: (i) managing the domestic money supply; (ii) manipulating its short-term credit facility; and (iii) providing ‘forward guidance’. These are described in Appendix A.
What impact did this policy mix have on the Dutch economy? What was the cost of DNB's policy prowess? Between 1931 and 1936, the Netherlands suffered declining national income (Figure 8), persistent deflation (Figure 9), mass unemployment (Figure 10) and a steep rise in court-declared bankruptcies.Footnote 29 The Dutch government did not choose to fully mitigate the consequences of its exchange rate policy with fiscal policy, introducing only limited measures in some politically sensitive sectors, such as agriculture. Indeed, the government reduced its expenditure overall, specifically in the investment category (Figure 11). The Netherlands’ debt-to-GDP ratio exploded (Figure 12), driven by the fall in national income rather than an increase in sovereign debt. To what extent was this poor performance a consequence of monetary policy?
GNI growth of the Netherlands (annual frequency), 1920–36
Note: Depicted is the growth of Gross National Income (at market prices) of the Netherlands.
Source: CBS (2014).

Wholesale prices in the Netherlands (monthly frequency), 1925–36
Note: Depicted is an index of monthly wholesale prices in the Netherlands. The vertical line denotes the UK's departure from the gold standard in September 1931.
Source: Own calculation, using CBS (1925–36).
Unemployment in the Netherlands (monthly frequency), 1925–36
Note: Depicted is an index of unemployment in the Netherlands. The vertical line denotes the UK's departure from the gold standard in September 1931.
Source: Own calculation, using CBS (1925–36).

Total government expenditure in the Netherlands (annual frequency), 1921–36
Note: Depicted is the total government expenditure decomposed into investments in capital goods, consumption of goods and services, and interest payments. Expressed in current prices (in millions of guilders). Data for 1925 are not available.
Source: Own calculation, using CBS (2014).

Total debt to GNI of the Netherlands (annual frequency), 1920–36
Note: Depicted is a ratio of sovereign debt to GNI for the Netherlands.
Source: Own calculation, using CPB (2017).

V
To understand the macroeconomic consequences of DNB's policy choices, we conduct two separate analyses. First, in Appendix B, we compare the Netherlands’ economic performance with other countries which left gold earlier using monthly data collected by Albers (Reference Albers2018). These international comparisons of economic activity, wholesale prices, trade balances and bond yields help us to identify the possible consequences of alternative exchange rate regimes for the Netherlands. Together they suggest that Dutch policymakers prioritised financial stability over economic growth – a finding consistent with Van Zanden (Reference Van Zanden and Van Zanden1996) and Keesing (Reference Keesing1947) before him.
Second, in the current section, we construct a counterfactual in which we assume that the Netherlands continued to follow UK policy after May 1931 and devalued alongside its largest trading partner in September 1931. Such a policy was never seriously considered by political leaders in either Ruijs de Beerenbrouck's or Colijn's cabinets, nor by central bankers at Vissering's or Trip's DNB. As we have now established, this is partially because they always had the means to continue their gold standard policy. But what if they had been unwilling to employ the various additional ‘non-standard’ policy instruments we have documented in Appendix A? How would the Dutch economy have evolved had policymakers opted for a different path? We have already established that DNB changed its policy behaviour from about May 1931, when central bankers decided to hoard gold and started to voice concerns privately about the long-term viability of the sterling–gold exchange rate. What if, instead of this policy break, DNB officials had remained on their original policy trajectory and continued to follow the BoE?
Our counterfactual traces the evolution of the Dutch economy using three assumptions: (i) the Netherlands continues to fix the guilder's exchange rate to sterling, even beyond sterling's devaluation in September 1931; (ii) DNB continues to link its policy rate to that of the BoE; and (iii) DNB keeps its gold reserves stable. Our out-of-sample forecast starts in May 1931, when DNB overhauled its gold policies; we assume instead that they continued on their historical policy path. We have documented that the primary concern of the Dutch government was financial stability. Given the historical evidence, we argue that the most viable alternative strategy to meet this policy goal would have been to fix the guilder to the pound rather than to gold. This means the guilder would have been devalued alongside sterling from September 1931. This choice would have led to DNB keeping its gold reserves relatively stable, as the exchange rate should have been technically easier to manage with the UK as its only benchmark. This counterfactual gives us a hypothetical universe against which to compare the realised history of the gold standard; it allows us of assess the costs associated with the Dutch government's objective of staying on gold, or the costs of DNB's policy success in achieving its government mandate.
We estimate a vector auto-regression (VAR) following Greene (Reference Greene2008) for the period prior to May 1931:
 $$y_t = k + A_1y_{t-1} + \ldots + A_py_{t-p} + \epsilon _t$$
where y t is an n x 1 vector of endogenous variables pertaining to the factors described in Appendix Table C1, and k is a vector of constants. A p is then a k x k matrix of parameters capturing the relationship between individual endogenous factors. For our baseline model this implies that y t consists of eight domestic factors and four global factors. Our domestic factors are: the policy rate, gold reserves, economic activity, inflation, the money supply, unemployment, total exports and total imports. Our global factors: the guilder–sterling exchange rate, UK economic activity, the BoE's policy rate and the global gold price.Footnote 30 We estimate Equation 2 for the period April 1925 to May 1931. We then use vector A to forecast the development of the Dutch economy.Footnote 31 This implies that we keep all parameters stable post-May 1931. Figure 13 reports the full results; we highlight our most important findings below.Footnote 32
Baseline VAR counterfactual simulation (monthly frequency), 1925–36
Note: Depicted are the observed outcomes (solid line) and counterfactual results (dashed line). The vertical lines denote DNB's gold policy change in May 1931 (dotted line) and the UK's departure from the gold standard in September 1931 (dashed line). We report two sets of confidence intervals: 95% (dark grey) and 68% (light grey). VAR estimation is described in Section V and Appendix C.
Source: Data sources, variable definitions and model specification are provided in Table C1. All factors are log-transformed and depicted as indices with the reference data as April 1925.

Had the Netherlands followed the UK, our counterfactual suggests that DNB would have prevented a deepening of the Great Depression, avoided the deflationary trap of the 1930s and halted the unprecedented rise in unemployment. In our out-of-sample forecasts, the Dutch economy would have been 6.6 per cent better-off on average over the period May 1931 to September 1936.Footnote 33 More significantly, we find that this choice would have halted the deflationary spiral and increased domestic wholesale prices by a factor of 1.8. Our forecast suggests that recovery from the Great Depression would have reduced unemployment by approximately 25 per cent.Footnote 34
Overall, we conclude that DNB's choice to ‘go Dutch’ – to remain on gold and fend for itself – was a good strategy if the only objective of the Dutch government was to stay on gold by whatever means necessary and to keep prices low. But while DNB skilfully executed its mandate, our international comparison and counterfactual analysis suggest that the Dutch paid a steep price for this policy choice.Footnote 35
VI
We argue that the Netherlands’ central bankers interpreted their mandate as to do ‘whatever it takes’ to maintain the fixed guilder–gold exchange rate. Dutch policymakers deliberately stayed away from those policy pathways which would have led to a devaluation. Despite this constraint, DNB was able to creatively design and exploit a wide variety of monetary policy instruments. This allowed the Netherlands to avoid domestic currency crises, and prevented the guilder from being forced off gold. Ultimately, the Dutch only left the gold standard because all other relevant countries had already abandoned ship.
By analysing DNB's day-to-day central banking operations and constructing a counterfactual, we illustrate how policymakers could have ensured an earlier recovery from the Great Depression while still maintaining exchange rate stability – albeit with the pound rather than with gold. DNB officials could have insulated the country from global macroeconomic instability, but chose instead to use all their policy tools to maintain gold parity.
We show that central bankers deployed the country's ample gold reserves and decoupled its policy rate from BoE policies from 1931. Supplemented by additional policies, these measures together limited international capital mobility. DNB used its domestic influence and international reputation to quell speculation against the guilder, eliminate arbitrage in gold markets and maintain gold parity until 1936. DNB's leaders proved successful at executing their government-mandated exchange rate policy objective.
Going Dutch meant adherence to gold at the cost of everything else, including sacrificing future economic prosperity. Our analysis reveals how a small open economy was able to navigate the constraints of the gold standard and maintain significant policy autonomy. Given the right conditions – ample reserves, a strong reputation and unlimited political backing to enact non-standard policy measures – central banks that go Dutch can survive for a surprisingly long time.
Supplementary material
To view supplementary material for this article (Appendices A, B and C; archival and data sources), please visit: https://doi.org/10.1017/S096856502200004X


 Open access