


1 Introduction
The creation of warm dense matter (WDM) or hot dense matter (HDM) in a laboratory setting is of high interest for a broad field of research disciplines such as laboratory astrophysics (Remington Reference Remington2005; Bailey et al. Reference Bailey, Rochau, Iglesias, Abdallah, MacFarlane, Golovkin, Wang, Mancini, Lake and Moore2007; Fujioka et al. Reference Fujioka, Takabe, Yamamoto, Salzmann, Wang, Nishimura, Li, Dong, Wang and Zhang2009), studies of planetary interiors (Ross Reference Ross1981; Knudson, Desjarlais & Dolan Reference Knudson, Desjarlais and Dolan2008), inertial confinement fusion (Drake Reference Drake2018; Le Pape et al. Reference Le Pape, Berzak Hopkins, Divol, Pak, Dewald, Bhandarkar, Bennedetti, Bunn, Biener and Crippen2018), understanding the equations of state under such extreme conditions (Renaudin et al. Reference Renaudin, Blancard, Clérouin, Faussurier, Noiret and Recoules2003; Nettelmann et al. Reference Nettelmann, Holst, Kietzmann, French, Redmer and Blaschke2008) and experimental verification of high energy density (HED) atomic physics models (Hoarty et al. Reference Hoarty, Allan, James, Brown, Hobbs, Hill, Harris, Morton, Brookes and Shepherd2013b ; Faussurier & Blancard Reference Faussurier and Blancard2019). However, in order to benchmark atomic physics models against spectroscopic data, these must be obtained under well-controlled conditions. Since most such models assume Maxwellian plasma populations, this means that, when diagnosed, the heated samples should be as close to thermal equilibrium as possible.
The generation of WDM/HDM at uniform near-solid density requires that the sample be heated rapidly, i.e. before any significant hydrodynamic expansion. Such isochoric heating can be achieved using ultrahigh-intensity, short-pulse lasers, as has been done at various high-power systems (Evans et al.
Reference Evans, Clark, Eagleton, Dunne, Edwards, Garbett, Goldsack, James, Smith and Thomas2005; Gregori et al.
Reference Gregori, Hansen, Clarke, Heathcote, Key, King, Klein, Izumi, Mackinnon and Moon2005; Martinolli et al.
Reference Martinolli, Koenig, Baton, Santos, Amiranoff, Batani, Perelli-Cippo, Scianitti, Gremillet and Mélizzi2006; Chen et al.
Reference Chen, Gregori, Patel, Chung, Evans, Freeman, Garcia Saiz, Glenzer, Hansen and Khattak2007; Nilson et al.
Reference Nilson, Theobald, Myatt, Stoeckl, Storm, Zuegel, Betti, Meyerhofer and Sangster2009; Pérez et al.
Reference Pérez, Gremillet, Koenig, Baton, Audebert, Chahid, Rousseaux, Drouin, Lefebvre and Vinci2010; Brown et al.
Reference Brown, Hoarty, James, Swatton, Hughes, Morton, Guymer, Hill, Chapman and Andrew2011; Hoarty et al.
Reference Hoarty, Allan, James, Brown, Hobbs, Hill, Harris, Morton, Brookes and Shepherd2013a
). These experiments were conducted using laser pulses with $0.3{-}10~\text{ps}$
duration and energies in the range of
$0.3{-}10~\text{ps}$
duration and energies in the range of $10{-}500~\text{J}$
, but there is a need for a wider access at lower-energy table-top facilities, typically delivering joule-level, femtosecond laser pulses. Promising results in this direction have recently been obtained by Purvis et al. (Reference Purvis, Shlyaptsev, Hollinger, Bargsten, Pukhov, Prieto, Wang, Luther, Yin and Wang2013) and Bargsten et al. (Reference Bargsten, Hollinger, Capeluto, Kaymak, Pukhov, Wang, Rockwood, Wang, Keiss and Tommasini2017) making use of nano-wire arrays to strongly enhance the laser-to-plasma coupling efficiency, thus creating keV temperature, sub-solid density plasmas. Yet, such structured targets are non-trivial to manufacture and are extremely sensitive to parasitic laser prepulses, which can destroy the nano-structures before the main pulse arrives.
$10{-}500~\text{J}$
, but there is a need for a wider access at lower-energy table-top facilities, typically delivering joule-level, femtosecond laser pulses. Promising results in this direction have recently been obtained by Purvis et al. (Reference Purvis, Shlyaptsev, Hollinger, Bargsten, Pukhov, Prieto, Wang, Luther, Yin and Wang2013) and Bargsten et al. (Reference Bargsten, Hollinger, Capeluto, Kaymak, Pukhov, Wang, Rockwood, Wang, Keiss and Tommasini2017) making use of nano-wire arrays to strongly enhance the laser-to-plasma coupling efficiency, thus creating keV temperature, sub-solid density plasmas. Yet, such structured targets are non-trivial to manufacture and are extremely sensitive to parasitic laser prepulses, which can destroy the nano-structures before the main pulse arrives.
Most laser-based isochoric heating experiments conducted so far have exploited the fast electrons driven by a linearly polarized laser pulse (Nilson et al.
Reference Nilson, Solodov, Myatt, Theobald, Jaanimagi, Gao, Stoeckl, Craxton, Delettrez and Yaakobi2010; Santos et al.
Reference Santos, Vauzour, Touati, Gremillet, Feugeas, Ceccotti, Bouillaud, Deneuville, Floquet and Fourment2017; Sawada et al.
Reference Sawada, Sentoku, Yabuuchi, Zastrau, Förster, Beg, Chen, Kemp, McLean and Patel2019). Their energy dissipation through the plasma bulk enables heating to high temperatures ( $0.1{-}1~\text{keV}$
) at solid-range plasma densities, but usually at the expense of poor spatial uniformity (Dervieux et al.
Reference Dervieux, Loupias, Baton, Lecherbourg, Glize, Rousseaux, Reverdin, Gremillet, Blancard and Silvert2015) and relatively slow thermalization. Plasma heating in this case is caused by the interaction of the fast electrons with the bulk plasma via a combination of direct collisions (Robinson et al.
Reference Robinson, Strozzi, Davies, Gremillet, Honrubia, Johzaki, Kingham, Sherlock and Solodov2014), ohmic dissipation of the colder return current (Lovelace & Sudan Reference Lovelace and Sudan1971; Guillory & Benford Reference Guillory and Benford1972; Bell & Kingham Reference Bell and Kingham2003; Robinson et al.
Reference Robinson, Strozzi, Davies, Gremillet, Honrubia, Johzaki, Kingham, Sherlock and Solodov2014) or plasma waves driven by the fast electrons (Sherlock et al.
Reference Sherlock, Hill, Evans, Rose and Rozmus2014). Some experiments have been done with laser-accelerated ions to heat a secondary target (Patel et al.
Reference Patel, Mackinnon, Key, Cowan, Foord, Allen, Price, Ruhl, Springer and Stephens2003; Dyer et al.
Reference Dyer, Bernstein, Cho, Osterholz, Grigsby, Dalton, Shepherd, Ping, Chen and Widmann2008; Mančić et al.
Reference Mančić, Lévy, Harmand, Nakatsutsumi, Antici, Audebert, Combis, Fourmaux, Mazevet and Peyrusse2010). Yet, while this heating method can provide better spatial uniformity, it leads to much lower (
$0.1{-}1~\text{keV}$
) at solid-range plasma densities, but usually at the expense of poor spatial uniformity (Dervieux et al.
Reference Dervieux, Loupias, Baton, Lecherbourg, Glize, Rousseaux, Reverdin, Gremillet, Blancard and Silvert2015) and relatively slow thermalization. Plasma heating in this case is caused by the interaction of the fast electrons with the bulk plasma via a combination of direct collisions (Robinson et al.
Reference Robinson, Strozzi, Davies, Gremillet, Honrubia, Johzaki, Kingham, Sherlock and Solodov2014), ohmic dissipation of the colder return current (Lovelace & Sudan Reference Lovelace and Sudan1971; Guillory & Benford Reference Guillory and Benford1972; Bell & Kingham Reference Bell and Kingham2003; Robinson et al.
Reference Robinson, Strozzi, Davies, Gremillet, Honrubia, Johzaki, Kingham, Sherlock and Solodov2014) or plasma waves driven by the fast electrons (Sherlock et al.
Reference Sherlock, Hill, Evans, Rose and Rozmus2014). Some experiments have been done with laser-accelerated ions to heat a secondary target (Patel et al.
Reference Patel, Mackinnon, Key, Cowan, Foord, Allen, Price, Ruhl, Springer and Stephens2003; Dyer et al.
Reference Dyer, Bernstein, Cho, Osterholz, Grigsby, Dalton, Shepherd, Ping, Chen and Widmann2008; Mančić et al.
Reference Mančić, Lévy, Harmand, Nakatsutsumi, Antici, Audebert, Combis, Fourmaux, Mazevet and Peyrusse2010). Yet, while this heating method can provide better spatial uniformity, it leads to much lower ( ${\sim}10~\text{eV}$
) temperatures.
${\sim}10~\text{eV}$
) temperatures.
At normal laser incidence and linear polarization (LP), and for sharp-gradient, highly overdense plasmas, the most commonly invoked mechanisms of laser energy conversion into fast electrons are $j\times B$
heating (Kruer & Estabrook Reference Kruer and Estabrook1985) and vacuum heating (Bauer & Mulser Reference Bauer and Mulser2007; May et al.
Reference May, Tonge, Fiuza, Fonseca, Silva, Ren and Mori2011). Both mechanisms hinge on the temporal modulation of the laser ponderomotive force around the target surface, and thus lead to periodic injection of MeV range electron bunches into the target at twice the laser frequency. Such suprathermal electrons thermalize relatively slowly (
$j\times B$
heating (Kruer & Estabrook Reference Kruer and Estabrook1985) and vacuum heating (Bauer & Mulser Reference Bauer and Mulser2007; May et al.
Reference May, Tonge, Fiuza, Fonseca, Silva, Ren and Mori2011). Both mechanisms hinge on the temporal modulation of the laser ponderomotive force around the target surface, and thus lead to periodic injection of MeV range electron bunches into the target at twice the laser frequency. Such suprathermal electrons thermalize relatively slowly ( ${\sim}\text{ps}$
), which may hinder those applications that require a closely Maxwellian dense plasma. In a work by Kemp & Divol (Reference Kemp and Divol2016), it is shown that the fast electron bunches induce surface waves that can scatter the energized bulk electrons, thereby improving absorption. They also show the necessity of collisions to first heat up the target surface to keV temperatures, required for vacuum heating to commence.
${\sim}\text{ps}$
), which may hinder those applications that require a closely Maxwellian dense plasma. In a work by Kemp & Divol (Reference Kemp and Divol2016), it is shown that the fast electron bunches induce surface waves that can scatter the energized bulk electrons, thereby improving absorption. They also show the necessity of collisions to first heat up the target surface to keV temperatures, required for vacuum heating to commence.
By contrast, using laser pulses with circular polarization (CP), for which the ponderomotive force does not show high-frequency oscillations, the $j\times B$
and vacuum heating mechanisms are essentially suppressed in overdense targets, and so is the fast electron bunch production (and the surface waves induced by them). Still, some fast electrons can be produced with CP if the variation time scale of the laser envelope is not large compared to the laser cycle (Siminos et al.
Reference Siminos, Grech, Skupin, Schlegel and Tikhonchuk2012, Reference Siminos, Grech, Svedung Wettervik and Fülöp2017).
$j\times B$
and vacuum heating mechanisms are essentially suppressed in overdense targets, and so is the fast electron bunch production (and the surface waves induced by them). Still, some fast electrons can be produced with CP if the variation time scale of the laser envelope is not large compared to the laser cycle (Siminos et al.
Reference Siminos, Grech, Skupin, Schlegel and Tikhonchuk2012, Reference Siminos, Grech, Svedung Wettervik and Fülöp2017).
In this paper, we study the effects of collisions on the energy absorption capability of the electrons in a thin, solid foil of a high-atomic-number element. Due to the high atomic number, it is not clear a priori what degree of ionization ( $Z^{\ast }$
) the ions have throughout the process and what influence the ionization history has on heating. While a high
$Z^{\ast }$
) the ions have throughout the process and what influence the ionization history has on heating. While a high $Z^{\ast }$
is desirable for the collisional heating process, the initially cold target will not be highly ionized in the beginning. Therefore, we have studied both different degrees of fixed ionization as well as the self-consistent ionization process including both field and impact ionization.
$Z^{\ast }$
is desirable for the collisional heating process, the initially cold target will not be highly ionized in the beginning. Therefore, we have studied both different degrees of fixed ionization as well as the self-consistent ionization process including both field and impact ionization.
We demonstrate that the energy absorption of an intense short laser pulse in a high- $Z^{\ast }$
solid-density target is mainly due to inverse bremsstrahlung electron heating within the plasma skin layer, and that this scenario holds in a broad range of experimentally relevant parameters. The front-layer electrons are collisionally scattered into the target body where they heat the plasma bulk to keV level temperatures, enough to reach Gbar range pressures, which is well in the regime of HDM. The scattered electrons have sufficiently low energies that they primarily heat the bulk via direct collisional thermalization. Since this mechanism relies on the scattering of the electrons accelerated by the laser field against the heavy ions, it is operative regardless the polarization. Inside the plasma, where the laser field is negligible, collisions cause fast relaxation of the electron distribution to a Maxwellian.
$Z^{\ast }$
solid-density target is mainly due to inverse bremsstrahlung electron heating within the plasma skin layer, and that this scenario holds in a broad range of experimentally relevant parameters. The front-layer electrons are collisionally scattered into the target body where they heat the plasma bulk to keV level temperatures, enough to reach Gbar range pressures, which is well in the regime of HDM. The scattered electrons have sufficiently low energies that they primarily heat the bulk via direct collisional thermalization. Since this mechanism relies on the scattering of the electrons accelerated by the laser field against the heavy ions, it is operative regardless the polarization. Inside the plasma, where the laser field is negligible, collisions cause fast relaxation of the electron distribution to a Maxwellian.
2 Simulation design
We have performed one- and two-dimensional (1-D and 2-D respectively) particle-in-cell (PIC) simulations of laser–solid interactions with and without collisions enabled. We have used the ![]() PIC code (Derouillat et al.
Reference Derouillat, Beck, Pérez, Vinci, Chiaramello, Grassi, Flé, Bouchard, Plotnikov and Aunai2018), which has a relativistic binary collision module (Pérez et al.
Reference Pérez, Gremillet, Decoster, Drouin and Lefebvre2012) based on the collisional algorithm by Nanbu (Reference Nanbu1997) and Nanbu & Yonemura (Reference Nanbu and Yonemura1998). In the case of a collisional plasma, we have considered either a fixed degree of ionization or self-consistent modelling of the ionization process – through field ionization and collisional impact ionization.
PIC code (Derouillat et al.
Reference Derouillat, Beck, Pérez, Vinci, Chiaramello, Grassi, Flé, Bouchard, Plotnikov and Aunai2018), which has a relativistic binary collision module (Pérez et al.
Reference Pérez, Gremillet, Decoster, Drouin and Lefebvre2012) based on the collisional algorithm by Nanbu (Reference Nanbu1997) and Nanbu & Yonemura (Reference Nanbu and Yonemura1998). In the case of a collisional plasma, we have considered either a fixed degree of ionization or self-consistent modelling of the ionization process – through field ionization and collisional impact ionization.
We ran 1-D simulations in a box of size $20~\unicode[STIX]{x03BC}\text{m}$
with a resolution of
$20~\unicode[STIX]{x03BC}\text{m}$
with a resolution of $\unicode[STIX]{x0394}x=0.39~\text{nm}$
(51 200 cells). We considered both LP and CP laser pulses with wavelength
$\unicode[STIX]{x0394}x=0.39~\text{nm}$
(51 200 cells). We considered both LP and CP laser pulses with wavelength $\unicode[STIX]{x1D706}=800~\text{nm}$
, dimensionless amplitudeFootnote
1
$\unicode[STIX]{x1D706}=800~\text{nm}$
, dimensionless amplitudeFootnote
1 $a_{0}=10$
(intensity
$a_{0}=10$
(intensity $I={\textstyle \frac{1}{2}}c\unicode[STIX]{x1D716}_{0}(m_{\text{e}}c\unicode[STIX]{x1D714}a_{0}/e)^{2}\approx 2\times 10^{20}~\text{W}\,\text{cm}^{-2}$
, where
$I={\textstyle \frac{1}{2}}c\unicode[STIX]{x1D716}_{0}(m_{\text{e}}c\unicode[STIX]{x1D714}a_{0}/e)^{2}\approx 2\times 10^{20}~\text{W}\,\text{cm}^{-2}$
, where $\unicode[STIX]{x1D716}_{0}$
is the vacuum permittivity,
$\unicode[STIX]{x1D716}_{0}$
is the vacuum permittivity, $m_{\text{e}}$
the electron mass,
$m_{\text{e}}$
the electron mass, $e$
elementary charge and
$e$
elementary charge and $\unicode[STIX]{x1D714}$
the laser frequency) and a Gaussian temporal profile with
$\unicode[STIX]{x1D714}$
the laser frequency) and a Gaussian temporal profile with
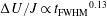
 $t_{\text{FWHM}}=60~\text{fs}$
full-width-at-half-maximum (FWHM) duration in the intensity. The plasma is
$t_{\text{FWHM}}=60~\text{fs}$
full-width-at-half-maximum (FWHM) duration in the intensity. The plasma is $2.5~\unicode[STIX]{x03BC}\text{m}$
thick, starting at
$2.5~\unicode[STIX]{x03BC}\text{m}$
thick, starting at $x=7.5~\unicode[STIX]{x03BC}\text{m}$
with a linear density ramp over a distance of
$x=7.5~\unicode[STIX]{x03BC}\text{m}$
with a linear density ramp over a distance of $20~\text{nm}$
. The plasma consists of electrons and copper ions at solid density,
$20~\text{nm}$
. The plasma consists of electrons and copper ions at solid density, $n_{\text{Cu},0}=48.4n_{\text{c}}\approx 8.4\times 10^{22}~\text{cm}^{-3}$
, with 400 macro-particles per cell for each species. Here,
$n_{\text{Cu},0}=48.4n_{\text{c}}\approx 8.4\times 10^{22}~\text{cm}^{-3}$
, with 400 macro-particles per cell for each species. Here, $n_{\text{c}}=\unicode[STIX]{x1D716}_{0}m_{\text{e}}\unicode[STIX]{x1D714}^{2}/e^{2}$
is the critical density associated with the laser frequency
$n_{\text{c}}=\unicode[STIX]{x1D716}_{0}m_{\text{e}}\unicode[STIX]{x1D714}^{2}/e^{2}$
is the critical density associated with the laser frequency $\unicode[STIX]{x1D714}$
. The particles are initialized from Maxwell–Jüttner distributions (in three momentum dimensions) with temperatures
$\unicode[STIX]{x1D714}$
. The particles are initialized from Maxwell–Jüttner distributions (in three momentum dimensions) with temperatures $T_{\text{e},0}=1~\text{eV}$
for the electrons and
$T_{\text{e},0}=1~\text{eV}$
for the electrons and $T_{\text{i},0}=0.1~\text{eV}$
for the ions.
$T_{\text{i},0}=0.1~\text{eV}$
for the ions.
In order to assess the influence of the plasma collisionality alone, we have first carried out simulations with fixed ionization degrees $Z^{\ast }=11$
, 19, 24 and 27. Then, to ascertain the physical accuracy of these results, we have performed simulations describing both collisional and field ionization. The collisionless skin depth
$Z^{\ast }=11$
, 19, 24 and 27. Then, to ascertain the physical accuracy of these results, we have performed simulations describing both collisional and field ionization. The collisionless skin depth $l_{\text{s}}=c/[\unicode[STIX]{x1D714}(n_{\text{e}}/n_{\text{c}})^{1/2}]$
is resolved, even for the highest ionization where
$l_{\text{s}}=c/[\unicode[STIX]{x1D714}(n_{\text{e}}/n_{\text{c}})^{1/2}]$
is resolved, even for the highest ionization where $l_{\text{s}}^{(Z^{\ast }=27)}\approx 3.5~\text{nm}$
. The values of
$l_{\text{s}}^{(Z^{\ast }=27)}\approx 3.5~\text{nm}$
. The values of $Z^{\ast }=11$
, 19 and 27 correspond to full depletion of different electronic shells,
$Z^{\ast }=11$
, 19 and 27 correspond to full depletion of different electronic shells, $Z^{\ast }=27$
being the reference ionization used in other scans. An additional data point,
$Z^{\ast }=27$
being the reference ionization used in other scans. An additional data point, $Z^{\ast }=24$
, was chosen as an arbitrary value between 19 and 27. When modelling the ionization process self-consistently, the ions were initialized with
$Z^{\ast }=24$
, was chosen as an arbitrary value between 19 and 27. When modelling the ionization process self-consistently, the ions were initialized with $Z_{0}^{\ast }=5$
, in accordance with the widely used Thomas–Fermi model (More Reference More, Joachain and Post1983). Both field-tunnelling and electron–ion impact ionization were enabled. The self-consistent ionization simulation was only performed with CP.
$Z_{0}^{\ast }=5$
, in accordance with the widely used Thomas–Fermi model (More Reference More, Joachain and Post1983). Both field-tunnelling and electron–ion impact ionization were enabled. The self-consistent ionization simulation was only performed with CP.
We also performed one collisional 2-D simulation to check that our results are robust to multidimensional effects. This simulation uses the same CP laser and target parameters as our 1-D base case. In order to limit the computational cost at the increased dimensionality, it was performed at a reduced resolution of 640 cells per micron in both directions ( $\unicode[STIX]{x0394}x=\unicode[STIX]{x0394}y=1.56~\text{nm}$
), and a simulation box size of
$\unicode[STIX]{x0394}x=\unicode[STIX]{x0394}y=1.56~\text{nm}$
), and a simulation box size of $10~\unicode[STIX]{x03BC}\text{m}$
longitudinally and
$10~\unicode[STIX]{x03BC}\text{m}$
longitudinally and $1.6~\unicode[STIX]{x03BC}\text{m}$
(
$1.6~\unicode[STIX]{x03BC}\text{m}$
( $2\unicode[STIX]{x1D706}$
) transversely. Furthermore, the number of particles per cell per species was reduced to
$2\unicode[STIX]{x1D706}$
) transversely. Furthermore, the number of particles per cell per species was reduced to $50$
. A test of these resolution parameters in one dimension showed excellent agreement in electron kinetic energy spectrum of the main body of the electrons with the corresponding high-resolution, collisional 1-D simulation; however, the lower particle count led to a poorer statistics in the high-energy tail of the electron spectrum.
$50$
. A test of these resolution parameters in one dimension showed excellent agreement in electron kinetic energy spectrum of the main body of the electrons with the corresponding high-resolution, collisional 1-D simulation; however, the lower particle count led to a poorer statistics in the high-energy tail of the electron spectrum.
Electron energy spectra $f_{{\mathcal{E}}}$
at times
$f_{{\mathcal{E}}}$
at times $t=150~\text{fs}$
(a) and
$t=150~\text{fs}$
(a) and $t=500~\text{fs}$
(b), for LP (dotted lines) and CP (solid lines), with (black lines) and without collisions (thin, green lines); also showing CP with self-consistent field and collisional ionization (blue, solid line). Two Maxwell–Jüttner distributions are fitted to the bulk of the CP self-consistent and fixed-ionization electron spectra in panel (b) (red dashed and dash-dotted lines respectively).
$t=500~\text{fs}$
(b), for LP (dotted lines) and CP (solid lines), with (black lines) and without collisions (thin, green lines); also showing CP with self-consistent field and collisional ionization (blue, solid line). Two Maxwell–Jüttner distributions are fitted to the bulk of the CP self-consistent and fixed-ionization electron spectra in panel (b) (red dashed and dash-dotted lines respectively).

3 Results and discussion
Figure 1 compares the electron energy spectra as obtained at CP and LP ( $Z^{\ast }=27$
), with or without collisions enabled and at CP with self-consistent ionization. The spectra are recorded at two successive times (
$Z^{\ast }=27$
), with or without collisions enabled and at CP with self-consistent ionization. The spectra are recorded at two successive times ( $t=150~\text{fs}$
and
$t=150~\text{fs}$
and $t=500~\text{fs}$
) – for reference, the peak laser intensity hits the target at
$t=500~\text{fs}$
) – for reference, the peak laser intensity hits the target at $t\approx 110~\text{fs}$
and the pulse FWHM duration is
$t\approx 110~\text{fs}$
and the pulse FWHM duration is $60~\text{fs}$
. For both types of polarization, much higher electron energies are achieved when allowing for collisions. The collisionally enhanced absorption results in a bulk electron temperature of
$60~\text{fs}$
. For both types of polarization, much higher electron energies are achieved when allowing for collisions. The collisionally enhanced absorption results in a bulk electron temperature of $T_{\text{e}}\approx 3.5~\text{keV}$
at
$T_{\text{e}}\approx 3.5~\text{keV}$
at $t=500~\text{fs}$
for both LP and CP, determined by fitting Maxwell–Jüttner distributions to the bulk spectra (i.e. ignoring the tails). Meanwhile, the collisionless simulations only reach an electron temperature of
$t=500~\text{fs}$
for both LP and CP, determined by fitting Maxwell–Jüttner distributions to the bulk spectra (i.e. ignoring the tails). Meanwhile, the collisionless simulations only reach an electron temperature of ${\sim}10{-}100~\text{eV}$
; these electrons are, however, far from being thermalized and only their energetic tails are visible in the figure. The fact that both CP and LP reach very similar bulk electron temperatures when collisions are enabled indicates that the laser absorption mechanism is the same in both cases.
${\sim}10{-}100~\text{eV}$
; these electrons are, however, far from being thermalized and only their energetic tails are visible in the figure. The fact that both CP and LP reach very similar bulk electron temperatures when collisions are enabled indicates that the laser absorption mechanism is the same in both cases.
By comparing the electron spectra with the fitted Maxwellians, we conclude that the electrons have reached a degree of thermalization wherein less than $0.1\,\%$
of the kinetic energy is in the high-energy tail for CP, and
$0.1\,\%$
of the kinetic energy is in the high-energy tail for CP, and ${\sim}1\,\%$
for LP. The time frame for this thermalization is consistent with a rough estimate for electron–electron collisional energy transfer rates. At
${\sim}1\,\%$
for LP. The time frame for this thermalization is consistent with a rough estimate for electron–electron collisional energy transfer rates. At $t=500~\text{fs}$
, the deviation from Maxwellian starts at an electron energy
$t=500~\text{fs}$
, the deviation from Maxwellian starts at an electron energy ${\mathcal{E}}\simeq 50~\text{keV}$
. This is consistent with the
${\mathcal{E}}\simeq 50~\text{keV}$
. This is consistent with the ${\sim}300~\text{fs}$
collisional energy relaxation time of a
${\sim}300~\text{fs}$
collisional energy relaxation time of a $50~\text{keV}$
electron through a
$50~\text{keV}$
electron through a $3.5~\text{keV}$
plasma at
$3.5~\text{keV}$
plasma at $2.3\times 10^{24}~\text{cm}^{-3}$
electron density (Huba Reference Huba2016).
$2.3\times 10^{24}~\text{cm}^{-3}$
electron density (Huba Reference Huba2016).
Note that these results compare LP and CP for the same on-target intensity, while in an experiment, the circularly polarized pulse would in practice be at a somewhat lower intensity due to losses in the conversion from LP to CP (through a quarter-wave plate). Another practical concern may be elliptical polarization, due to imperfections in the CP conversion. While the exact dependence of the fast electron generation on the ellipticity of the polarization is non-trivial, the bulk collisional absorption itself is not expected to be affected by the ellipticity, as demonstrated by the same bulk temperatures reached in the two extreme cases of CP and LP.
The electron temperatures we quote are technically calculated before the electrons have fully thermalized with the ions, which occurs over ${\sim}\text{ps}$
time scales. However, due to the high degree of ionization, the electron–ion equilibrium temperature is
${\sim}\text{ps}$
time scales. However, due to the high degree of ionization, the electron–ion equilibrium temperature is $T_{\text{eq}}\approx n_{\text{e}}/(n_{\text{e}}+n_{\text{i}})T_{\text{e}}\approx 0.96T_{\text{e}}$
. Thus, energy transfer from the electrons to the ions is insignificant.
$T_{\text{eq}}\approx n_{\text{e}}/(n_{\text{e}}+n_{\text{i}})T_{\text{e}}\approx 0.96T_{\text{e}}$
. Thus, energy transfer from the electrons to the ions is insignificant.
When activating self-consistent (both field and collisional) ionization, the bulk electron temperature is slightly reduced ( ${\sim}2.5~\text{keV}$
) compared to the fixed-ionization case. The front plasma is rapidly ionized, mostly through field ionization, so that collisional absorption quickly reaches an efficiency similar to that obtained with fixed
${\sim}2.5~\text{keV}$
) compared to the fixed-ionization case. The front plasma is rapidly ionized, mostly through field ionization, so that collisional absorption quickly reaches an efficiency similar to that obtained with fixed $Z^{\ast }=27$
(see figure 2
b showing that the average ionization
$Z^{\ast }=27$
(see figure 2
b showing that the average ionization $\langle Z^{\ast }\rangle \simeq 24$
at the plasma front already at
$\langle Z^{\ast }\rangle \simeq 24$
at the plasma front already at $t=100~\text{fs}$
). The lower
$t=100~\text{fs}$
). The lower $T_{\text{e}}$
is mostly due to the energy spent on ionization – the average ionization energy from
$T_{\text{e}}$
is mostly due to the energy spent on ionization – the average ionization energy from $Z^{\ast }=5$
to
$Z^{\ast }=5$
to $27$
is
$27$
is $0.9~\text{keV}$
.
$0.9~\text{keV}$
.
Moreover, figure 1(b) shows that, for both CP and LP, collisions cause efficient bulk electron thermalization as early as $t=500~\text{fs}$
. High-energy tails are found to emerge above
$t=500~\text{fs}$
. High-energy tails are found to emerge above ${\sim}50~\text{keV}$
for the fixed ionization and
${\sim}50~\text{keV}$
for the fixed ionization and ${\sim}30~\text{keV}$
for the self-consistent ionization. Note the large range of the logarithmic
${\sim}30~\text{keV}$
for the self-consistent ionization. Note the large range of the logarithmic $f_{{\mathcal{E}}}$
scale, meaning that the tails are three to five orders of magnitude lower than the bulk spectra. The non-thermal tail is heavier in LP than in CP, due to the operative
$f_{{\mathcal{E}}}$
scale, meaning that the tails are three to five orders of magnitude lower than the bulk spectra. The non-thermal tail is heavier in LP than in CP, due to the operative $j\times B$
and vacuum heating.
$j\times B$
and vacuum heating.
Also, the simulation with self-consistent ionization displays a larger tail, compared to the bulk spectrum, than its counterpart with fixed $Z^{\ast }$
. The larger tail as well as an electron population at
$Z^{\ast }$
. The larger tail as well as an electron population at ${\sim}3~\text{MeV}$
can be explained by field-ionization events in the charge-separation layer, which is exposed to stronger laser fields. As the target front electrons are being pushed back by the ponderomotive force, the ions remaining in the charge-separation layer experience the less shielded laser field which quickly ionizes them further. Since these newly freed electrons are injected into regions of stronger laser fields, they are energized similarly to vacuum heating in LP, thus resulting in a larger population of non-thermal electrons, which, as in LP, thermalize relatively slowly. Furthermore, the average ionization level is lower inside the target with self-consistent ionization, as seen in figure 2, thus reducing the efficacy of collisional thermalization. Both these effects act to give a larger high-energy tail.
${\sim}3~\text{MeV}$
can be explained by field-ionization events in the charge-separation layer, which is exposed to stronger laser fields. As the target front electrons are being pushed back by the ponderomotive force, the ions remaining in the charge-separation layer experience the less shielded laser field which quickly ionizes them further. Since these newly freed electrons are injected into regions of stronger laser fields, they are energized similarly to vacuum heating in LP, thus resulting in a larger population of non-thermal electrons, which, as in LP, thermalize relatively slowly. Furthermore, the average ionization level is lower inside the target with self-consistent ionization, as seen in figure 2, thus reducing the efficacy of collisional thermalization. Both these effects act to give a larger high-energy tail.
Average ionization level profiles $\bar{Z}^{\ast }$
in the self-consistent field and collisional ionization simulation (blue lines, bottom axis) at times
$\bar{Z}^{\ast }$
in the self-consistent field and collisional ionization simulation (blue lines, bottom axis) at times $t=150~\text{fs}$
(dash-dotted line) and
$t=150~\text{fs}$
(dash-dotted line) and $t=500~\text{fs}$
(dashed line), and ionization level as a function of ionization energies of copper (red dots and arrows, top axis) – ionization data obtained from the Atomic Spectra Database of the National Institute of Standards and Technology (Kramida et al.
Reference Kramida, Ralchenko and Reader2018). Panel (b) shows the average ionization level profiles
$t=500~\text{fs}$
(dashed line), and ionization level as a function of ionization energies of copper (red dots and arrows, top axis) – ionization data obtained from the Atomic Spectra Database of the National Institute of Standards and Technology (Kramida et al.
Reference Kramida, Ralchenko and Reader2018). Panel (b) shows the average ionization level profiles $\bar{Z}^{\ast }$
near the target front at
$\bar{Z}^{\ast }$
near the target front at $t=85~\text{fs}$
(solid line) and
$t=85~\text{fs}$
(solid line) and $t=100~\text{fs}$
(dotted line).
$t=100~\text{fs}$
(dotted line).

The ionization level profiles ( $\bar{Z}^{\ast }$
) of the self-consistent ionization simulation shown in figure 2(a) represent the local ionization levels averaged over all macro-particles in each spatial cell. Comparing the
$\bar{Z}^{\ast }$
) of the self-consistent ionization simulation shown in figure 2(a) represent the local ionization levels averaged over all macro-particles in each spatial cell. Comparing the $t=150~\text{fs}$
(dashed-dotted line) and the
$t=150~\text{fs}$
(dashed-dotted line) and the $t=500~\text{fs}$
(dashed line) average ionization curves, we see that the target front quickly reaches a high ionization degree while the bulk is ionized more gradually. Since there are no strong electric fields inside the plasma, the ionization of the bulk must be driven by impact ionization. The
$t=500~\text{fs}$
(dashed line) average ionization curves, we see that the target front quickly reaches a high ionization degree while the bulk is ionized more gradually. Since there are no strong electric fields inside the plasma, the ionization of the bulk must be driven by impact ionization. The $\bar{Z}^{\ast }$
curve at
$\bar{Z}^{\ast }$
curve at $t=500~\text{fs}$
(dashed line) in figure 2(a) displays plateaus at
$t=500~\text{fs}$
(dashed line) in figure 2(a) displays plateaus at $\bar{Z}^{\ast }=27$
, 19 and to some extent 11. These plateaus result from the large jumps in ionization energies between the successive outermost electron shells (e.g. between
$\bar{Z}^{\ast }=27$
, 19 and to some extent 11. These plateaus result from the large jumps in ionization energies between the successive outermost electron shells (e.g. between $\bar{Z}^{\ast }=11$
and
$\bar{Z}^{\ast }=11$
and $12$
, or
$12$
, or $\bar{Z}^{\ast }=19$
and
$\bar{Z}^{\ast }=19$
and $20$
; see figure 2
a). The ionization energy to reach
$20$
; see figure 2
a). The ionization energy to reach $\bar{Z}^{\ast }=28$
is
$\bar{Z}^{\ast }=28$
is ${\sim}11~\text{keV}$
Figure 2(b) shows $\bar{Z}^{\ast }$
at the target front surface (
$\bar{Z}^{\ast }$
at the target front surface ( $x=7.5~\unicode[STIX]{x03BC}\text{m}$
). At time
$x=7.5~\unicode[STIX]{x03BC}\text{m}$
). At time $t=85~\text{fs}$
(solid line), the ionization level has saturated at
$t=85~\text{fs}$
(solid line), the ionization level has saturated at $\bar{Z}^{\ast }=19$
due to the jump in ionization energy after
$\bar{Z}^{\ast }=19$
due to the jump in ionization energy after $Z^{\ast }=19$
. Later, at
$Z^{\ast }=19$
. Later, at $t=100~\text{fs}$
(dotted line), the laser field has become strong enough to sustain field ionization beyond
$t=100~\text{fs}$
(dotted line), the laser field has become strong enough to sustain field ionization beyond $Z^{\ast }=19$
, yielding the peak in
$Z^{\ast }=19$
, yielding the peak in $\bar{Z}^{\ast }$
near
$\bar{Z}^{\ast }$
near $x=7.5~\unicode[STIX]{x03BC}\text{m}$
. Apart from the laser field, the electrostatic field (
$x=7.5~\unicode[STIX]{x03BC}\text{m}$
. Apart from the laser field, the electrostatic field ( $E_{x}$
) induced by the laser ponderomotive force at the target front causes additional ionization. This results in the
$E_{x}$
) induced by the laser ponderomotive force at the target front causes additional ionization. This results in the $\bar{Z}^{\ast }$
peak seen around
$\bar{Z}^{\ast }$
peak seen around $x=7.55~\unicode[STIX]{x03BC}\text{m}$
, which moves into the plasma as the charge-separation layer is pushed forward by the laser ponderomotive force.
$x=7.55~\unicode[STIX]{x03BC}\text{m}$
, which moves into the plasma as the charge-separation layer is pushed forward by the laser ponderomotive force.
Electron phase-space distributions for collisional LP with fixed ionization (a–c); collisional CP with fixed ionization (d–f) and self-consistent field and collisional ionization (g–i) as well as for collisionless CP (j–l), at times $t=150~\text{fs}$
(a,d,g,j),
$t=150~\text{fs}$
(a,d,g,j), $250~\text{fs}$
(b,e,h,k) and
$250~\text{fs}$
(b,e,h,k) and $500~\text{fs}$
(c,f,i,l). Note the different momentum scale for the collisionless CP.
$500~\text{fs}$
(c,f,i,l). Note the different momentum scale for the collisionless CP.

The difference between the simulations is made clearer when studying the electron phase spaces shown in figure 3.Footnote
2
The figure displays time sequences of the collisional distributions with LP in the top row and CP in the second row; the third row shows the self-consistent ionization CP simulation and the bottom row shows the collisionless CP distribution. In the LP simulation, high-energy electron bunches are produced at twice the laser frequency, as seen in the $t=150~\text{fs}$
panel (top row), while CP with fixed ionization (second row) produces a more even distribution of hot electrons since
$t=150~\text{fs}$
panel (top row), while CP with fixed ionization (second row) produces a more even distribution of hot electrons since $j\times B$
and vacuum heating mechanisms are inhibited. At
$j\times B$
and vacuum heating mechanisms are inhibited. At $t=500~\text{fs}$
, most of the fast electrons have thermalized in the fixed-ionization case, while there remains a significant population of high-energy electrons ‘swarming’ around the back of the target with self-consistent ionization.
$t=500~\text{fs}$
, most of the fast electrons have thermalized in the fixed-ionization case, while there remains a significant population of high-energy electrons ‘swarming’ around the back of the target with self-consistent ionization.
With self-consistent ionization, two populations of relatively high-energy electrons are created during the rising phase of the laser pulse. These populations originate from two successive field-ionization phases. The first one occurs early in the interaction, when the ionization of the surface plasma momentarily saturates at $\bar{Z}^{\ast }=19$
. In the
$\bar{Z}^{\ast }=19$
. In the $t=150~\text{fs}$
panel of figure 3, this population accounts for the broad momentum distribution in the target bulk, and also for the beam (with momenta
$t=150~\text{fs}$
panel of figure 3, this population accounts for the broad momentum distribution in the target bulk, and also for the beam (with momenta $p_{x}/(m_{\text{e}}c)\sim -1$
) being reflected in the vacuum (
$p_{x}/(m_{\text{e}}c)\sim -1$
) being reflected in the vacuum ( $x>10~\unicode[STIX]{x03BC}\text{m}$
) and refluxing into the target. The second phase starts at
$x>10~\unicode[STIX]{x03BC}\text{m}$
) and refluxing into the target. The second phase starts at $t\simeq 90~\text{fs}$
, when the laser pulse gets intense enough to ionize the surface plasma beyond
$t\simeq 90~\text{fs}$
, when the laser pulse gets intense enough to ionize the surface plasma beyond $Z^{\ast }=19$
(compare the
$Z^{\ast }=19$
(compare the $85~\text{fs}$
and
$85~\text{fs}$
and $100~\text{fs}$
curves in figure 2
b). This yields fast electrons (visible in the upper right corner of the
$100~\text{fs}$
curves in figure 2
b). This yields fast electrons (visible in the upper right corner of the $t=150~\text{fs}$
phase space) more energetic than those generated earlier, which correspond to the bump around
$t=150~\text{fs}$
phase space) more energetic than those generated earlier, which correspond to the bump around ${\sim}3~\text{MeV}$
in the energy spectra of figure 1. A similar field-ionization injection of fast electrons from the surface ions was seen by Kawahito & Kishimoto (Reference Kawahito and Kishimoto2017) in a carbon plasma, although they used LP which also caused bunching of the electrons at twice the laser frequency.
${\sim}3~\text{MeV}$
in the energy spectra of figure 1. A similar field-ionization injection of fast electrons from the surface ions was seen by Kawahito & Kishimoto (Reference Kawahito and Kishimoto2017) in a carbon plasma, although they used LP which also caused bunching of the electrons at twice the laser frequency.
Electron kinetic energy density ${\mathcal{P}}_{\text{e}}$
for collisional LP (dotted line) and CP (black solid line) and CP with self-consistent field and collisional ionization (blue solid line), at times
${\mathcal{P}}_{\text{e}}$
for collisional LP (dotted line) and CP (black solid line) and CP with self-consistent field and collisional ionization (blue solid line), at times $t=150~\text{fs}$
(a) and
$t=150~\text{fs}$
(a) and $t=500~\text{fs}$
(b). The peak laser intensity hits the target at
$t=500~\text{fs}$
(b). The peak laser intensity hits the target at $t\approx 110~\text{fs}$
.
$t\approx 110~\text{fs}$
.

We now turn our attention to the energy density achieved in these scenarios. Since the heating process is fast compared to hydrodynamical time scales, the plasma bulk has not had time to expand, and hence the bulk electrons and ions remain at solid-range density. At the same time, the electrons reach keV temperatures, resulting in high energy densities of the order of ${\sim}10~\text{Gbar}=10^{9}~\text{J}~\text{cm}^{-3}$
. In figure 4, the electron kinetic energy density
${\sim}10~\text{Gbar}=10^{9}~\text{J}~\text{cm}^{-3}$
. In figure 4, the electron kinetic energy density ${\mathcal{P}}_{\text{e}}$
is displayed throughout the target at times
${\mathcal{P}}_{\text{e}}$
is displayed throughout the target at times $t=150~\text{fs}$
(top panel) and
$t=150~\text{fs}$
(top panel) and $t=500~\text{fs}$
(bottom panel). At the earlier time, the kinetic energy density is concentrated to the front of the target, while at the later stage the energy has spread out throughout most of the plasma. The energy density in the fixed-ionization simulations reaches approximately
$t=500~\text{fs}$
(bottom panel). At the earlier time, the kinetic energy density is concentrated to the front of the target, while at the later stage the energy has spread out throughout most of the plasma. The energy density in the fixed-ionization simulations reaches approximately ${\sim}10~\text{Gbar}$
and is mostly homogeneous in the region
${\sim}10~\text{Gbar}$
and is mostly homogeneous in the region $x=8{-}9~\unicode[STIX]{x03BC}\text{m}$
.
$x=8{-}9~\unicode[STIX]{x03BC}\text{m}$
.
The high-energy electrons created with LP facilitate a better spatial homogenization of the energy density than with CP. Their slow thermalization results in a more spatially homogeneous target heating, since they can recirculate several times through the plasma. In a potential application, one should therefore make a compromise between good thermalization and homogenization. Another parameter that can be used to control homogenization is target thickness; decreasing it helps for a faster homogenization of the plasma heating. However, a thinner target will also explode faster hydrodynamically, which would give a HED application a shorter time frame to operate in.
Meanwhile, the self-consistent simulation gives an exponentially decreasing energy density profile throughout the target at $t=500~\text{fs}$
, indicating that thermalization is taking longer. The lower temperature and electron density reached with self-consistent ionization result in approximately an order of magnitude lower energy density compared to the fixed-ionization results. However, there is still a significant region with
$t=500~\text{fs}$
, indicating that thermalization is taking longer. The lower temperature and electron density reached with self-consistent ionization result in approximately an order of magnitude lower energy density compared to the fixed-ionization results. However, there is still a significant region with ${\mathcal{P}}_{\text{e}}>1~\text{Gbar}$
in the self-consistent ionization simulation at
${\mathcal{P}}_{\text{e}}>1~\text{Gbar}$
in the self-consistent ionization simulation at $t=500~\text{fs}$
. In this case, the energy density does not homogenize as efficiently, partly due to a decreased ability of the target to thermalize fast electrons (stemming from lower
$t=500~\text{fs}$
. In this case, the energy density does not homogenize as efficiently, partly due to a decreased ability of the target to thermalize fast electrons (stemming from lower $\bar{Z}^{\ast }$
), and partly due to the inhomogeneity of the ionization profile which affects the bulk electron density profile.
$\bar{Z}^{\ast }$
), and partly due to the inhomogeneity of the ionization profile which affects the bulk electron density profile.
As a consequence of the strong gradients in ${\mathcal{P}}_{\text{e}}$
around the target front side, a shock wave is launched. The shock wave presents itself as a sharp jump in electron pressure, most clearly seen close to
${\mathcal{P}}_{\text{e}}$
around the target front side, a shock wave is launched. The shock wave presents itself as a sharp jump in electron pressure, most clearly seen close to $x=8.0~\unicode[STIX]{x03BC}\text{m}$
in the
$x=8.0~\unicode[STIX]{x03BC}\text{m}$
in the $t=500~\text{fs}$
panel in figure 4. The details of shock formation are sensitive to the laser and target parameters, and are more clearly seen from the ion phase space, as will be addressed by a paper in preparation (Sundström et al.
Reference Sundström, Siminos, Gremillet and Pusztai2020). However, no ion reflection occurs at the shock front, which means that the shock is hydrodynamic like in its nature.
$t=500~\text{fs}$
panel in figure 4. The details of shock formation are sensitive to the laser and target parameters, and are more clearly seen from the ion phase space, as will be addressed by a paper in preparation (Sundström et al.
Reference Sundström, Siminos, Gremillet and Pusztai2020). However, no ion reflection occurs at the shock front, which means that the shock is hydrodynamic like in its nature.
At the high ionization levels discussed in this paper, such high temperatures and densities may result in significant energy losses due to bremsstrahlung. The total bremsstrahlung emission power density can be estimated as $S_{\text{BS}}\,[\text{W}~\text{cm}^{-3}]\approx 1.69\times 10^{32}\times {Z^{\ast }}^{3}(n_{\text{i}}\,[\text{cm}^{-3}])^{2}\,(T_{\text{e}}\,[\text{eV}])^{1/2}$
(Huba Reference Huba2016). By comparing the power density to the thermal energy density
$S_{\text{BS}}\,[\text{W}~\text{cm}^{-3}]\approx 1.69\times 10^{32}\times {Z^{\ast }}^{3}(n_{\text{i}}\,[\text{cm}^{-3}])^{2}\,(T_{\text{e}}\,[\text{eV}])^{1/2}$
(Huba Reference Huba2016). By comparing the power density to the thermal energy density ${\sim}\frac{3}{2}n_{\text{e}}T_{\text{e}}$
, we arrive at a radiative time scale of the order of several ps for keV range temperatures at a density of
${\sim}\frac{3}{2}n_{\text{e}}T_{\text{e}}$
, we arrive at a radiative time scale of the order of several ps for keV range temperatures at a density of $n_{\text{i}}=8.4\times 10^{22}~\text{cm}^{-3}$
. Hence, the radiative losses from bremsstrahlung will mostly be of concern at time scales longer than those studied in this paper. However, bremsstrahlung losses cannot be completely disregarded in a WDM/HDM experiments, where current spectroscopic temporal resolution is constrained to
$n_{\text{i}}=8.4\times 10^{22}~\text{cm}^{-3}$
. Hence, the radiative losses from bremsstrahlung will mostly be of concern at time scales longer than those studied in this paper. However, bremsstrahlung losses cannot be completely disregarded in a WDM/HDM experiments, where current spectroscopic temporal resolution is constrained to ${\sim}\text{ps}$
time scales.
${\sim}\text{ps}$
time scales.
Besides bremsstrahlung, line emission from relaxation of excited states may be of concern. However, at electron energies above ${\gtrsim}10~\text{eV}$
, electron energy losses from excitations become subdominant compared to ionization (Joshipura, Vaishnav & Limbachiya Reference Joshipura, Vaishnav and Limbachiya2006). Since energy loss from collisional ionization events is accounted for in the self-consistent ionization simulation, the temperature of
${\gtrsim}10~\text{eV}$
, electron energy losses from excitations become subdominant compared to ionization (Joshipura, Vaishnav & Limbachiya Reference Joshipura, Vaishnav and Limbachiya2006). Since energy loss from collisional ionization events is accounted for in the self-consistent ionization simulation, the temperature of $T_{\text{e}}\approx 2.5~\text{keV}$
is likely not affected much by losses through line emissions.
$T_{\text{e}}\approx 2.5~\text{keV}$
is likely not affected much by losses through line emissions.
3.1 Illustration of the collisional absorption mechanism
To illustrate the mechanism by which collisions enhance absorption, we have performed a simplified set of simulations. These are designed to generate a quasi-steady state: the laser intensity is constant after a linear ramp-up over 10 laser cycles; the ions are stationary; the plasma is $2.5~\unicode[STIX]{x03BC}\text{m}$
long and it terminates at a thermal boundary, meaning that particles which exit the boundary are reflected with momenta chosen randomly from a Maxwellian distribution at
$2.5~\unicode[STIX]{x03BC}\text{m}$
long and it terminates at a thermal boundary, meaning that particles which exit the boundary are reflected with momenta chosen randomly from a Maxwellian distribution at $T_{\text{e},0}=10~\text{eV}$
for the electrons – the same at the initial temperatures. The other simulation parameters are: CP at
$T_{\text{e},0}=10~\text{eV}$
for the electrons – the same at the initial temperatures. The other simulation parameters are: CP at $a_{0}=10$
,
$a_{0}=10$
, $Z^{\ast }=27$
with and without collisions; resolution and other numerical parameters are as stated in § 2. The long ramp-up time has been chosen to reduce electron energization due to the laser amplitude envelope modulation (Siminos et al.
Reference Siminos, Grech, Skupin, Schlegel and Tikhonchuk2012). Note that due to the steady state nature of this simplified simulation setting, it is hard to draw any quantitative conclusions that can be transferred to the time-varying situation.
$Z^{\ast }=27$
with and without collisions; resolution and other numerical parameters are as stated in § 2. The long ramp-up time has been chosen to reduce electron energization due to the laser amplitude envelope modulation (Siminos et al.
Reference Siminos, Grech, Skupin, Schlegel and Tikhonchuk2012). Note that due to the steady state nature of this simplified simulation setting, it is hard to draw any quantitative conclusions that can be transferred to the time-varying situation.
We will now take a look at the interaction between the electrons and the laser electric field. The density of power $S$
exerted on an electron population can be expressed as
$S$
exerted on an electron population can be expressed as
 $$\begin{eqnarray}S(x,t)=-\text{e}\int \text{d}^{3}v\boldsymbol{E}_{\bot }\boldsymbol{\cdot }\boldsymbol{v}f_{\text{e}}(\boldsymbol{v})=-\text{e}n_{\text{e}}\boldsymbol{E}_{\bot }\boldsymbol{\cdot }\boldsymbol{V}_{\bot },\end{eqnarray}$$
where $\boldsymbol{E}_{\bot }=\boldsymbol{E}_{\bot }(x,t)$
is the laser electric field – which only lies in the transverse plane – and
$\boldsymbol{E}_{\bot }=\boldsymbol{E}_{\bot }(x,t)$
is the laser electric field – which only lies in the transverse plane – and $\boldsymbol{V}_{\bot }=\boldsymbol{V}_{\bot }(x,t)\equiv [1/n_{\text{e}}(x,t)]\int \text{d}^{3}v\,\boldsymbol{v}_{\bot }\,f_{\text{e}}(x,\boldsymbol{v};t)$
is the projection of electron velocity moment onto the transverse plane.
$\boldsymbol{V}_{\bot }=\boldsymbol{V}_{\bot }(x,t)\equiv [1/n_{\text{e}}(x,t)]\int \text{d}^{3}v\,\boldsymbol{v}_{\bot }\,f_{\text{e}}(x,\boldsymbol{v};t)$
is the projection of electron velocity moment onto the transverse plane.
In a 1-D model, disregarding collisional effects, the transverse canonical momentum $\tilde{\boldsymbol{P}}_{\bot }=\boldsymbol{P}_{\bot }-\text{e}\boldsymbol{A}_{\bot }$
is conserved, and
$\tilde{\boldsymbol{P}}_{\bot }=\boldsymbol{P}_{\bot }-\text{e}\boldsymbol{A}_{\bot }$
is conserved, and $\tilde{\boldsymbol{P}}_{\bot }=0$
. Hence
$\tilde{\boldsymbol{P}}_{\bot }=0$
. Hence $\boldsymbol{P}_{\bot }=\text{e}\boldsymbol{A}_{\bot }$
, where
$\boldsymbol{P}_{\bot }=\text{e}\boldsymbol{A}_{\bot }$
, where $\boldsymbol{A}_{\bot }$
and
$\boldsymbol{A}_{\bot }$
and $\boldsymbol{P}_{\bot }$
are the transverse component of the magnetic vector potential and the electron momentum moment, defined analogously to
$\boldsymbol{P}_{\bot }$
are the transverse component of the magnetic vector potential and the electron momentum moment, defined analogously to $\boldsymbol{V}_{\bot }$
. In quasi-steady state,
$\boldsymbol{V}_{\bot }$
. In quasi-steady state, $\boldsymbol{A}_{\bot }$
is just rotating in the transverse plane, so the electric field is
$\boldsymbol{A}_{\bot }$
is just rotating in the transverse plane, so the electric field is $\boldsymbol{E}_{\bot }\equiv -\unicode[STIX]{x2202}\boldsymbol{A}_{\bot }/\unicode[STIX]{x2202}t=\unicode[STIX]{x1D714}A_{\bot }[\cos (\unicode[STIX]{x1D714}t)\hat{\boldsymbol{y}}-\text{sin}(\unicode[STIX]{x1D714}t)\hat{\boldsymbol{z}}]/\sqrt{2}$
, where
$\boldsymbol{E}_{\bot }\equiv -\unicode[STIX]{x2202}\boldsymbol{A}_{\bot }/\unicode[STIX]{x2202}t=\unicode[STIX]{x1D714}A_{\bot }[\cos (\unicode[STIX]{x1D714}t)\hat{\boldsymbol{y}}-\text{sin}(\unicode[STIX]{x1D714}t)\hat{\boldsymbol{z}}]/\sqrt{2}$
, where $A_{\bot }=A_{\bot }(x)$
is the magnitude of the vector potential (necessarily transverse in one dimension). Importantly, the electric field vector is perpendicular to the vector potential and the magnitude of the electric field is
$A_{\bot }=A_{\bot }(x)$
is the magnitude of the vector potential (necessarily transverse in one dimension). Importantly, the electric field vector is perpendicular to the vector potential and the magnitude of the electric field is $E_{\bot }=\unicode[STIX]{x1D714}A_{\bot }$
. We therefore expect
$E_{\bot }=\unicode[STIX]{x1D714}A_{\bot }$
. We therefore expect $\boldsymbol{P}_{\bot }$
and
$\boldsymbol{P}_{\bot }$
and $\boldsymbol{E}_{\bot }$
to be perpendicular and their magnitudes – in normalized units – to be equal,
$\boldsymbol{E}_{\bot }$
to be perpendicular and their magnitudes – in normalized units – to be equal, $P_{\bot }=E_{\bot }$
.
$P_{\bot }=E_{\bot }$
.
Electron transverse momentum distribution at $x=7.0{-}7.2~\text{nm}$
behind the ion front in the simplified simulations with fixed ions. The left and right panels correspond to collisional and collisionless simulations, respectively. The distributions are here recorded at
$x=7.0{-}7.2~\text{nm}$
behind the ion front in the simplified simulations with fixed ions. The left and right panels correspond to collisional and collisionless simulations, respectively. The distributions are here recorded at $t=190~\text{fs}$
, which is well after the quasi-steady state has been reached, where
$t=190~\text{fs}$
, which is well after the quasi-steady state has been reached, where $\boldsymbol{E}_{\bot }$
and
$\boldsymbol{E}_{\bot }$
and $\boldsymbol{P}_{\bot }$
rotates (clockwise) in the transverse plane.
$\boldsymbol{P}_{\bot }$
rotates (clockwise) in the transverse plane.

Figure 5 shows slices of the collisional (a) and collisionless (b) electron distributions in the transverse momentum plane at $t=190~\text{fs}$
, well after quasi-steady state has been reached, and in a thin slice
$t=190~\text{fs}$
, well after quasi-steady state has been reached, and in a thin slice $7.0{-}7.2~\text{nm}$
(one cell length) behind the immobile ion front edge of the plasma. If we were to evolve this picture in time, we would see the (negative) electric field
$7.0{-}7.2~\text{nm}$
(one cell length) behind the immobile ion front edge of the plasma. If we were to evolve this picture in time, we would see the (negative) electric field $-\boldsymbol{E}_{\bot }$
rotate clockwise, along the marked-out circular path in figure 5; the mean momentum
$-\boldsymbol{E}_{\bot }$
rotate clockwise, along the marked-out circular path in figure 5; the mean momentum $\boldsymbol{P}_{\bot }$
would follow synchronously in this rotation. The most apparent difference between the collisional and collisionless distributions is the much larger momentum spread of the former, caused by collisional scattering of the electrons. In contrast to the collisionless case,
$\boldsymbol{P}_{\bot }$
would follow synchronously in this rotation. The most apparent difference between the collisional and collisionless distributions is the much larger momentum spread of the former, caused by collisional scattering of the electrons. In contrast to the collisionless case, $-\boldsymbol{E}_{\bot }$
and
$-\boldsymbol{E}_{\bot }$
and $\boldsymbol{P}_{\bot }$
are not equal in magnitude nor are they perfectly perpendicular. The missing transverse canonical momentum has been collisionally transferred to the ions, where it disappears from the simulation due to the ions being static. Note that if
$\boldsymbol{P}_{\bot }$
are not equal in magnitude nor are they perfectly perpendicular. The missing transverse canonical momentum has been collisionally transferred to the ions, where it disappears from the simulation due to the ions being static. Note that if $-\boldsymbol{E}_{\bot }$
and
$-\boldsymbol{E}_{\bot }$
and $\boldsymbol{P}_{\bot }$
are not perfectly perpendicular in (3.1), then the absorbed power density
$\boldsymbol{P}_{\bot }$
are not perfectly perpendicular in (3.1), then the absorbed power density $S$
is non-vanishing.Footnote
3
We can express (3.1) as
$S$
is non-vanishing.Footnote
3
We can express (3.1) as
 $$\begin{eqnarray}S=-ne\boldsymbol{E}_{\bot }\boldsymbol{\cdot }\boldsymbol{V}_{\bot }=neE_{\bot }V_{\bot }\sin (\unicode[STIX]{x1D6FC}),\end{eqnarray}$$
where the phase angle between $-\boldsymbol{E}_{\bot }$
and
$-\boldsymbol{E}_{\bot }$
and $\boldsymbol{V}_{\bot }$
is
$\boldsymbol{V}_{\bot }$
is $\unicode[STIX]{x03C0}/2-\unicode[STIX]{x1D6FC}$
.
$\unicode[STIX]{x03C0}/2-\unicode[STIX]{x1D6FC}$
.
Magnitudes of the perpendicular electric field $E_{\bot }$
(blue dash-dotted) and mean electron transverse momentum
$E_{\bot }$
(blue dash-dotted) and mean electron transverse momentum $P_{\bot }$
(magenta dashed) as well as the absorbed power density
$P_{\bot }$
(magenta dashed) as well as the absorbed power density $S$
(solid line, green and red for
$S$
(solid line, green and red for $S>0$
and
$S>0$
and $S<0$
respectively). Also shown is the phase shift
$S<0$
respectively). Also shown is the phase shift $\sin (\unicode[STIX]{x1D6FC})$
(grey dotted) between
$\sin (\unicode[STIX]{x1D6FC})$
(grey dotted) between $-\boldsymbol{E}_{\bot }$
and
$-\boldsymbol{E}_{\bot }$
and $\boldsymbol{V}_{\bot }$
, where
$\boldsymbol{V}_{\bot }$
, where $\boldsymbol{V}_{\bot }$
is the mean electron transverse velocity moment of the distribution. The vertical black line marks the location of the transverse momentum planes plotted in figure 5. All values are expressed in dimensionless units.
$\boldsymbol{V}_{\bot }$
is the mean electron transverse velocity moment of the distribution. The vertical black line marks the location of the transverse momentum planes plotted in figure 5. All values are expressed in dimensionless units.

Figure 6 displays configuration space profiles of $E_{\bot }$
,
$E_{\bot }$
, $V_{\bot }$
and
$V_{\bot }$
and $S$
– in dimensionless units – as well as
$S$
– in dimensionless units – as well as $\sin (\unicode[STIX]{x1D6FC})$
; the curves are produced from a time average over 21 time frames spanning
$\sin (\unicode[STIX]{x1D6FC})$
; the curves are produced from a time average over 21 time frames spanning $20~\text{fs}$
. In the collisionless case, we have
$20~\text{fs}$
. In the collisionless case, we have $P_{\bot }(x)=E_{\bot }(x)$
and the phase shift angle
$P_{\bot }(x)=E_{\bot }(x)$
and the phase shift angle $\unicode[STIX]{x1D6FC}\simeq 0$
throughout the first
$\unicode[STIX]{x1D6FC}\simeq 0$
throughout the first $\simeq 25~\text{nm}\approx 8l_{\text{s}}$
. Due to a finite spread in the electron transverse velocities, there will be a continuous exchange of electrons in the longitudinal direction not accounted for in the fluid description above, which induces a small deviation from
$\simeq 25~\text{nm}\approx 8l_{\text{s}}$
. Due to a finite spread in the electron transverse velocities, there will be a continuous exchange of electrons in the longitudinal direction not accounted for in the fluid description above, which induces a small deviation from $\unicode[STIX]{x1D6FC}=0$
and hence
$\unicode[STIX]{x1D6FC}=0$
and hence $S\neq 0$
. However,
$S\neq 0$
. However, $S$
changes sign at
$S$
changes sign at $x\approx 15~\text{nm}$
, beyond which the absorbed power is negative. In the collisional case,
$x\approx 15~\text{nm}$
, beyond which the absorbed power is negative. In the collisional case, $P_{\bot }(x)$
is consistently smaller than
$P_{\bot }(x)$
is consistently smaller than $E_{\bot }(x)$
. Furthermore, the phase shift
$E_{\bot }(x)$
. Furthermore, the phase shift $\sin (\unicode[STIX]{x1D6FC})$
is much larger, which is reflected in the about two orders of magnitude larger absorbed power
$\sin (\unicode[STIX]{x1D6FC})$
is much larger, which is reflected in the about two orders of magnitude larger absorbed power $S$
than in the collisionless case.
$S$
than in the collisionless case.
A final note on the collisional case in figure 6(a) is the numerical artefact that causes both $E_{\bot }(x)$
and
$E_{\bot }(x)$
and $P_{\bot }(x)$
to level off near
$P_{\bot }(x)$
to level off near $x=20~\text{nm}$
. As the Monte Carlo collisional algorithm used in
$x=20~\text{nm}$
. As the Monte Carlo collisional algorithm used in ![]() (Pérez et al.
Reference Pérez, Gremillet, Decoster, Drouin and Lefebvre2012) only conserves momentum statistically, a
(Pérez et al.
Reference Pérez, Gremillet, Decoster, Drouin and Lefebvre2012) only conserves momentum statistically, a $P_{\bot }$
noise floor is generated which drives noise in
$P_{\bot }$
noise floor is generated which drives noise in $E_{\bot }$
, i.e. the base level in figure 6(a). This effect could be alleviated by increasing the number of macro-particles. However, the absolute majority of the collisionally induced laser-energy absorption occurs in the region
$E_{\bot }$
, i.e. the base level in figure 6(a). This effect could be alleviated by increasing the number of macro-particles. However, the absolute majority of the collisionally induced laser-energy absorption occurs in the region $x=5{-}15~\text{nm}$
and is therefore not significantly affected by the collisional noise floor.
$x=5{-}15~\text{nm}$
and is therefore not significantly affected by the collisional noise floor.
3.2 Parameter scans
We have also performed parameter scans in order to investigate the dependencies of the collisional heating mechanism. One such scan has been in ionization, with either fixed ionization ( $Z^{\ast }=11,19,24$
and
$Z^{\ast }=11,19,24$
and $27$
) or self-consistent field and impact ionization. We have also conducted scans in laser intensity with
$27$
) or self-consistent field and impact ionization. We have also conducted scans in laser intensity with $a_{0}$
ranging from 1 to 14, and pulse durations from
$a_{0}$
ranging from 1 to 14, and pulse durations from $t_{\text{FWHM}}=15~\text{fs}$
to
$t_{\text{FWHM}}=15~\text{fs}$
to $400~\text{fs}$
. The remaining parameters are as in § 2.
$400~\text{fs}$
. The remaining parameters are as in § 2.
Total simulated kinetic energy gain $\unicode[STIX]{x0394}U$
against (a) the laser energy
$\unicode[STIX]{x0394}U$
against (a) the laser energy $J$
and (b) the power law scaling
$J$
and (b) the power law scaling $\unicode[STIX]{x0394}\tilde{U}$
for different combinations of laser parameter
$\unicode[STIX]{x0394}\tilde{U}$
for different combinations of laser parameter $a_{0}$
and duration
$a_{0}$
and duration $t_{\text{FWHM}}$
. Lines in panel (a) indicate power law scalings:
$t_{\text{FWHM}}$
. Lines in panel (a) indicate power law scalings: $\unicode[STIX]{x0394}U\propto J^{0.74}\propto {a_{0}}^{1.48}$
at constant
$\unicode[STIX]{x0394}U\propto J^{0.74}\propto {a_{0}}^{1.48}$
at constant $t_{\text{FWHM}}=60~\text{fs}$
(dashed) and
$t_{\text{FWHM}}=60~\text{fs}$
(dashed) and $\unicode[STIX]{x0394}U\propto J^{1.13}\propto {t_{\text{FWHM}}}^{1.13}$
at constant
$\unicode[STIX]{x0394}U\propto J^{1.13}\propto {t_{\text{FWHM}}}^{1.13}$
at constant $a_{0}=10$
(dotted). These two power law scalings combine to give
$a_{0}=10$
(dotted). These two power law scalings combine to give $\unicode[STIX]{x0394}\tilde{U} =0.23~\text{mJ}~\unicode[STIX]{x03BC}\text{m}^{-2}\times {a_{0}}^{1.48}\times (t_{\text{FWHM}}/100~\text{fs})^{1.13}$
, which is shown in panel (b) to agree well with the full data set, also including parameter combinations not shown in (a).
$\unicode[STIX]{x0394}\tilde{U} =0.23~\text{mJ}~\unicode[STIX]{x03BC}\text{m}^{-2}\times {a_{0}}^{1.48}\times (t_{\text{FWHM}}/100~\text{fs})^{1.13}$
, which is shown in panel (b) to agree well with the full data set, also including parameter combinations not shown in (a).

Let us first consider the absorbed energy from the laser. Figure 7(a) shows the kinetic energy gain by the electrons and ions ( $\unicode[STIX]{x0394}U$
) following the laser irradiation, for a scan in
$\unicode[STIX]{x0394}U$
) following the laser irradiation, for a scan in $a_{0}$
(colour coded) and a scan in pulse duration (shape coded). The value displayed on the horizontal axis is the laser pulse energy
$a_{0}$
(colour coded) and a scan in pulse duration (shape coded). The value displayed on the horizontal axis is the laser pulse energy $J=It_{\text{FWHM}}[\unicode[STIX]{x03C0}/\text{log}(4)]^{1/2}\propto {a_{0}}^{2}t_{\text{FWHM}}$
, where
$J=It_{\text{FWHM}}[\unicode[STIX]{x03C0}/\text{log}(4)]^{1/2}\propto {a_{0}}^{2}t_{\text{FWHM}}$
, where $I$
is the laser intensity.
$I$
is the laser intensity.
In the case of a constant pulse duration, $t_{\text{FWHM}}=60~\text{fs}$
(triangles), the trend scales like a power law with
$t_{\text{FWHM}}=60~\text{fs}$
(triangles), the trend scales like a power law with $\unicode[STIX]{x0394}U\propto J^{0.74}$
(dashed line) or
$\unicode[STIX]{x0394}U\propto J^{0.74}$
(dashed line) or $\unicode[STIX]{x0394}U\propto {a_{0}}^{1.48}$
, since
$\unicode[STIX]{x0394}U\propto {a_{0}}^{1.48}$
, since $J\propto {a_{0}}^{2}$
. In other words, the absorption efficiency scales as
$J\propto {a_{0}}^{2}$
. In other words, the absorption efficiency scales as $\unicode[STIX]{x0394}U/J\propto J^{-0.26}\propto {a_{0}}^{-0.52}$
. The
$\unicode[STIX]{x0394}U/J\propto J^{-0.26}\propto {a_{0}}^{-0.52}$
. The $a_{0}=1$
point seems to deviate from the above scaling, suggesting that it is mainly valid at relativistic intensities. Thus,
$a_{0}=1$
point seems to deviate from the above scaling, suggesting that it is mainly valid at relativistic intensities. Thus, $a_{0}=1$
was excluded from the fit. This scaling is similar to the
$a_{0}=1$
was excluded from the fit. This scaling is similar to the $I^{-1/4}$
scaling of the normal skin effect, as described by Rozmus & Tikhonchuk (Reference Rozmus and Tikhonchuk1990). Comparing the collisional mean free path,
$I^{-1/4}$
scaling of the normal skin effect, as described by Rozmus & Tikhonchuk (Reference Rozmus and Tikhonchuk1990). Comparing the collisional mean free path, $\unicode[STIX]{x1D706}_{\text{mfp}}\sim 20~\text{nm}$
, to the skin depth,
$\unicode[STIX]{x1D706}_{\text{mfp}}\sim 20~\text{nm}$
, to the skin depth, $l_{\text{s}}\approx 6~\text{nm}$
,Footnote
4
it is not completely clear that the normal skin effect (
$l_{\text{s}}\approx 6~\text{nm}$
,Footnote
4
it is not completely clear that the normal skin effect ( $\unicode[STIX]{x1D706}_{\text{mfp}}\lesssim l_{\text{s}}$
) can be ruled out. However, our simulation results do not support some other scaling laws derived by Rozmus & Tikhonchuk (Reference Rozmus and Tikhonchuk1990) for normal skin effect, possibly due to the non-relativistic and simplified nature (constant intensity and semi-infinite plasma) of their analytic treatment.
$\unicode[STIX]{x1D706}_{\text{mfp}}\lesssim l_{\text{s}}$
) can be ruled out. However, our simulation results do not support some other scaling laws derived by Rozmus & Tikhonchuk (Reference Rozmus and Tikhonchuk1990) for normal skin effect, possibly due to the non-relativistic and simplified nature (constant intensity and semi-infinite plasma) of their analytic treatment.
The other scaling trend displayed in figure 7(a) is at constant $a_{0}=10$
(magenta). Here, the power law fit (dotted line) gives
$a_{0}=10$
(magenta). Here, the power law fit (dotted line) gives $\unicode[STIX]{x0394}U\propto J^{1.13}\propto {t_{\text{FWHM}}}^{1.13}$
. In this case the absorption efficiency still has a weak positive scaling of
$\unicode[STIX]{x0394}U\propto J^{1.13}\propto {t_{\text{FWHM}}}^{1.13}$
. In this case the absorption efficiency still has a weak positive scaling of $\unicode[STIX]{x0394}U/J\propto {t_{\text{FWHM}}}^{0.13}$
. From the pulse duration scaling, we note that the
$\unicode[STIX]{x0394}U/J\propto {t_{\text{FWHM}}}^{0.13}$
. From the pulse duration scaling, we note that the $200~\text{fs}$
and
$200~\text{fs}$
and $400~\text{fs}$
pulses begin to fall off below the scaling followed by the other data points, and they were thus also excluded from the fit. The decreasing trend with
$400~\text{fs}$
pulses begin to fall off below the scaling followed by the other data points, and they were thus also excluded from the fit. The decreasing trend with $t_{\text{FWHM}}$
in the long-pulse limit may be a consequence of the recirculation of hot electrons, which could lower the effective plasma collisionality in the irradiated region.
$t_{\text{FWHM}}$
in the long-pulse limit may be a consequence of the recirculation of hot electrons, which could lower the effective plasma collisionality in the irradiated region.
Combining the two above scalings yields the approximate scaling
 $$\begin{eqnarray}\unicode[STIX]{x0394}\tilde{U} =0.23~\text{mJ}~\unicode[STIX]{x03BC}\text{m}^{-2}\times {a_{0}}^{1.48}\left(\frac{t_{\text{FWHM}}}{100~\text{fs}}\right)^{1.13}\end{eqnarray}$$
in the $(a_{0},t_{\text{FWHM}})$
plane. Figure 7(b) shows this scaling to agree well with the full set of data, including data points where both
$(a_{0},t_{\text{FWHM}})$
plane. Figure 7(b) shows this scaling to agree well with the full set of data, including data points where both $a_{0}$
and
$a_{0}$
and $t_{\text{FWHM}}$
are varied. The observed scaling does break down at the low-
$t_{\text{FWHM}}$
are varied. The observed scaling does break down at the low- $a_{0}$
or long-duration limits. However, the range of validity stretches over two orders of magnitude in pulse energy and a similar range in absorbed energy, and the laser parameters captured by this power law are experimentally feasible and relevant to isochoric heating experiments. Collisional effects in general decrease at higher particle energies and the absorption happens through collisional scattering of the laser-driven electrons in the skin layer. Therefore, if the laser field (
$a_{0}$
or long-duration limits. However, the range of validity stretches over two orders of magnitude in pulse energy and a similar range in absorbed energy, and the laser parameters captured by this power law are experimentally feasible and relevant to isochoric heating experiments. Collisional effects in general decrease at higher particle energies and the absorption happens through collisional scattering of the laser-driven electrons in the skin layer. Therefore, if the laser field ( $a_{0}$
) is increased, so that the electrons in the skin layer reach higher energies, then the efficiency of the collisional absorption should decrease.
$a_{0}$
) is increased, so that the electrons in the skin layer reach higher energies, then the efficiency of the collisional absorption should decrease.
Collisional simulation with various (fixed) ionization degree $Z^{\ast }$
. Left axis (magenta circles): gained kinetic energy by electrons and ions
$Z^{\ast }$
. Left axis (magenta circles): gained kinetic energy by electrons and ions $\unicode[STIX]{x0394}U$
(filled circles) as well as only by electrons
$\unicode[STIX]{x0394}U$
(filled circles) as well as only by electrons $\unicode[STIX]{x0394}U_{\text{e}}$
(open circles). Right axis (black triangles): average kinetic energy gained by one electron
$\unicode[STIX]{x0394}U_{\text{e}}$
(open circles). Right axis (black triangles): average kinetic energy gained by one electron $\overline{\unicode[STIX]{x0394}{\mathcal{E}}}$
.
$\overline{\unicode[STIX]{x0394}{\mathcal{E}}}$
.

We also report on a scan in (fixed) ionization degree $Z^{\ast }$
. Although this parameter cannot be controlled independently in experiments, this scan aims to provide insight into the target collisionality, which scales as
$Z^{\ast }$
. Although this parameter cannot be controlled independently in experiments, this scan aims to provide insight into the target collisionality, which scales as $(Z^{\ast })^{2}$
– ignoring other effects, e.g. individual particle energy. However, by varying
$(Z^{\ast })^{2}$
– ignoring other effects, e.g. individual particle energy. However, by varying $Z^{\ast }$
while keeping the ion density
$Z^{\ast }$
while keeping the ion density $n_{Cu,0}$
fixed, we inevitably also change the electron density
$n_{Cu,0}$
fixed, we inevitably also change the electron density $n_{\text{e},0}=Z^{\ast }n_{Cu,0}$
, which may introduce other density-related effects. Nevertheless, the electron density stays highly overcritical – the lowest electron density in this scan is
$n_{\text{e},0}=Z^{\ast }n_{Cu,0}$
, which may introduce other density-related effects. Nevertheless, the electron density stays highly overcritical – the lowest electron density in this scan is $n_{\text{e},0}=532.4n_{\text{c}}$
for
$n_{\text{e},0}=532.4n_{\text{c}}$
for $Z^{\ast }=11$
. Figure 8 displays the energy absorbed by both electrons and ions
$Z^{\ast }=11$
. Figure 8 displays the energy absorbed by both electrons and ions $\unicode[STIX]{x0394}U$
(filled circles, left axis) and only by electrons
$\unicode[STIX]{x0394}U$
(filled circles, left axis) and only by electrons $\unicode[STIX]{x0394}U_{\text{e}}$
(open circles, left axis) for the different ionization degrees. The absorbed energy increases with
$\unicode[STIX]{x0394}U_{\text{e}}$
(open circles, left axis) for the different ionization degrees. The absorbed energy increases with $Z^{\ast }$
, while a smaller fraction of the absorbed energy goes into the ions at higher
$Z^{\ast }$
, while a smaller fraction of the absorbed energy goes into the ions at higher $Z^{\ast }$
.
$Z^{\ast }$
.
Due to the accompanying changes in electron density, the average absorbed energy per electron $\overline{\unicode[STIX]{x0394}{\mathcal{E}}}$
, also shown in figure 8 (black triangles, right axis), happens to decrease by approximately
$\overline{\unicode[STIX]{x0394}{\mathcal{E}}}$
, also shown in figure 8 (black triangles, right axis), happens to decrease by approximately $15\,\%$
from
$15\,\%$
from $Z^{\ast }=11$
to
$Z^{\ast }=11$
to $27$
. The decrease in
$27$
. The decrease in $\overline{\unicode[STIX]{x0394}{\mathcal{E}}}$
with
$\overline{\unicode[STIX]{x0394}{\mathcal{E}}}$
with $Z^{\ast }$
may seem surprising if the dominant heating mechanism is collisional. However, this might be due to other density effects, such as the increased skin depth at lower electron density which allows a deeper laser penetration and thus a stronger laser-to-electron coupling efficiency. When we examine the electron energy spectra (not shown) in this scan, the Maxwellian-fitted bulk electron temperatures are all
$Z^{\ast }$
may seem surprising if the dominant heating mechanism is collisional. However, this might be due to other density effects, such as the increased skin depth at lower electron density which allows a deeper laser penetration and thus a stronger laser-to-electron coupling efficiency. When we examine the electron energy spectra (not shown) in this scan, the Maxwellian-fitted bulk electron temperatures are all $T_{\text{e}}=3.5\pm 0.1~\text{keV}$
.
$T_{\text{e}}=3.5\pm 0.1~\text{keV}$
.
Fraction of the electron energy in non-thermal electrons, for collisional simulations, $200~\text{fs}$
after the end of the laser pulse, for scans in
$200~\text{fs}$
after the end of the laser pulse, for scans in $Z^{\ast }$
(a),
$Z^{\ast }$
(a), $a_{0}$
(b) and
$a_{0}$
(b) and $t_{\text{FWHM}}$
(c) with CP, marked by crosses. The value marked with a dot is from LP, and self-consistent ionization is shown as a star.
$t_{\text{FWHM}}$
(c) with CP, marked by crosses. The value marked with a dot is from LP, and self-consistent ionization is shown as a star.

Besides just the pure amount of energy absorbed from the laser, we are also interested in how well thermalized the plasma is. As a measure of that, figure 9 shows the fraction of electron kinetic energy in the non-thermal electrons. This is calculated by the fraction of the energy in the high-energy tail to the total electron kinetic energy, $\int _{2T_{\text{e}}}^{\infty }[f_{{\mathcal{E}}}({\mathcal{E}})-f_{{\mathcal{E}}}^{\text{MJ}}({\mathcal{E}})]{\mathcal{E}}\,\text{d}{\mathcal{E}}$
, where
$\int _{2T_{\text{e}}}^{\infty }[f_{{\mathcal{E}}}({\mathcal{E}})-f_{{\mathcal{E}}}^{\text{MJ}}({\mathcal{E}})]{\mathcal{E}}\,\text{d}{\mathcal{E}}$
, where $f_{{\mathcal{E}}}^{\text{MJ}}$
is a Maxwell–Jüttner distribution fitted to the bulk of the electron energy spectrum
$f_{{\mathcal{E}}}^{\text{MJ}}$
is a Maxwell–Jüttner distribution fitted to the bulk of the electron energy spectrum $f_{{\mathcal{E}}}({\mathcal{E}})$
(as shown in figure 1) and
$f_{{\mathcal{E}}}({\mathcal{E}})$
(as shown in figure 1) and $T_{\text{e}}$
is the temperature inferred from the fit. Figure 9 shows scans in fixed ionization degree
$T_{\text{e}}$
is the temperature inferred from the fit. Figure 9 shows scans in fixed ionization degree $Z^{\ast }$
(a), laser amplitude
$Z^{\ast }$
(a), laser amplitude $a_{0}$
(b) and pulse duration
$a_{0}$
(b) and pulse duration $t_{\text{FWHM}}$
(c). The displayed values are taken
$t_{\text{FWHM}}$
(c). The displayed values are taken $200~\text{fs}$
after the end of the laser pulse. Due to a varying heat transport speed, the fraction of non-thermal electron energy is only taken in the region in which the bulk electron temperature is no longer increasing. This should still give a representative estimate of the non-thermal fraction, since the fast electrons have already recirculated by the chosen time, see the
$200~\text{fs}$
after the end of the laser pulse. Due to a varying heat transport speed, the fraction of non-thermal electron energy is only taken in the region in which the bulk electron temperature is no longer increasing. This should still give a representative estimate of the non-thermal fraction, since the fast electrons have already recirculated by the chosen time, see the $t=250~\text{fs}$
panels of figure 3. The precise values in figure 9 are sensitive to the choice of time and region to include, thus these results are only qualitative. Nevertheless, the general trends shown here are still representative of the observed situation – importantly, the relation between LP and CP is robust.
$t=250~\text{fs}$
panels of figure 3. The precise values in figure 9 are sensitive to the choice of time and region to include, thus these results are only qualitative. Nevertheless, the general trends shown here are still representative of the observed situation – importantly, the relation between LP and CP is robust.
Figure 9(a) shows that there is a trend toward lower non-thermal fraction at higher ionization levels, which is consistent with the faster thermalization expected at high $Z^{\ast }$
. This trend also suggests that the higher absorbed energy per electron at lower
$Z^{\ast }$
. This trend also suggests that the higher absorbed energy per electron at lower $Z^{\ast }$
(figure 8) is linked to a relative increase in the non-thermal population.
$Z^{\ast }$
(figure 8) is linked to a relative increase in the non-thermal population.
Regarding the scans in the laser amplitude and duration in figures 9(b) and 9(c), respectively, no clear trend appears to emerge among the CP laser pulses (marked by $\times$
). Then there are the self-consistent ionization (star) and LP (downward triangle) simulations: both have approximately one order of magnitude higher fraction of energy in non-thermal electrons than the equivalent (fixed-ionization, CP) counterpart. The higher fraction of non-thermal energy with LP stems from the
$\times$
). Then there are the self-consistent ionization (star) and LP (downward triangle) simulations: both have approximately one order of magnitude higher fraction of energy in non-thermal electrons than the equivalent (fixed-ionization, CP) counterpart. The higher fraction of non-thermal energy with LP stems from the $j\times B$
and vacuum heating mechanism. The higher non-thermal energy fraction with a self-consistent ionization process is discussed in conjunction with its phase-space distribution in figure 3.
$j\times B$
and vacuum heating mechanism. The higher non-thermal energy fraction with a self-consistent ionization process is discussed in conjunction with its phase-space distribution in figure 3.
Even a very small fraction of non-thermals may affect the interpretation of X-ray diagnostics (Rosmej Reference Rosmej1997; Chen et al.
Reference Chen, Patel, Chung, Kemp, Le Pape, Maddox, Wilks, Stephens and Beg2009; Renner & Rosmej Reference Renner and Rosmej2019), meaning that LP can be more intrusive than CP in WDM/HDM studies. We have also conducted simulations with a larger pre-expanded plasma (exponentially decaying density profile with a scale length of $80~\text{nm}$
). While not presented here, those simulations show that LP can result in up to
$80~\text{nm}$
). While not presented here, those simulations show that LP can result in up to ${\sim}10\,\%$
of the electron kinetic energy in non-thermal electrons, which would of course be even more intrusive and significantly affect the X-ray diagnostics. With CP, the pre-plasma weakens the energy absorption by about a factor of two, but the fraction of energy in fast electrons stays
${\sim}10\,\%$
of the electron kinetic energy in non-thermal electrons, which would of course be even more intrusive and significantly affect the X-ray diagnostics. With CP, the pre-plasma weakens the energy absorption by about a factor of two, but the fraction of energy in fast electrons stays ${\lesssim}1\,\%$
.
${\lesssim}1\,\%$
.
3.3 Two-dimensional simulation results
Up to this point, all the results presented have been produced in 1-D simulations. However, to investigate the applicability of these results in higher dimensions, where transverse plasma modulations can arise at the target boundary and affect the bulk heating and hot-electron generation (Kemp & Divol Reference Kemp and Divol2016), we have performed a 2-D simulation at our baseline laser parameters (see § 2 for details). A density map of the electron density near the illuminated target surface is shown in figure 10(a). The density is shown at $t=250~\text{fs}$
. There is a transverse band of higher density at
$t=250~\text{fs}$
. There is a transverse band of higher density at $x\approx 2.72~\unicode[STIX]{x03BC}\text{m}$
that represents a shock front propagating into the plasma. Notably, this shock front remains straight, with no evidence of substantial density modulations.
$x\approx 2.72~\unicode[STIX]{x03BC}\text{m}$
that represents a shock front propagating into the plasma. Notably, this shock front remains straight, with no evidence of substantial density modulations.
Map of the electron density (a) in units of background density $n_{0}$
and the relative transverse variation of the electron density (b) near the front target surface at
$n_{0}$
and the relative transverse variation of the electron density (b) near the front target surface at $250~\text{fs}$
. Panel (c) shows a comparison of the electron energy spectra from the 1-D and 2-D simulations at the same time. The spectra are taken from the full simulation box. The transverse band of higher density at
$250~\text{fs}$
. Panel (c) shows a comparison of the electron energy spectra from the 1-D and 2-D simulations at the same time. The spectra are taken from the full simulation box. The transverse band of higher density at $x\approx 2.72~\unicode[STIX]{x03BC}\text{m}$
in the panel (a) corresponds to a shock front launched by the laser impact.
$x\approx 2.72~\unicode[STIX]{x03BC}\text{m}$
in the panel (a) corresponds to a shock front launched by the laser impact.

To more clearly demonstrate the absence of transverse instability effects, the relative transverse variation of the electron density $n/\langle n\rangle _{y}-1$
is displayed in figure 10(b), where
$n/\langle n\rangle _{y}-1$
is displayed in figure 10(b), where $\langle \cdot \rangle _{y}$
denotes a transverse average over the full width of the simulation box in
$\langle \cdot \rangle _{y}$
denotes a transverse average over the full width of the simulation box in $y$
. Any transverse density structure should therefore be clearly visible in this representation. The substantial deviations from the average density observed in the low-density (
$y$
. Any transverse density structure should therefore be clearly visible in this representation. The substantial deviations from the average density observed in the low-density ( $n_{e}\lesssim 0.2n_{0}$
) region correspond to statistical noise due to a low number of computational particles in said region. Importantly, the deviations seen in figure 10(b) have no structure to them, and the same applies for the shock, suggesting that transverse effects are inoperative in the present highly collisional case (at least within the simulated time window).
$n_{e}\lesssim 0.2n_{0}$
) region correspond to statistical noise due to a low number of computational particles in said region. Importantly, the deviations seen in figure 10(b) have no structure to them, and the same applies for the shock, suggesting that transverse effects are inoperative in the present highly collisional case (at least within the simulated time window).
Lastly, to confirm that the collisional heating behaves similarly in the 2-D and 1-D simulations, figure 10(c) shows the electron kinetic energy spectra of the corresponding 1-D and 2-D simulations at $t=250~\text{fs}$
.Footnote
5
The spectra of the 2-D and 1-D simulations are essentially the same. Although not shown here, the two spectra agree similarly well also at earlier times. Since the following thermalization process is almost entirely collisional, and thus independent of dimensionality, it is safe to conclude that the energy absorption is not affected by going from one to two dimensions, under the interaction conditions considered.
$t=250~\text{fs}$
.Footnote
5
The spectra of the 2-D and 1-D simulations are essentially the same. Although not shown here, the two spectra agree similarly well also at earlier times. Since the following thermalization process is almost entirely collisional, and thus independent of dimensionality, it is safe to conclude that the energy absorption is not affected by going from one to two dimensions, under the interaction conditions considered.
4 Conclusions
We have performed collisional and collisionless 1-D and 2-D PIC simulations and shown that a collisional, inverse bremsstrahlung, absorption can be used for strong plasma heating in a solid-density, high- $Z^{\ast }$
material, such as copper, with ultrahigh intensity, short-pulse lasers. Using CP, the electron population quickly thermalizes to well-formed Maxwellian distributions suitable for experimental verification of HED physics models. The collisional simulations show that the target electrons are quickly heated to
$Z^{\ast }$
material, such as copper, with ultrahigh intensity, short-pulse lasers. Using CP, the electron population quickly thermalizes to well-formed Maxwellian distributions suitable for experimental verification of HED physics models. The collisional simulations show that the target electrons are quickly heated to $T_{\text{e}}\sim 3.5~\text{keV}$
bulk temperature on a
$T_{\text{e}}\sim 3.5~\text{keV}$
bulk temperature on a ${\sim}300~\text{fs}$
time scale. The target energy density reaches
${\sim}300~\text{fs}$
time scale. The target energy density reaches ${\sim}10~\text{Gbar}$
, which is within the realm of ultrahigh energy density. The use of CP provides faster collisional thermalization of the electron population compared to LP, something which is valuable for experimental tests of HED atomic physics models. A test of the collisional absorption using a 2-D simulation, demonstrates the transferability of the 1-D results to higher dimensions. In contrast to previous work conducted with lower-
${\sim}10~\text{Gbar}$
, which is within the realm of ultrahigh energy density. The use of CP provides faster collisional thermalization of the electron population compared to LP, something which is valuable for experimental tests of HED atomic physics models. A test of the collisional absorption using a 2-D simulation, demonstrates the transferability of the 1-D results to higher dimensions. In contrast to previous work conducted with lower- $Z^{\ast }$
targets (Kemp & Divol Reference Kemp and Divol2016), the high collisionality is not favourable for driving transverse plasma modulations, resulting in the same absorption levels in two dimensions as in one dimension, at least for CP.
$Z^{\ast }$
targets (Kemp & Divol Reference Kemp and Divol2016), the high collisionality is not favourable for driving transverse plasma modulations, resulting in the same absorption levels in two dimensions as in one dimension, at least for CP.
We have carried out scans over laser parameters and ionization. The scans over laser settings show that the mechanism is robust to changes in the laser, over two orders of magnitude in laser energy, with lower intensity and longer pulses at the same laser pulse energy yielding better energy absorption. Also, the higher collisionality incurred from a higher ionization level improves energy absorption and electron thermalization. A more realistic simulation run with self-consistent ionization, including both impact and field ionization, reached $T_{\text{e}}\sim 2.5~\text{keV}$
, confirming that collisional heating is still operational in a self-consistently ionized plasma, although its thermalization is then less complete than at fixed ionization, due to high-energy electrons generated through ionization events in strong-field regions.
$T_{\text{e}}\sim 2.5~\text{keV}$
, confirming that collisional heating is still operational in a self-consistently ionized plasma, although its thermalization is then less complete than at fixed ionization, due to high-energy electrons generated through ionization events in strong-field regions.
Acknowledgements
The authors are grateful for fruitful discussions with L. Hesslow and T. Fülöp, as well as to M. Grech and F. Pérez for support with ![]() . This project has received funding from the European Research Council (ERC) under the European Union’s Horizon 2020 research and innovation programme under grant agreement no. 647121, the Swedish Research Council (grant no. 2016-05012), and the Knut och Alice Wallenberg Foundation. The simulations were performed on resources provided by the Swedish National Infrastructure for Computing (SNIC) at Chalmers Centre for Computational Science and Engineering (C
. This project has received funding from the European Research Council (ERC) under the European Union’s Horizon 2020 research and innovation programme under grant agreement no. 647121, the Swedish Research Council (grant no. 2016-05012), and the Knut och Alice Wallenberg Foundation. The simulations were performed on resources provided by the Swedish National Infrastructure for Computing (SNIC) at Chalmers Centre for Computational Science and Engineering (C $^{3}$
SE) and High Performance Computing Center North (HPC
$^{3}$
SE) and High Performance Computing Center North (HPC $^{2}$
N).
$^{2}$
N).


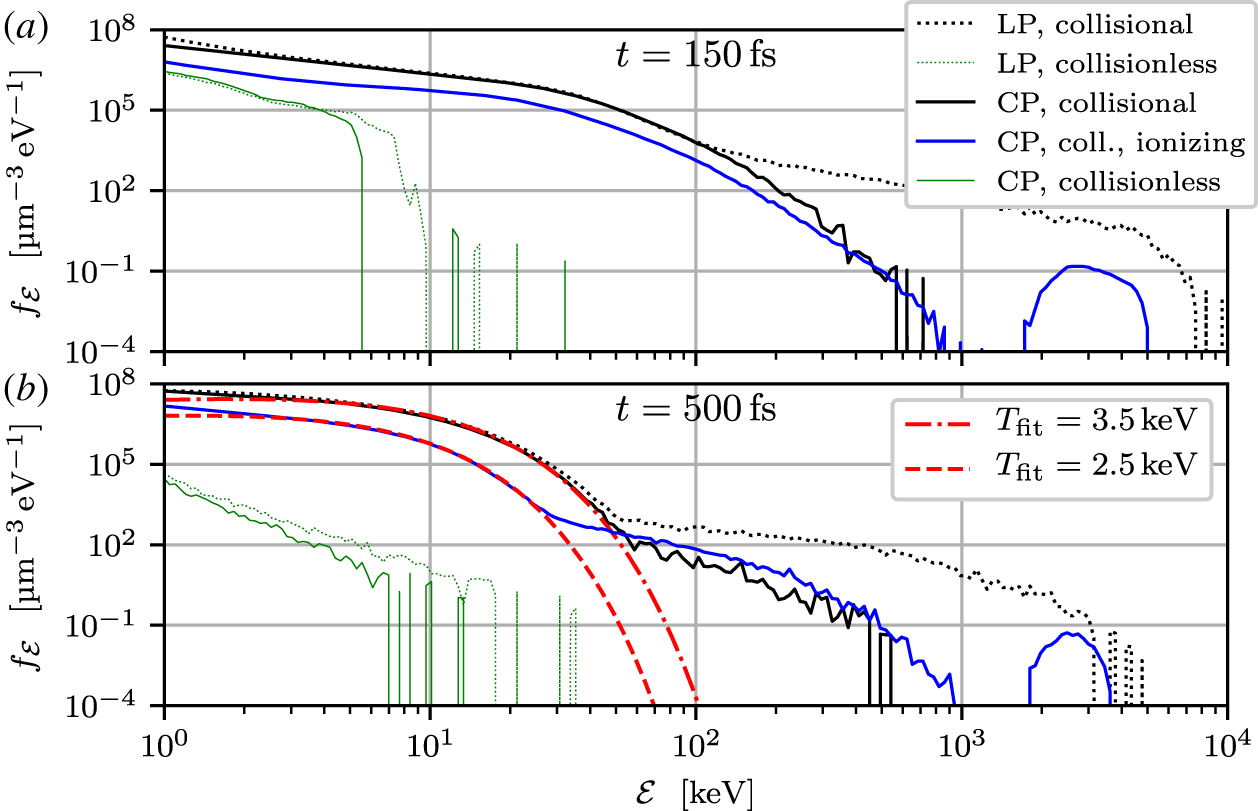


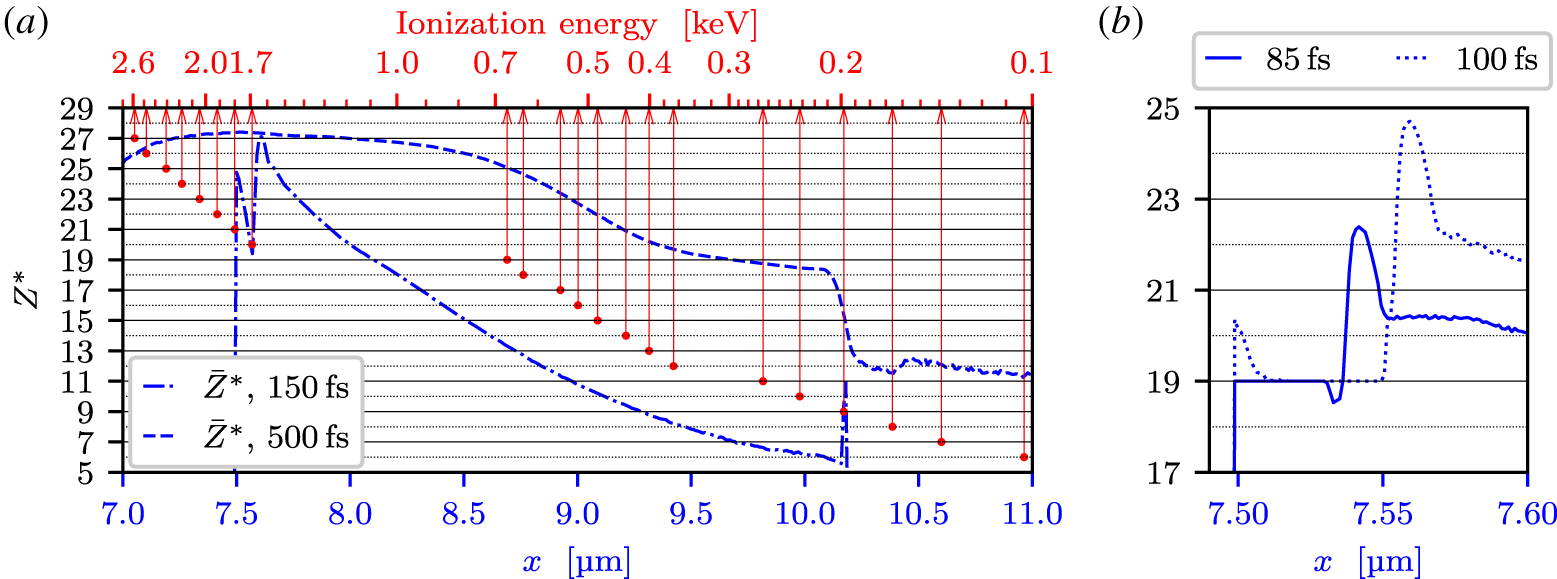


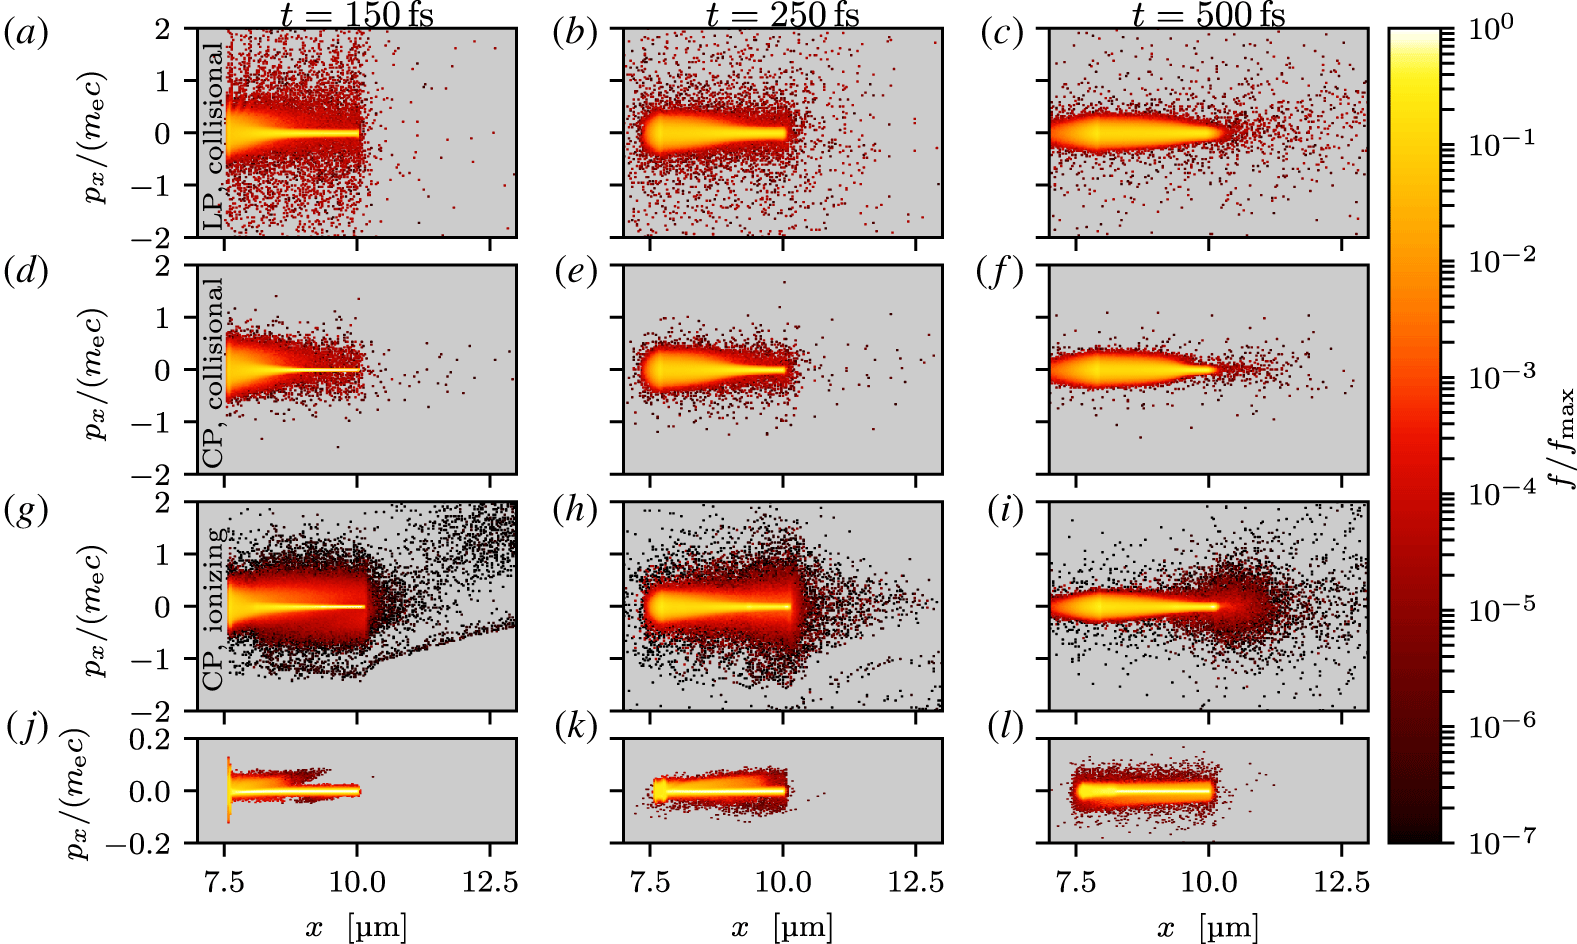


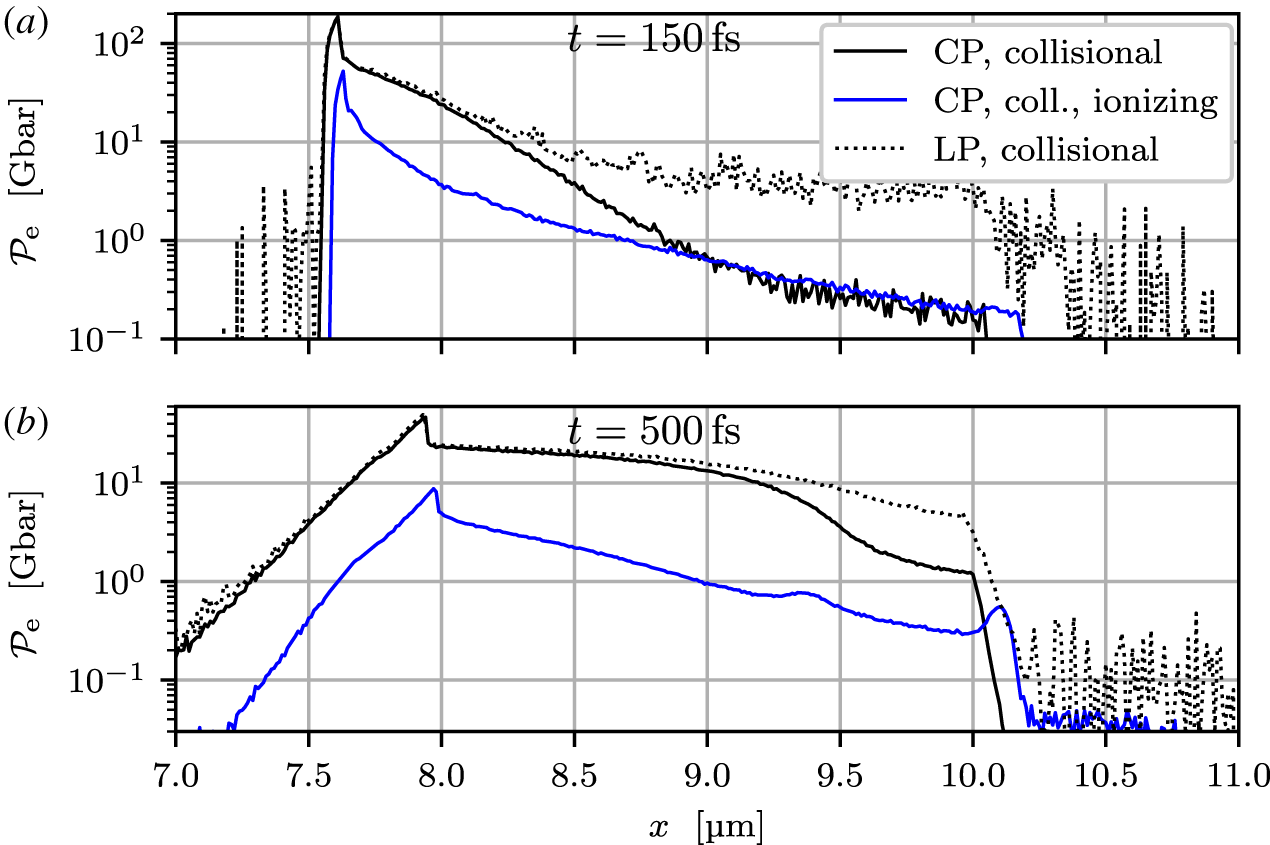


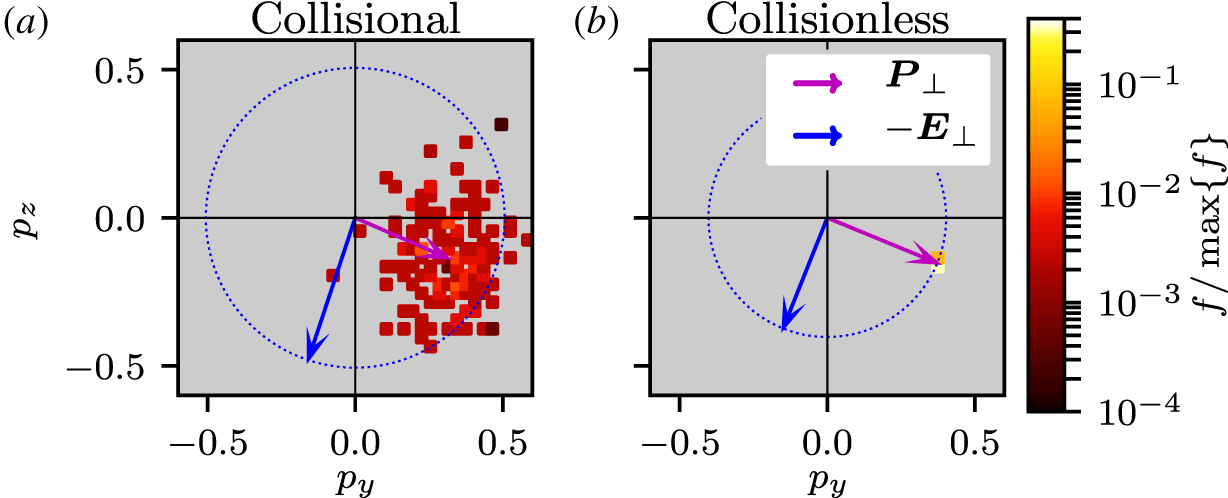


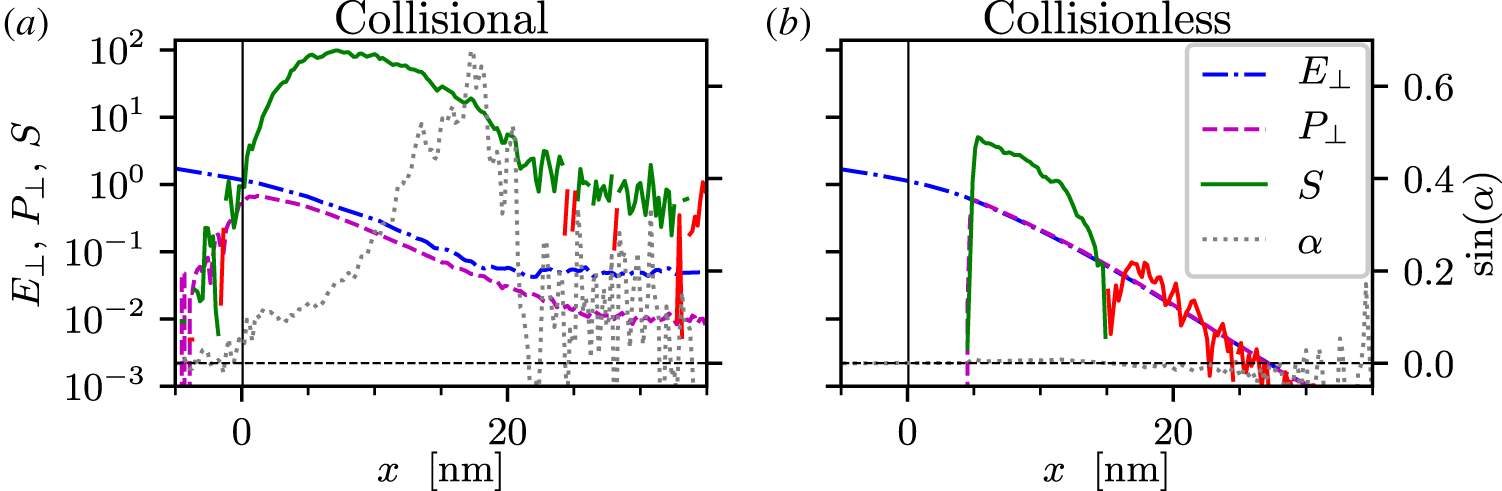


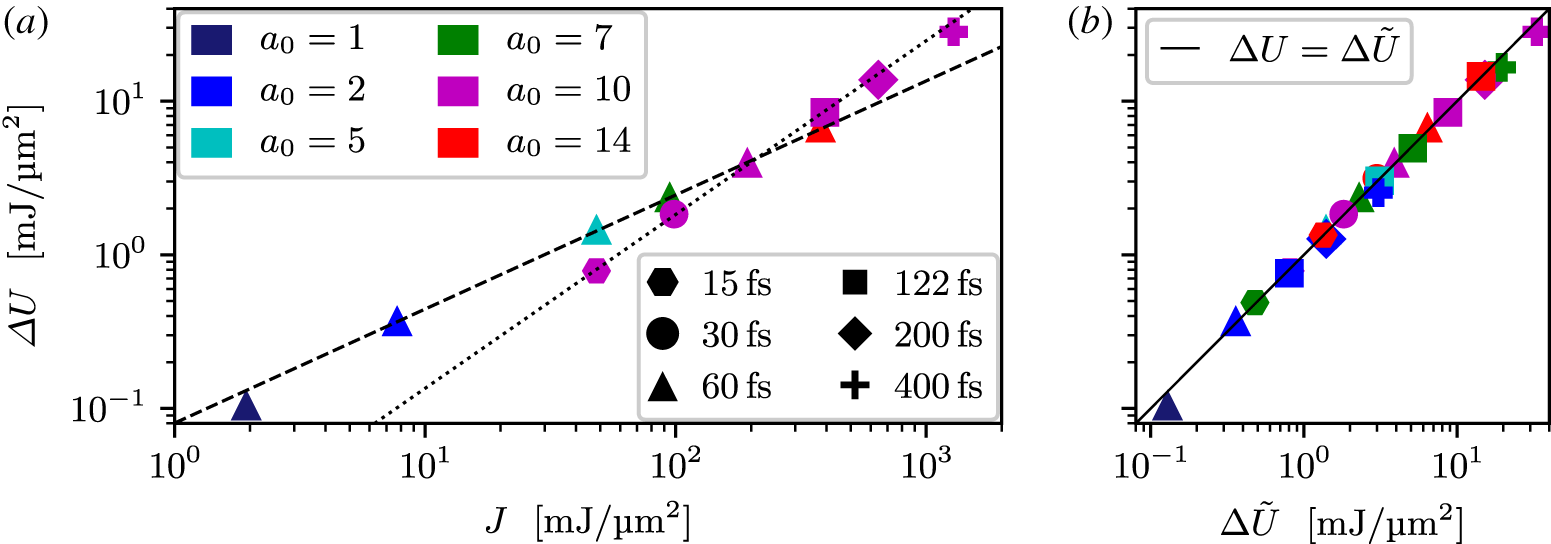


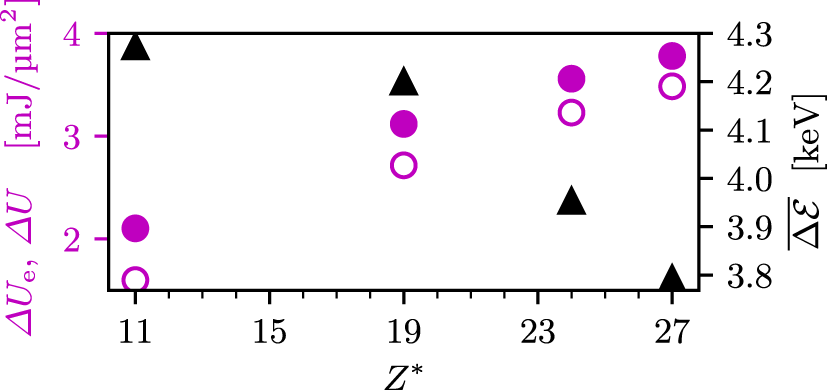


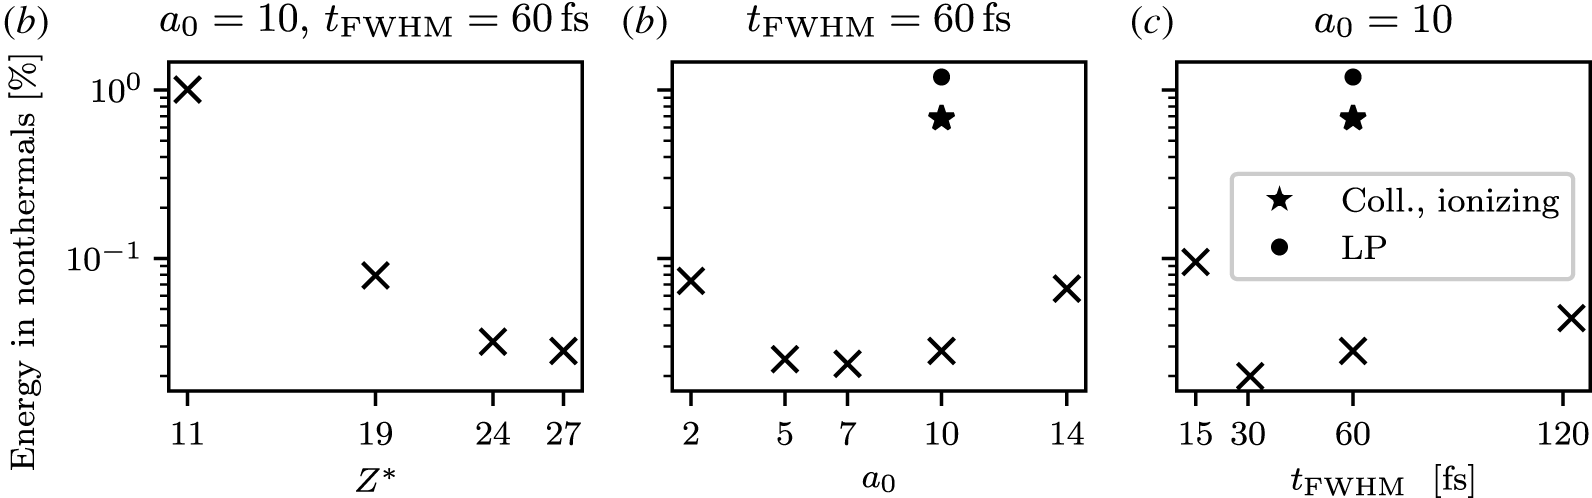


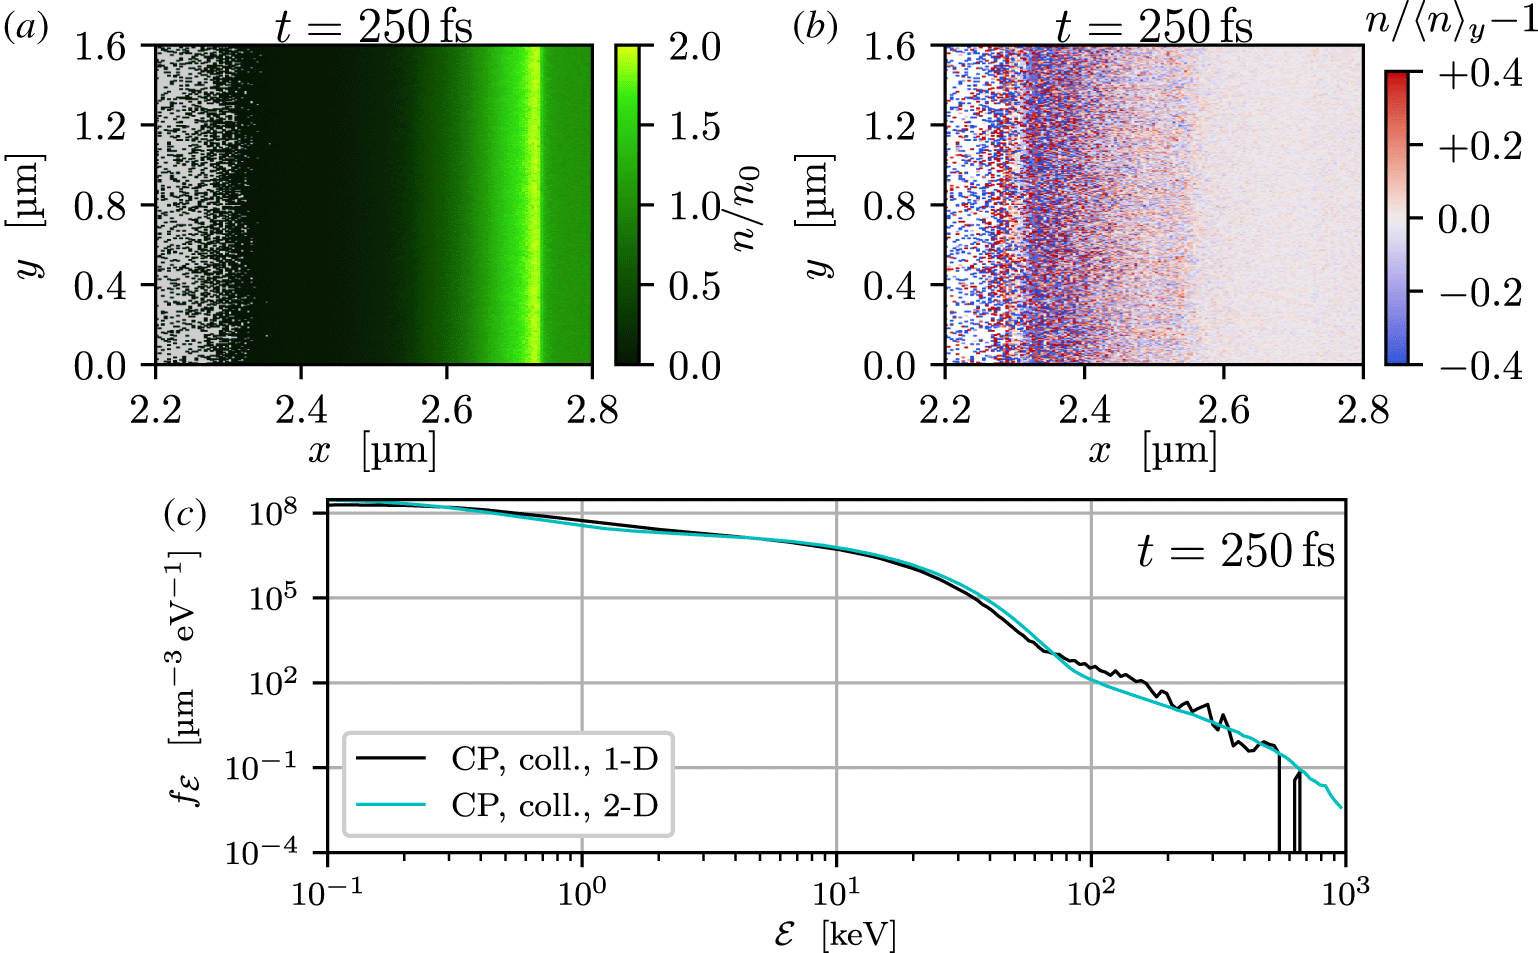


 Open access