Unhealthy diet pattern, sedentary lifestyle and genetic predisposition are the main determinants of obesity, CVD and the metabolic syndrome (MetS). The MetS is a cluster of abnormalities including hypertension, dyslipidaemia, glucose intolerance and abdominal obesity(Reference Wong1), increasing the risk for CVD and type 2 diabetes by 2- and 5-fold, respectively, compared with those without the syndrome(Reference Grundy2). Lifestyle changes including dietary interventions and physical activity are the first line therapies for both CVD and the MetS(Reference Pereira, Kottke and Jordan3). However, the long-term sustainability of these interventions is usually poor and patients progress to drug therapy. Given the serious side-effects associated with pharmacological drugs and their lack of effectiveness in some cases, scientific attention has been drawn towards application of naturally-derived compounds for the management of the MetS(Reference Lin, Xiao and Zhao4, Reference Amiot, Riva and Vinet5).
Bioactive peptides, encrypted within the primary sequences of food proteins but released by enzymatic digestion or food processing, can regulate blood pressure(Reference Majumder and Wu6), reduce hyperlipidaemia(Reference Udenigwe and Rouvinen-Watt7) and attenuate inflammation and oxidative stress(Reference Chakrabarti, Jahandideh and Wu8). In addition, several whey protein-derived dipeptides increased glucose uptake in myotubes(Reference Morifuji, Koga and Kawanaka9). Food proteins and peptides have also been reported to improve glucose tolerance and insulin sensitivity by stimulating Akt phosphorylation(Reference Tong, Li and Xu10–Reference Lu, Zeng and Hou14) and glycogen synthesis(Reference Morifuji, Koga and Kawanaka9, Reference Morato, Lollo and Moura15) in rodents and patients(Reference Kwak, Lee and Ahn16).
Another mechanism to improve glucose homeostasis and insulin sensitivity is by affecting adipose tissue(Reference Boonloh, Kukongviriyapan and Kongyingyoes12, Reference Noguchi, Yanagita and Rahman17–Reference Sawada, Sakamoto and Toh19). We recently reported the adipogenic, insulin mimetic and sensitising effects of an egg white hydrolysate (EWH) in 3T3-F442A pre-adipocytes(Reference Jahandideh, Chakrabarti and Davidge20). In vivo studies show benefits of egg peptides on reducing fat mass and adipocyte size, hepatic steatosis and inflammation, contributing to improved insulin sensitivity(Reference Moreno-Fernandez, Garces-Rimon and Gonzalez21–Reference Garces-Rimon, Gonzalez and Uranga23). EWH also exerted anti-hypertensive effects in spontaneously hypertensive rats by modulating the renin–angiotensin system (RAS)(Reference Jahandideh, Chakrabarti and Majumder24). The abundance of the vascular angiotensin-converting enzyme (ACE) and angiotensin type 1 receptor (AT1R) was reduced, while vascular angiotensin type 2 receptor (AT2R) abundance increased. RAS is believed to be linked with insulin resistance in animals and humans(Reference Marcus, Shefer and Stern25–Reference Underwood and Adler28).
As EWH has shown potential benefits on several aspects of the MetS especially on adipose tissue, we aimed to study the effects of EWH on glucose tolerance and insulin sensitivity in a rat model of insulin resistance. We hypothesised that EWH supplementation affects insulin signalling and improves insulin sensitivity in peripheral tissues, such as adipose tissue and skeletal muscle. The primary experimental outcome of the present study was oral glucose tolerance, while the effects of EWH on tissue insulin signalling, adipose tissue and local RAS protein abundance were assessed as the secondary outcomes.
Materials and methods
Preparation of egg white hydrolysate
Food-grade egg white hydrolysate was prepared in the Food Processing Development Centre according to the following conditions. Liquid egg white was diluted with water at a ratio of 1:1 (v/v) to obtain a solution with 5 % protein solid. After adjusting the pH to 8·0 with 2 m NaOH solution and the temperature to 65°C, thermoase (0·1 %, w/w) was added and protein digestion was carried out for 90 min. The enzyme was then inactivated by adjusting pH to 2·5 for pepsin digestion. The mixture was further hydrolysed at 55°C by 1 % pepsin for 180 min. The reaction was terminated by heating the solution at 95°C for 15 min and the hydrolysate was centrifuged (GEA Westfalia Separator Group) at 8510 rpm and average flow rate of 450 litres/h and then condensed to obtain approximately 10 % solid. The hydrolysate was then spray dried at an inlet temperature of 300°C and outlet temperature of 90°C, and the powder was collected and stored in food grade freezer (–20°C) for further experiments. EWH protein content was 77·7 % with ≥85 % of the peptides in the range of 1·36–6·51 kDa (online Supplementary material S1).
Animals and diets
The animal care protocol was approved by the University of Alberta Animal Care and Use Committee (protocol no. 1472) in accordance with the guidelines issued by the Canadian Council on Animal Care. The study also adhered to the Guide for the Care and Use of Laboratory Animals, United States National Institutes of Health. Male Sprague–Dawley rats (8 weeks old; n 48) weighing 339·5 ± 11·7 g were purchased from Charles River Laboratories and housed two per cage (conventional cages) with ad libitum access to standard chow and water. Rats were acclimatised for 1 week at the University of Alberta animal facility, exposed to a 12 h–12 h cycle of light and dark in a humidity- and temperature-controlled (60 % relative humidity, and 23°C) environment. Two animal trials were conducted to fulfill the purpose of the study. The first trial was conducted to determine the effective dosage of the treatment, whereas the second trial further verified the effectiveness of the treatment as compared with the control group. In both trials, after 1-week of acclimatisation, all rats received a high-fat diet (HFD) (20 %, w/w) for 6 weeks to induce glucose intolerance as shown before(Reference Hashemi, Yang and Yang29). Rats were then randomly assigned to one of the following groups: HFD, HFD+1 % EWH, HFD+2 % EWH and HFD+4 % EWH (n 7–8 each) in the first trial and to HFD and HFD+4 % EWH (n 7–8 each) in the second trial. The amount of the EWH used in the present study could reasonably be expected to be achieved in the human population. These diets continued for another 6 weeks with ad libitum access to food and water. The diet composition is presented in Table 1. Casein was used to make all diet groups isonitrogenous. In the second study, half of the animals (n 4) in each group were injected with insulin (2 IU/kg body weight) or saline intraperitoneally 10 min before euthanising to study insulin signalling in muscle and fat.
Composition of the experimental diets (g/kg)

HFD, high-fat diet; EWH, egg white hydrolysate.
Glucose and insulin tolerance tests
After 5 weeks of experimental diets (11 weeks in total on HFD), an oral glucose tolerance test (OGTT) was performed on rats after an overnight fast (16 h). Fasting blood glucose was measured using a glucometer (Accu-Check Compact Plus, Roche Diagnostics) and blood was collected from a tail vein for insulin determination. Then, rats were gavaged with 40 % glucose solution (2 g of glucose/kg body weight), and blood glucose was measured at different time points. About 50 μl of blood was taken at each time point during OGTT, centrifuged (1000 g, 20 min at 4°C) to obtain plasma, and stored at –20°C for insulin measurement. For the insulin tolerance test (ITT), rats were fasted for 4 h after 6 weeks of EWH treatment (12 weeks in total on HFD). Fasting blood glucose was measured and then each rat received 1·5 IU/kg body weight dose of insulin via an intraperitoneal injection. Blood glucose was determined at different time points postinjection. Homeostatic model assessment of insulin resistance was calculated based on the following equation: fasting glucose (mmol/l) × fasting insulin (µU/ml)/22·5.
Body weight and food intake measurement
Body weight was monitored weekly and food intake per two rats/cage was measured for 24 h three times per week throughout the study.
Tissue collection
At the end of the study, rats were euthanised by exsanguination via excision of the heart under inhaled isoflurane anaesthesia (isoflurane/oxygen; 1·0–2·5 % mixture) after a 16-h fast. A 3–5 ml blood sample was taken from all rats in both animal trials except for the insulin-injected rats. Muscle, liver, kidneys and fat pads were excised, washed in PBS, blotted, weighed and immediately frozen at –80°C until further analysis. Small sections of fresh fat pads were fixed in 10 % formalin (48 h) for paraffin-embedded fat samples to determine adipocyte size and distribution.
Tissue homogenisation and protein extraction
Hepatic and muscle proteins were extracted using an extraction buffer consisting of lysis buffer (Mitosciences Abcam), aprotinin (Calbiochem), sodium fluoride, sodium orthovanadate and protease inhibitor cocktail (Sigma Aldrich Canada). Proteins from fat pads were extracted using a commercially available kit (Invent Biotechnologies Inc.) as per the manufacturer’s instructions. The protein content was measured using total protein assay and sample aliquots were stored at –80°C.
Plasma analysis
Plasma TAG, total cholesterol and NEFA (Wako Pure Chemical Industries Ltd) concentrations were measured using direct colorimetric enzymatic reactions as per the manufacturer’s instructions. Samples from the OGTT were assayed for insulin using an ELISA kit (Alpco Diagnostics).
Inflammatory markers
Inflammatory cytokines in plasma and adipose tissue were assessed using a commercial rat inflammation ELISA strip (Signosis Inc.) as per the manufacturer’s instructions.
Adipocyte size and distribution
Adipose tissue paraffin blocks were cut into 5-µm sections and affixed in glass slides. One slide per sample was stained with hematoxylin-eosin, and ten photomicroscopic images of each slide were taken in a grid formation using microscope 20× objective lens and Axion Vision 4.8 software (ZEISS Imaging Software). A scale bar of 100 µm was placed in the images. The open source image processing program ImageJ software ‘freehand selections’ tool was used to measure adipocyte area (mm2) of 47–52 cells/sample.
Western blotting
Protein extracts were separated by SDS-PAGE electrophoresis on 10–12 % polyacrylamide gels, transferred to a polyvinylidene fluoride or nitrocellulose membrane, and incubated with antibodies against PPARγ and p-Akt (Cell Signaling Technology), Akt, ACE, AT1R, AT2R, glucose 6 phosphatase-α, and β-actin (Santa Cruz Biotechnology Inc.), ACE2 (Abcam), and phosphoenolpyruvate carboxykinase (PEPCK) (Cayman Chemical). PPARγ, ACE, ACE2, AT1R, AT2R, PEPCK and glucose 6 phosphatase bands were normalised to β-actin. Goat anti-rabbit and donkey anti-mouse conjugated secondary antibodies were purchased from LI-COR Biosciences. Protein bands were detected by a Li-cor Odyssey BioImager and quantified by densitometry using corresponding software Odyssey v3.0 (LI-COR) or Image Studio Lite 5.2.
Statistical analysis
All data presented are expressed as means and standard errors of three to ten rats from each treatment group as indicated in figure legends. Statistical analysis was performed using the GraphPad Prism software (version 6.0; GraphPad Software Inc.). Data were checked for normal distribution by the Shapiro–Wilk test. For analyses of OGTT, insulin ELISA, ITT and insulin sensitivity in fat and muscle, we used a two-way ANOVA. For all other data, one-way ANOVA, Kruskal–Wallis test and Student’s t test were used as indicated in figure legends. Bonferroni and Dunn’s post hoc tests were performed to assess differences between groups when approxpriate. For the primary outcome, oral glucose tolerance, we conducted a post hoc power analysis using effect size of 0·25, α 0·05 and power 0·8 for an ANOVA with repeated measures, within factors using G*power (version 3.1, University of Kiel), which indicated a total sample size of 20 was required. A P value of 0·05 was considered statistically significant.
Results
Food intake, body and tissue weight
No significant differences were observed in the body weight and food intake (Table 2) between the groups throughout the study, indicating that the palatability of the diets did not affect the results. Moreover, there were no significant differences in liver and kidney relative weights between groups. However, 4 % EWH-fed rats had lower fat mass compared with the HFD group as measured by the retroperitoneal and epididymal fat pad relative weights (Table 2). EWH had no adverse effects on rats in the present study.
Oral glucose tolerance test and insulin tolerance test
The glucose tolerance of the rats is shown in Fig. 1(a). Rats receiving 4 % EWH had significantly lower glucose response at t = 30, 60, 90 and 120 compared with the HFD group. Despite a better glucose tolerance in the HFD+4 % EWH group, no significant difference in insulin concentrations was observed during OGTT between the HFD+4 % EWH and HFD groups (Fig. 1(b)).
Food intake, body composition and metabolic profile of rats
(Mean values with their standard errors)

HFD, high-fat diet; EWH, egg white hydrolysate; BW, body weight; HOMA-IR, homeostatic model assessment of insulin resistance.
* P < 0·05 compared with the HFD.
† Body weight and food intake throughout the 12-week study period (n 7–16 rats).
‡ To convert kcal to kJ, multiply by 4·184.
§ Relative tissue weight after the 12-week period (n 7–16 rats).
‖ Metabolic profile after the 12-week period (n 4–12 rats).
¶ HOMA-IR = fasting glucose (mmol/l) × fasting insulin (μU/ml)/22·5.
In vivo characterisation of glucose homeostasis. (a) Oral glucose tolerance test after 5 weeks of treatment with a high-fat diet (20 %, w/w, -•-) supplemented with 1 % (-▪-), 2 % (-▴-) and 4 % (-▾-) of egg white hydrolysate (n 4–11 rats). (b) Plasma insulin concentrations measured in blood samples collected during the oral glucose tolerance test (n 4 rats). (c) Insulin tolerance test after a 4-h fast. Blood glucose levels are shown as percentage of basal glucose (n 5 rats). Values are means, with their standard errors represented by vertical bars. Analysis was by two-way ANOVA followed by Bonferroni’s post hoc comparison test. Significantly different compared with the high-fat diet group: * P < 0·05, ** P < 0·01.
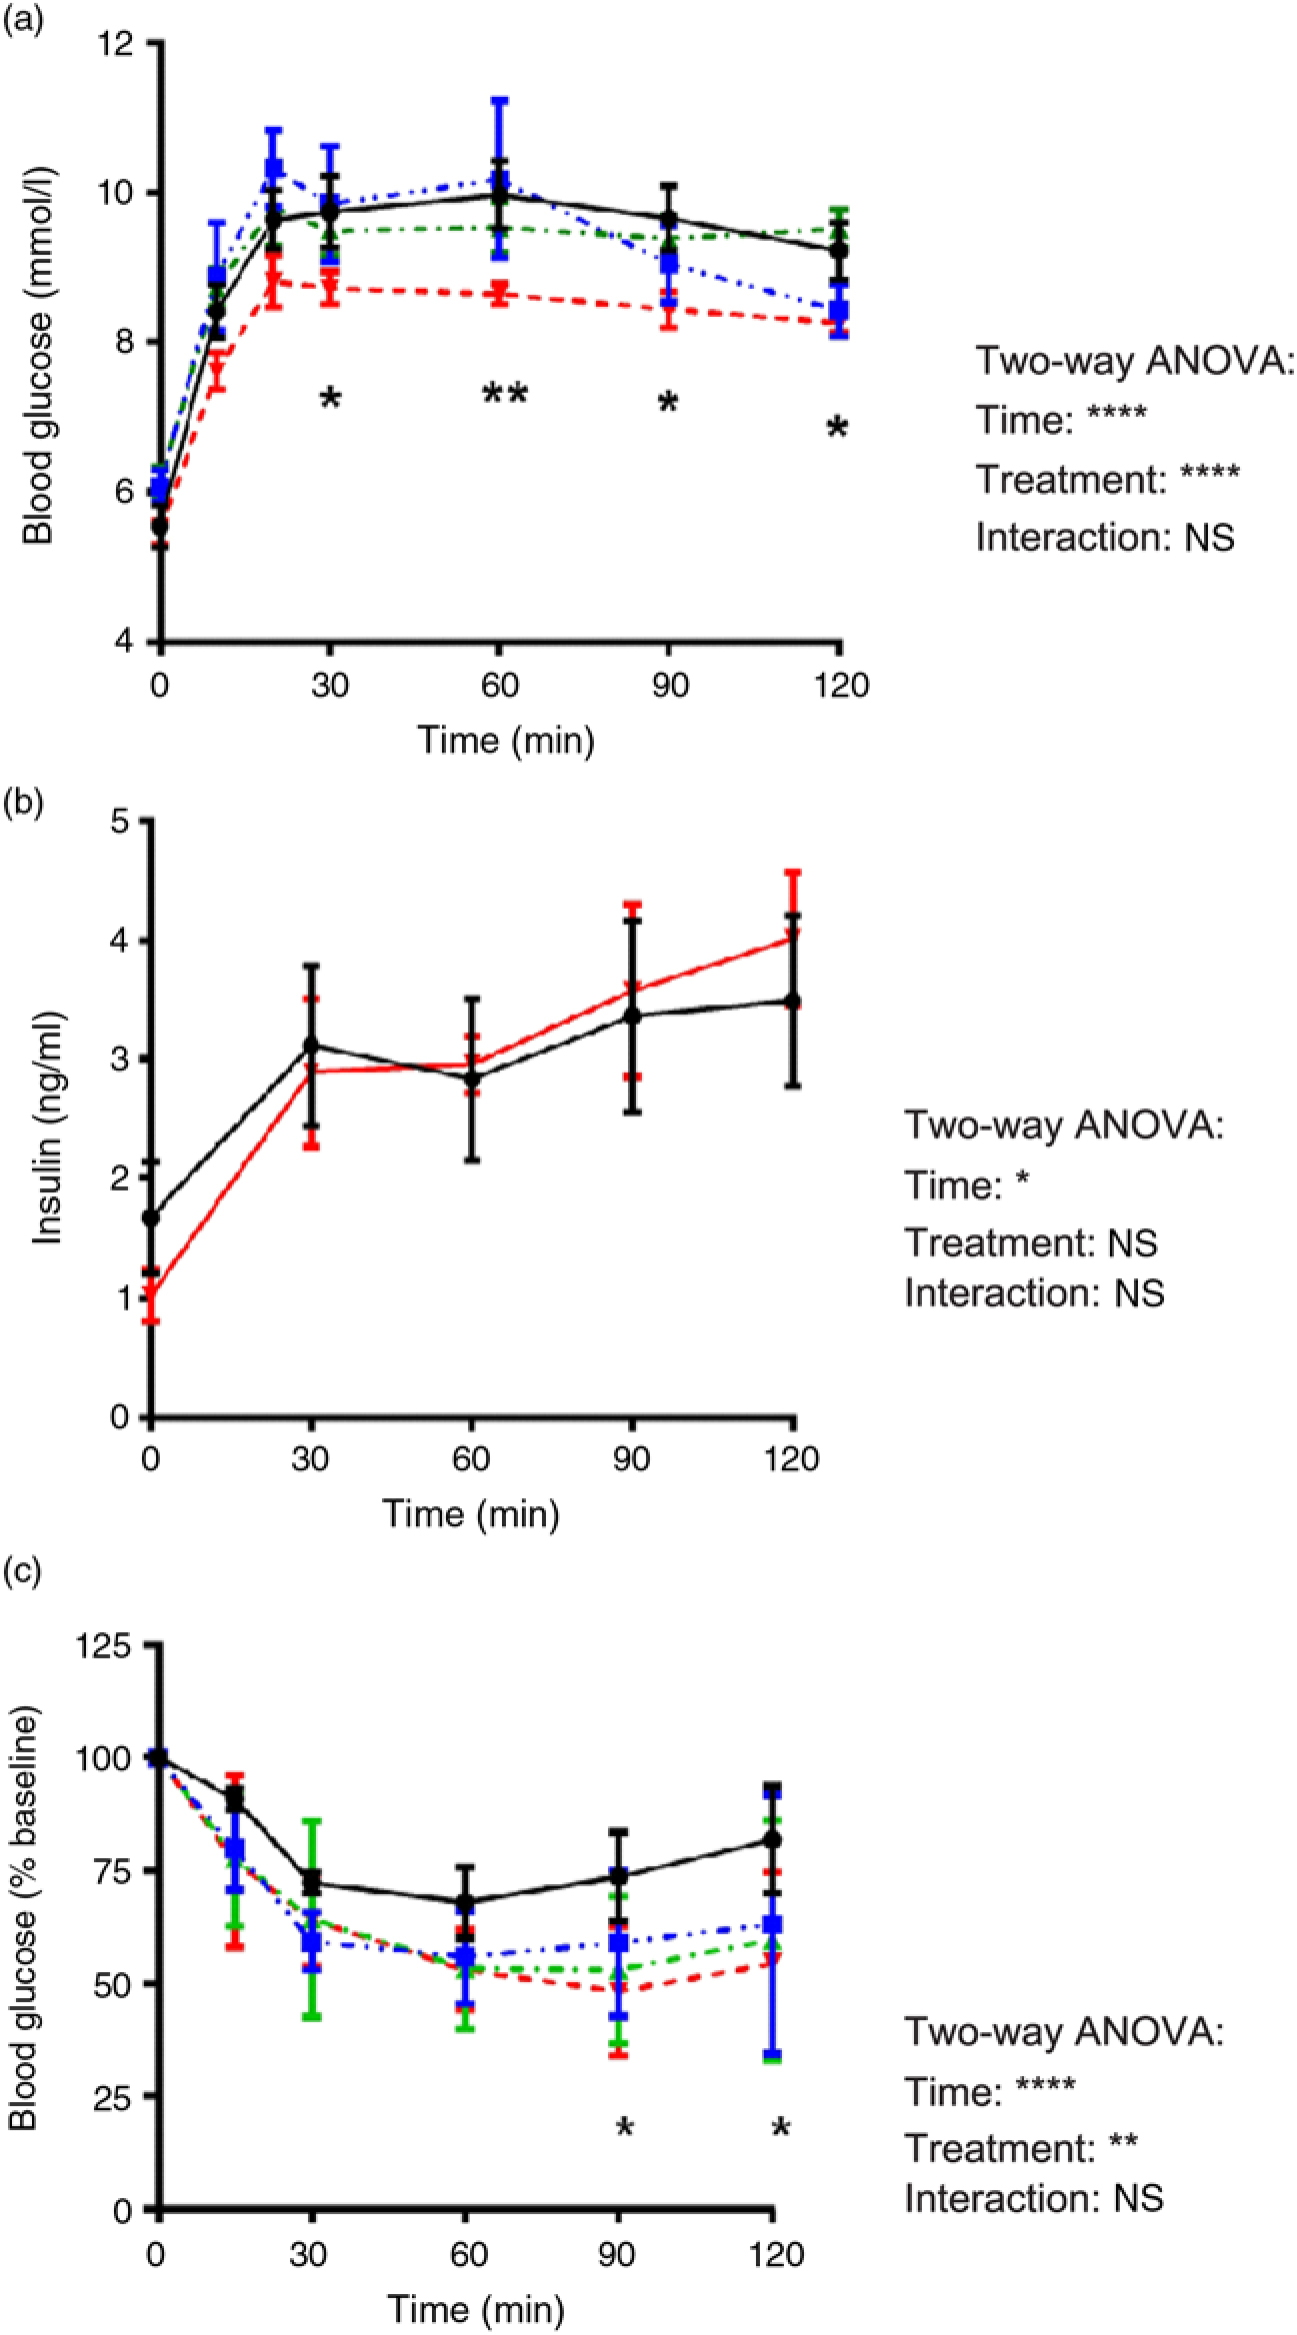
Rats in the EWH-treated groups tended to have lower blood glucose levels during the glucose disappearance phase (0–30 min) of the ITT, but not at a significant level. However, the difference became more evident between groups during the recovery phase (60–120 min), where the HFD+4 % EWH group exhibited significantly lower glucose levels at t = 90 and 120 min (Fig. 1(c)).
Plasma metabolic profile
The metabolic profile of the rats is presented in Table 2. There were no significant differences in fasting glucose and insulin concentrations between groups. The HFD+4 % EWH group showed lower fasting plasma TAG compared with the HFD group, whereas no differences were observed regarding NEFA and total cholesterol.
Plasma and adipose tissue inflammatory markers
Plasma inflammatory markers in the HFD and HFD+4 % EWH groups showed comparable levels of TNF-α and Rantes. EWH feeding significantly reduced IL-1α, IL-β and monocyte chemotactic protein-1 compared with the HFD group as shown in Fig. 2. In adipose tissue, except for a significant increase in epididymal fat IL-6 in the HFD+4 % EWH group compared with HFD, no other changes were observed in inflammatory cytokines (online Supplementary material S2).
Effect of egg white hydrolysate feeding on plasma inflammatory markers in insulin-resistant (high-fat diet-fed) rats. ▪, High-fat diet; □, high-fat diet + 4 % egg white hydrolysate. Values are means (n 4), with their standard errors represented by vertical bars. Analysis was by two-tailed t test. Significant difference: * P < 0·05, ** P < 0·01. MCP-1, monocyte chemotactic protein-1; Rantes, regulated on activation, normal T cell expressed and secreted; MIP, macrophage inflammatory protein.

Tissue insulin sensitivity measured by p-Akt
The treatment of HFD+4 % EWH improved glucose and insulin tolerance in rats as shown by OGTT and ITT. We further investigated tissue insulin sensitivity as one of the possible mechanisms of action of EWH as this treatment enhanced p-Akt in our previous cell study in adipocytes(Reference Jahandideh, Chakrabarti and Davidge20). Akt signalling plays a central role in insulin-stimulated glucose uptake in both muscle and adipose tissue(Reference Steinberg and Kemp30). Muscle, liver, retroperitoneal and epididymal fat pads were studied as the major tissues responsible for insulin-dependent glucose clearance. Fig. 3(a)–(c) shows enhanced p-Akt in muscle, retroperitoneal and epididymal fat of the HFD+4 % EWH group compared with HFD control. While insulin administration failed to induce phosphorylation of Akt in muscle and adipose tissue of the HFD group, an indication of insulin resistance state, 4 % EWH supplementation enhanced insulin sensitivity significantly in muscle, epididymal and retroperitoneal fat depots. However, liver p-Akt was unaffected by EWH (Fig. 3(d)).
Tissue insulin sensitivity assessed by phosphorylation of Akt. Insulin sensitivity was measured in epididymal fat (a), retroperitoneal fat (b), muscle (c) and liver (d) of rats euthanised in fasted (▪) and intraperitoneal insulin-injected (▒) states in high-fat diet- and high-fat diet+4 % egg white hydrolysate-treated rats. The p-Akt protein band was normalised to total Akt as a measure of insulin sensitivity in both groups. Values are means (n 4–8 rats), with their standard errors represented by vertical bars. Data were analysed by two-way ANOVA followed by Bonferroni’s post hoc comparison test. *P < 0·05, **P < 0·01.

Adipocyte morphological changes in retroperitoneal and epididymal adipose tissue
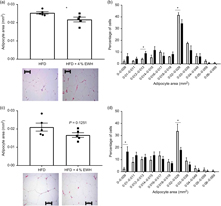
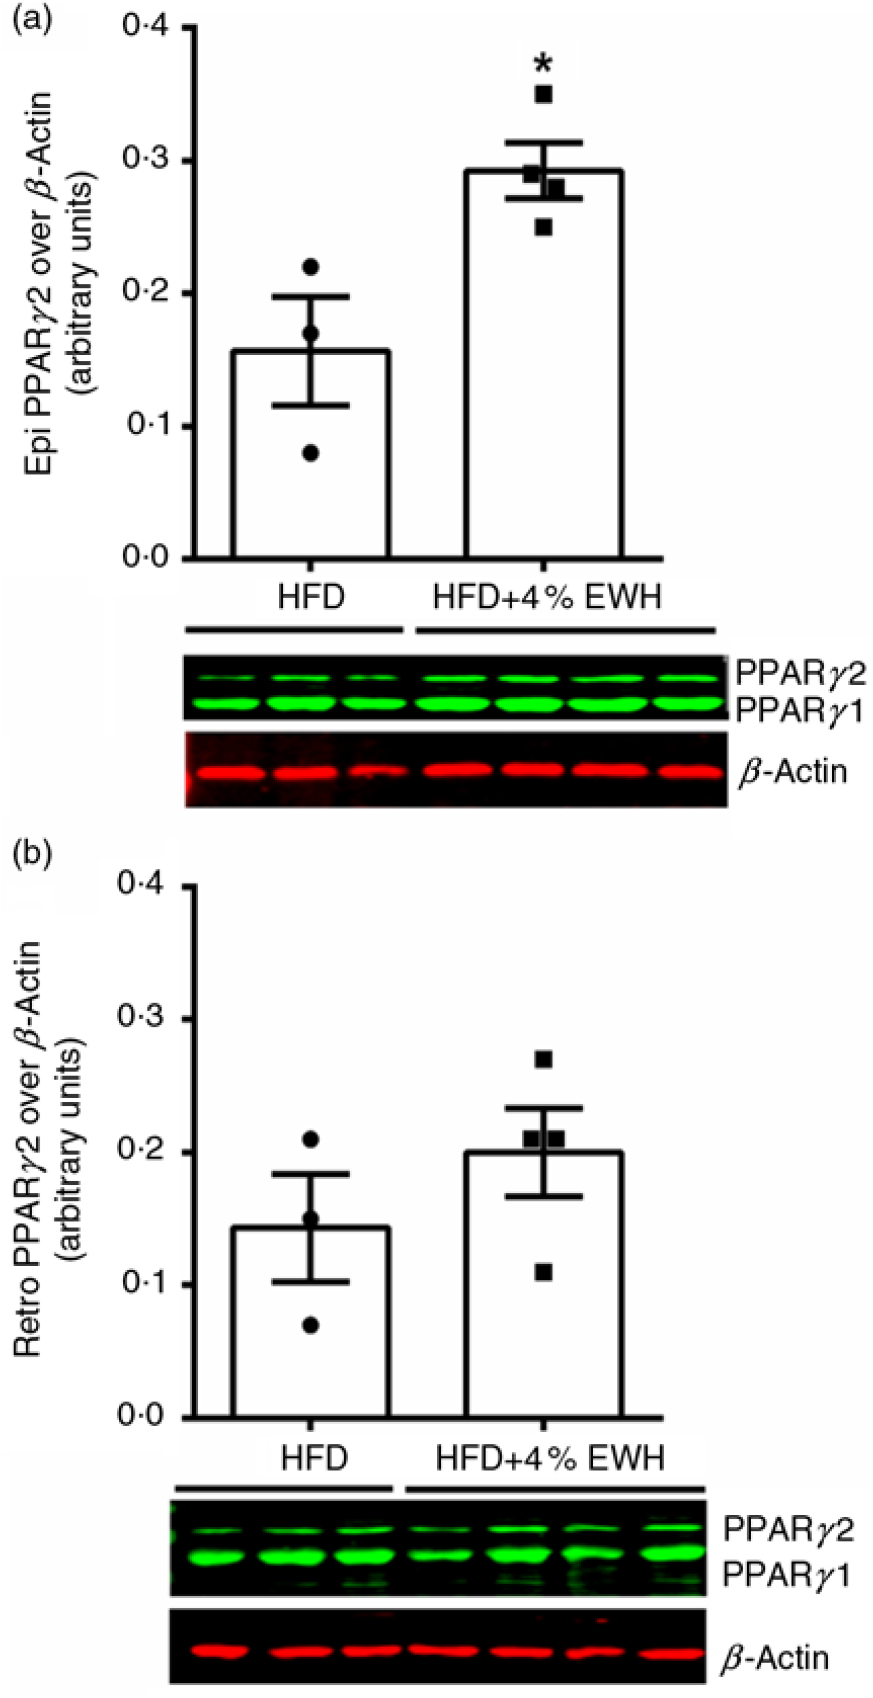
As EWH enhanced insulin sensitivity in adipose tissue, we studied the effects of EWH treatment on markers of adipocyte differentiation, including adipocyte size and PPARγ abundance. Fig. 4(a) shows that EWH significantly reduced adipocyte size in retroperitoneal adipose tissue as measured by mean adipocyte area from 0·025 to 0·022 mm2, whereas the size reduction in epididymal fat (from 0·021 to 0·017 mm2) was not statistically significant (Fig. 4(c)). Nevertheless, both fat pads presented significant changes towards smaller adipocytes phenotype when the adipocyte distribution was analysed by area intervals. The number of adipocytes within the range of 0·012–0·013 mm2 was significantly increased in retroperitoneal fat pad whereas the number of larger adipocytes (0·02–0·029 mm2) decreased significantly (Fig. 4(b)). Similarly, epidydimal fat pad showed increased number of small adipocytes (from 0 to 0·009 mm2) and decreased number of larger adipocytes (from 0·02 to 0·029 mm2) as shown in Fig. 4(d) (P < 0·05). To further explore the effects of 4 % EWH on adipocyte differentiation at the molecular level, we measured PPARγ2 protein abundance in adipose tissue. PPARγ is a transcription factor mainly expressed in adipose tissue and involved in adipocyte differentiation by regulating several genes in lipid metabolism and enhancing insulin sensitivity(Reference Olefsky and Saltiel31). PPARγ2 abundance was significantly increased following 4 % EWH treatment in epididymal fat compared with the HFD group (Fig. 5(a)). Although PPARγ2 was enhanced in retroperitoneal fat, this increase was not significant (Fig. 5(b)).
Adipocyte distribution in retroperitoneal and epididymal adipose tissue. Mean adipocyte area and adipocyte area distribution were analysed in (a, b) retroperitoneal and (c, d) epididymal adipose tissue. Photomicroscopic images of adipocytes using 20× objective lens for high-fat diet (□) and high-fat diet+4 % egg white hydrolysate (▪) groups are shown. Scale bar indicates 100 μm. Values are means (n 5 rats), with their standard errors represented by vertical bars. Data were analysed by two-tailed t test. * Significant difference (P< 0·05).

Tissue protein abundance of renin–angiotensin system and gluconeogenesis components
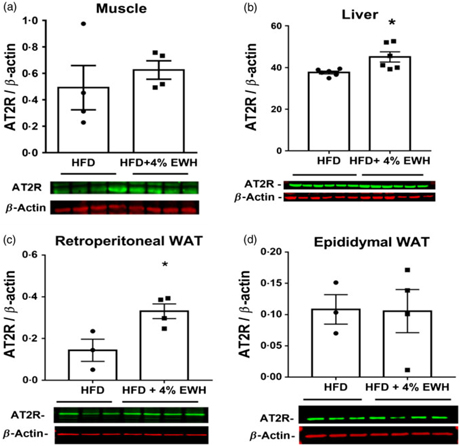
As one of the potential mechanisms for enhanced insulin sensitivity, we measured tissue protein abundance of different components of RAS, namely ACE, ACE2, AT1R and AT2R in the HFD and HFD+4 % EWH groups (Fig. 6 and online Supplementary material S3–S5). Generally, no significant changes were observed in the protein abundance of tissue RAS components except for the AT2R, which was increased significantly in the liver (Fig. 6(b)) and retroperitoneal fat pad (Fig. 6(c)) in the HFD+4 % EWH group compared with the HFD group. Hepatic glucose output contributes to blood glucose concentrations; however, no changes in liver PEPCK and glucose 6 phosphatase protein abundance were observed (online Supplementary material S6).
Adipose tissue PPARγ abundance. The PPARγ2 protein band was normalised to β-actin as the loading control in (a) epididymal fat, and (b) retroperitoneal fat in the high-fat diet (HFD)- and high-fat diet+4 % egg white hydrolysate (HFD+4 % EWH)-treated groups. Values are means (n 3–4 rats), with their standard errors represented by vertical bars. Data were analysed by two-tailed t test. * Significant difference (P < 0·05).
Angiotensin II type 2 receptor (AT2R) protein abundance in skeletal muscle (a), liver (b) and adipose tissue (c and d). The protein band of AT2R was normalised to β-actin as the loading control in the high-fat diet (HFD)- and high-fat diet+4 % egg white hydrolysate (HFD+4 % EWH)-treated groups. Values are means (n 4–6 rats), with their standard errors represented by vertical bars. Data were analysed by two-tailed t test. * Significant difference (P < 0·05). WAT, white adipose tissue.

Discussion
The present study revealed that supplementing a HFD with 4 % EWH: (i) improved glucose tolerance with no changes in the postprandial insulin; (ii) enhanced overall insulin sensitivity as measured by ITT as well as enhanced muscle and fat insulin signalling in both fasted and insulin stimulated states; (iii) reduced systemic pro-inflammatory cytokines IL-1α, and IL-1β, and chemokine monocyte chemotactic protein-1; (iv) switched adipocyte phenotype towards smaller sizes in both retroperitoneal and epididymal adipose tissue along with increased PPARγ2 expression in epididymal adipose tissue, which is consistent with adipocyte differentiation.
We focused on the ability of EWH to alleviate insulin resistance, a key component of the MetS(Reference Lteif, Han and Mather32). Prolonged HFD feeding is known to induce insulin resistance and glucose intolerance(Reference Hashemi, Yang and Yang29, Reference Yang, Hashemi and Han33, Reference Cerf, Chapman and Louw34), adipocyte dysfunction and inflammation(Reference Shihabudeen, Roy and James35, Reference Johnson, Trasino and Ferrante36) and dyslipidaemia(Reference Jung, Cho and Choi37, Reference Shih, Shlau and Lin38) in rodents. Therefore, HFD-induced insulin-resistant Sprague–Dawley rats were chosen as the animal model. Our data also confirmed the presence of insulin resistance in the HFD group as tissue Akt phosphorylation (especially in the muscle and adipose tissue) was not significantly increased after exogenous insulin injection in these rats.
Supplementing the HFD with 4 % EWH improved glucose tolerance in insulin-resistant rats with no changes in plasma insulin concentrations, suggesting that 4 % EWH-treated rats are potentially more sensitive to insulin. The ITT results confirmed this hypothesis. Furthermore, 4 % EWH tended to increase glucose disappearance in the first phase (0–60 min) and potentially pressed hepatic glucose production in the second phase (60–120 min) of the ITT; however, analysis of gluconeogenesis enzymes such as PEPCK and glucose 6 phosphatase-α in liver revealed no differences after EWH treatment (online Supplementary material S6). Although we did not observe any significant changes in the protein abundance of gluconeogenesis enzymes, EWH treatment may have affected the activity of these enzymes and/or other enzymes involved in the hepatic glucose production. Our data suggest that the improvement in glucose tolerance after EWH treatment was at least in part due to the increased insulin-stimulated glucose uptake. Food-derived bioactive peptides including egg-derived peptides have been recently reported to beneficially affect insulin signalling and glucose homeostasis(Reference de Campos Zani, Wu and Chan39).
We previously showed a significant increase in insulin sensitivity through enhanced p-Akt in EWH-treated 3T3 adipocytes(Reference Jahandideh, Chakrabarti and Davidge20). To further explore whether 4 % EWH treatment enhanced tissue insulin signalling, we assessed p-Akt in major insulin-sensitive tissues namely liver, muscle and adipose tissue. Interestingly, consistent with our previous data, insulin sensitivity was enhanced significantly in epididymal and retroperitoneal fat depots as well as muscle in EWH-treated rats (Fig. 3). Therefore, we concluded that enhanced insulin signalling in adipose tissue and muscle contributed to the observed improvement in glucose tolerance after 4 % EWH treatment. When assessing the rats’ metabolic profile, no significant effect on plasma lipid components was observed except for reduced fasting plasma TAG in the 4 % EWH group. Our current data do not explain the change in plasma TAG concentration; however, this may be due to reduced de novo lipid synthesis by the liver or enhanced tissue accumulation, especially in adipose tissue as opposed to remaining in the circulation(Reference Horton, Goldstein and Brown40). Smaller adipocytes having more capacity to store lipids contribute to reduced plasma TAG and increased insulin sensitivity(Reference Goossens41). Indeed, the reported enhanced insulin sensitivity in adipose tissue along with the significantly reduced adipocyte size and higher PPARγ2 abundance after 4 % EWH treatment in the present study could indicate enhanced adipocyte differentiation leading to reduced plasma TAG levels. WEKAFKDED, QAMPFRVTEQE, ERYPIL and VFKGL are the bioactive peptides in EWH with PPARγ stimulatory activity in adipocytes(Reference Jahandideh, Liu and Wu42). Pioglitazone, a PPARγ agonist, reduced adipocyte size and plasma TAG and improve tissue insulin sensitivity in mice(Reference Kubota, Terauchi and Kubota43). In another study, pioglitazone improved insulin sensitivity and stimulated adipocyte differentiation in rats without affecting PEPCK expression level in liver(Reference Hallakou, Doare and Foufelle44), similar to our data. Furthermore, we observed reduced plasma pro-inflammatory markers (IL-1α and β and monocyte chemotactic protein-1) in the HFD+4 % EWH-fed rats indicating lower systemic inflammation compared with the HFD group. Obesity has been linked with a low-grade chronic inflammatory response characterised by altered adipokines production and increased markers of inflammation(Reference Neels and Olefsky45). Considering the critical role of inflammation in the occurrence of insulin resistance(Reference de Luca and Olefsky46), the importance of the anti-inflammatory effect of the EWH in HFD-treated rats is highlighted. Inflammation within white adipose tissue, induces insulin resistance locally and systematically due to the diffuse nature and close association of adipose tissue with other metabolically active tissues(Reference Kassi, Pervanidou and Kaltsas47).
Although we did not target the specific association of adipose tissue to the less inflammatory phenotype of EWH-treated rats, our data on enhanced PPARγ2 expression in the epididymal fat (Fig. 5(a)) and tissue insulin sensitivity, consistent with the outcomes of our previous study in cells(Reference Jahandideh, Chakrabarti and Davidge20) points to a potential effect of the treatment on adipose tissue. When assessing the adipose tissue inflammatory markers, however, we did not observe any changes between the groups (online Supplementary material S2).
Modulation of RAS components is another potential mechanism for the observed enhanced tissues insulin sensitivity following treatment with 4 % EWH. RAS is mostly known for its systemic effects on blood pressure. In addition to systemic RAS, RAS components have also been reported to be expressed in tissues such as adipose tissue, liver and pancreas known as local RAS(Reference Paul, Poyan Mehr and Kreutz48). Local RAS activation has been linked to IR and type 2 diabetes(Reference Underwood and Adler28, Reference Chu and Leung49). RAS blockade enhances glucose tolerance and whole-body insulin sensitivity in insulin-resistant animal models or insulin-resistant hypertensive humans(Reference Henriksen, Jacob and Kinnick26, Reference Dietze and Henriksen50–Reference Lender, Arauz-Pacheco and Breen54). AT1R and AT2R regulate insulin action in muscle(Reference Chai, Wang and Dong55) while RAS overexpression in skeletal muscle may impair insulin signalling and reduce glucose transporters expression restricting glucose uptake(Reference Henriksen56). IRW (Ile-Arg-Trp), an egg-derived tripeptide with antihypertensive effects(Reference Majumder, Chakrabarti and Morton57), improves Ang II-induced insulin resistance in L6 cells, partially through reduced AT1R abundance and antioxidant activity(Reference Son, Chan and Wu58). Despite the potential link between local RAS and tissue insulin sensitivity, this pathway appears not to be mainly involved in the observed effects of EWH on improved insulin sensitivity in the present study. This is because between all the studied RAS components including ACE, ACE2, AT1R and AT2R in four different tissues, only AT2R protein abundance in liver and fat was affected. Meanwhile, we cannot exclude the possibility that this change may have played a role in tissue insulin sensitivity in the present study. The reported effects of AT2R on insulin sensitivity and adipocyte differentiation are controversial. Yvan-Charvet et al. showed the deleterious effects of AT2R-dependent Ang II signalling on adipose tissue mass and glucose intolerance in mice(Reference Yvan-Charvet, Even and Bloch-Faure59), whereas, Shum et al. documented the involvement of AT2R in early adipocyte differentiation and its role in restoring normal adipocyte morphology and improving insulin sensitivity in rats(Reference Shum, Pinard and Guimond60). In fact, increasing AT2R/AT1R activity ratio has been suggested as a pharmacological manipulation to improve muscle insulin sensitivity and glucose metabolism(Reference Chai, Wang and Dong55). Therefore, this aspect needs further investigations in future studies.
In conclusion, the present study confirms the beneficial effects of chronic supplementation with 4 % EWH on glucose tolerance and insulin sensitivity in HFD-induced insulin-resistant rats mainly through affecting insulin sensitivity in adipose tissue and skeletal muscle as well as enhancing adipocyte differentiation. Because the effective dosage of the EWH used in the present study is feasible to be incorporated into a human diet, it is worthwhile to investigate the potential effects of this treatment in humans. It should be mentioned, however, that one of the limitations of the present study is the absence of a standard chow diet group, which would permit conclusions about whether EWH returned glucose tolerance to normal.
Acknowledgements
The present study was supported by the Alberta Livestock and Meat Agency (J. W., grant number 2015P005R); Egg Farmers of Canada (N/A); and the Natural Sciences and Engineering Research Council of Canada (J. W., grant number CRDPJ 490517-15). S. C. C. Z. is the recipient of scholarships from the University of Alberta and the Alberta Diabetes Institute. None of the funders cited here in had any roles in the design, analysis, or writing of this article.
F. J., J. W. and C. B. C. designed the experiments; F. J. conducted the animal experiments; F. J. and S. C. C. Z. performed the tissue experiments, analysed the data, and wrote the manuscript. M. J. performed the PPARγ analysis; S. T. D., S. P., C. B. C. and J. W. edited the manuscript.
None of the authors has any conflicts of interest to declare.
Supplementary material
For supplementary materials referred to in this article, please visit https://doi.org/10.1017/S0007114519000837