

Recent estimates suggest that 16·2 % of Canadian children are overweight and 8·1 % are obese. This high prevalence of childhood overweight and obesity is a significant concern, as obesity adversely impacts children’s physical, mental and social health( Reference Guh, Zhang and Bansback 1 , Reference Wang and Veugelers 2 ). Dietary behaviours that increase obesity and chronic disease risk are prevalent among Canadian children, including a high frequency of consumption of fast foods and sugar-sweetened beverages, and limited intake of fruits and vegetables( Reference Garriguet 3 , Reference Garriguet 4 ). Childhood is a formative period for future habits; thus supporting children to eat healthfully at an early age is important to establish a solid foundation for lifelong healthy eating and to reduce obesity and chronic disease at a population level.
Recreation and sport settings (RSS) have been identified as ideal settings for youth health promotion because they provide access to affordable physical activities. Evidence indicates, however, that many RSS have unhealthy food environments that may paradoxically increase obesity risk in children( Reference Naylor, Bridgewater and Purcell 5 – Reference Olstad, Raine and McCargar 9 ). Success in using school nutrition policies/guidelines to improve children’s food environments, dietary behaviours and body weights( Reference Taber, Chriqui and Chaloupka 10 – Reference Wiecha, Finkelstein and Troped 16 ) suggests that similar measures might be leveraged within RSS. Several Canadian provinces have therefore developed voluntary nutrition guidelines for this sector that are intended to facilitate access to healthy foods/beverages. These standards are underpinned by nutrient profiling systems that classify foods on the basis of their nutritional composition( Reference Tetens, Oberdorfer and Madsen 17 ), providing a basis to identify foods to limit and promote within these food environments.
A large number of nutrient profiling systems exist within Canada and internationally, as many jurisdictions have developed their own versions( Reference Rayner, Scarborough and Kaur 18 – 20 ). While distinct nutrient profiling systems can allow jurisdictions to tailor standards to their respective health-related objectives, to the nutritional concerns of their populations and to region-specific practical constraints, they can also create confusion as to what constitutes a ‘healthy food’, may represent an unnecessary duplication of efforts and may discourage product reformulation by industry due to barriers associated with simultaneously complying with multiple schemes( Reference Rayner, Scarborough and Kaur 18 , Reference Sacks, Rayner and Stockley 19 ). Although there may be a rationale for distinct standards in some contexts, it is not clear that multiple nutrient profiling systems are merited within a national context, given the potential for negative outcomes.
It is therefore important to examine the practical policy outcomes that might arise from the application of multiple nutrient profiling systems within a single nation to inform selection and implementation of the most appropriate models. Brinsden and Lobstein( Reference Brinsden and Lobstein 21 ), along with Scarborough et al.( Reference Scarborough, Payne and Agu 22 ), examined the policy outcomes of applying different international nutrient profile models for the regulation of broadcast food marketing to children. Both concluded that agreement among international systems was low and suggested that the foods permitted to be advertised to children would differ markedly under the various systems( Reference Brinsden and Lobstein 21 , Reference Scarborough, Payne and Agu 22 ). Whether these findings also apply in a national context is unclear, as differences in the definition of a ‘healthy food’ are likely to be greater between than within nations, although we found no studies that have considered this specifically.
The purpose of the present study was therefore to assess agreement among three nutrient profiling systems used to evaluate the healthfulness of vending machine items in RSS in three Canadian provinces. Agreement among the systems was intended to illustrate practical policy outcomes of applying distinct schemes within a national context; that is, whether RSS in different Canadian provinces that are adhering to nutrition guidelines based on these systems would allow similar items to be sold within their vending machines. As a secondary outcome we investigated the efficacy of the nutrition guidelines underpinned by nutrient profiling systems, by assessing whether the nutritional profile of vending machine items in RSS that were adhering to nutrition guidelines (implementers) was superior to that of facilities that were not (non-implementers).
Methods
Selection of nutrient profiling systems
The voluntary, government-issued nutrition standards for foods/beverages offered in RSS and/or schools in the Canadian provinces of British Columbia (BC)( 23 ), Alberta (AB)( 24 ) and Nova Scotia (NS)( 25 ) were selected for the analysis. These particular provincial profiling systems were selected because, to the authors’ knowledge, they were the only ones that were actively being applied, or in the case of NS being considered, to improve food environments in Canadian RSS at the time of the study. Characteristics of these nutrient profiling systems are summarized in Table 1.
Summary of criteria for three provincial nutrient profiling schemes

TFA, trans-fatty acids; %DV, percentage of Daily Value.
✓ denotes nutrients addressed by the profiling scheme.
✗ denotes nutrients not addressed by the profiling scheme.
Nutrient data collection
To compare nutrient profiling systems, a set of products had to be compiled for the analysis. Had our purpose been to assess simple agreement among systems, then we could have rated foods within an existing database. However, given that our intent was to assess actual policy outcomes of applying the systems within RSS, we audited a sample of RSS in each province and used each of the systems to evaluate the healthfulness of the items that were present within them. Children’s food exposure within Canadian RSS predominantly comes from vending machines, as concessions and cafeterias are fewer in number and have limited hours of operation, making vending machines the more relevant unit of analysis from a public health perspective. Eighteen RSS with multiple food/beverage vending machines within BC, AB and NS were therefore identified to provide a data set of items for assessment. Facilities were purposefully selected for inclusion on the basis of their location (proximity to urban centres) and/or efforts to offer healthier vending products. Recreation and sport facilities that had taken some steps to implement nutrition guidelines within their vending machines were categorized as ‘implementers’ (n 3 per province), whereas those that were not were labelled as ‘non-implementers’ (n 3 per province). This initial assessment was based on the investigators’ direct knowledge of the facilities from past investigations and was verified through objective analysis of vending machine contents. Balanced representation from both types of facilities was sought in an effort to maximize variation in the range of products assessed (i.e. machines within which nutrition guidelines were being implemented were expected to contain different items from those in which they were not) and to provide an indication as to whether adherence to nutrition guidelines improved the nutritional quality of vending machine items. Importantly, implementation of nutrition guidelines was in its infancy in AB and NS at the time the study was conducted, and although BC had a longer history of implementation of its nutrition guidelines, attention to implementation was reportedly faltering in some facilities due to reduction in provincial-level supports (based on personal communication from several facility managers). Thus, implementers represent facilities that had taken some steps towards implementing nutrition guidelines and not necessarily facilities that were fully adhering to them.
Within each facility, one beverage vending machine (n 18) and one food vending machine (n 18) were purposefully selected for auditing based on maximizing variation in the range of products assessed. Each row was counted as a distinct item. Items that were repeated within or across machines were retained for the analysis to ensure the data represented the food environment as experienced by children, as purchase of items featured more prominently within a vending machine is assumed to be higher. The following details were collected on-site for each item within audited machines: product location in vending machine, brand, flavour, and package size. Nutrition information for each vending product was obtained from package labels or manufacturers’ websites. Machines that contained exclusively water, milk or hot beverages were not audited. Chewing gum and mints were excluded from the analysis of snack machines. Data were collected between April and July, 2013.
Data analysis
Two individuals rated food/beverage items within audited vending machines according to the BC, AB and NS nutrition standards. A third individual (D.L.O.) re-rated items where there was disagreement in the way items were rated. Items were classified by applying the methods typical for each scheme. BC’s Brand Name Food List( 26 ), an online tool providing ratings for common vending machine items, was used to classify items using BC standards where possible. Assignment of snack items to categories was unproblematic in most instances; however, classification of beverages was more challenging because the AB and NS beverage standards were somewhat ambiguous. For instance, the AB scheme recommends to avoid beverages such as soft drinks, iced tea, sports drinks, etc., without explicitly labelling them as ‘least healthy’ items, while NS considers 100 % fruit juice to be a ‘most healthy’ item, although juice does not meet this category’s fibre standards. In the former instance we placed soft drinks, iced tea, sports drinks, etc. within AB’s least healthy category, while in the latter case we placed 100 % fruit juice within NS’s most healthy category.
The total number of products classified within the most, moderately and least healthy categories for each province was expressed as a percentage of the total number of items available for sale within each vending machine. The nutrients present within each vending product were also summed and divided by the total number of items available within each machine to calculate the average nutrient content for a typical snack or beverage item in each machine.
Statistical analyses
Agreement among the three profiling systems was assessed in the statistical software package SPSS version 15 using a weighted Cohen’s κ statistic, with agreement assessed follows: κ w=0·21–0·40 as ‘fair’; κ w=0·41–0·60 as ‘moderate’; and κ w=0·61–0·80 as ‘good’( Reference Scarborough, Payne and Agu 22 , Reference Altman 27 ). Agreement was indicated if all systems placed foods in their respective categories for most healthy (i.e. choose most in BC, choose most often in AB, maximum in NS), moderately healthy (i.e. choose sometimes in BC and AB, moderate in NS) and least healthy (i.e. choose least and not recommended in BC, choose least often in AB, minimum in NS).
ANOVA using the GLM procedure in the statistical software package SAS version 9·3 was used to assess differences in the nutritional profile of beverage and snack vending machine items within each province’s most, moderately and least healthy categories. Values for the following nutrients were considered: energy (kJ), fat (g), saturated fat (g), trans fat (g), carbohydrate (g), sugars (g), fibre (g), protein (g) and sodium (mg). A separate model was fitted to determine whether the average nutritional profile of beverage and snack vending machine items differed according to the province (BC, AB, NS) and guideline implementation status (i.e. implementers v. non-implementers of nutrition guidelines) of the facility in which vending machines were present.
Whereas most facilities placed dairy and soya-based beverages in dedicated machines, two facilities included dairy and soya-based beverages within their regular beverage vending machines. These dairy and soya-based beverages were excluded (n 22) for the purposes of calculating the average nutritional profile of vending machine items within each province to ensure that cross-provincial comparisons were made on the basis of similar item types. The χ 2 test using the catmod procedure in SAS examined whether the proportion of items falling within the most and least healthy categories of each province’s rating system differed for implementers and non-implementers, and whether the three schemes assigned a similar proportion of items to their respective most and least healthy categories. P<0·05 indicated statistical significance.
Ethics
Ethical approval for the study was not required as all data were publicly available and human subjects were not involved.
Results
A total of 1159 product rows (i.e. each row consists of vending machine items of the same type placed one behind the other) were available within the thirty-six vending machines assessed. Seven rows were empty (i.e. product rows with no items) and nutrition information could not be obtained for three items, yielding a final sample of 1149 items (298 unique products, defined as items that differed in brand name, type of item (e.g. potato chips v. chocolate bars), flavour, nutrient content (e.g. low fat v. regular) and/or package size), including 531 snack items and 618 beverages. Table 2 summarizes the types of snack and beverage items that were present in vending machines.
Types of items present in vending machines. Snacks (n 531) and beverages (n 618) within vending machines in eighteen recreation and sport facilities in three Canadian provinces were audited between April and July, 2013; half of the facilities were implementing nutrition guidelines
Items were grouped by type according to commonly recognized product categories and/or major ingredients.
Product ratings
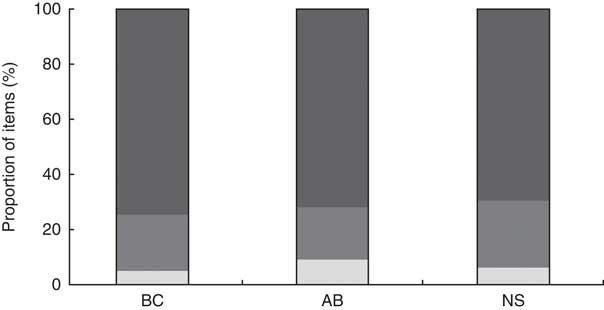
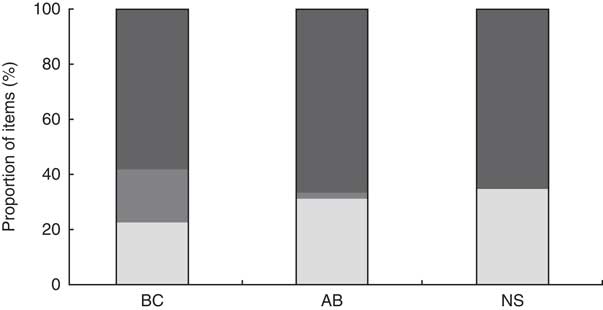
Overall, the systems agreed that the majority of items belonged within the respective provincial least healthy categories (range: 66–69 %) and that a much lower proportion of items belonged within the most healthy categories (range: 14–22 %; Table 3), although the wider range of items in the most healthy categories suggests lower agreement on this measure. Figures 1 and 2 compare the three profiling systems’ ratings of items from snack and beverage vending machines. The BC scheme placed fewer snacks and beverages in its most healthy category compared with the other two schemes. Overall, the proportion of beverages rated as most healthy exceeded the proportion of snacks rated as most healthy according to all three profiling systems (P<0·001).
Classification of items in snack vending machines by three provincial nutrient profiling systems (BC, British Columbia; AB, Alberta; NS, Nova Scotia) according to healthfulness (![]() , most healthy;
, most healthy; ![]() , moderately healthy;
, moderately healthy; ![]() , least healthy). Snacks (n 531) within vending machines in eighteen recreation and sport facilities in the three Canadian provinces were audited between April and July, 2013; half of the facilities were implementing nutrition guidelines
, least healthy). Snacks (n 531) within vending machines in eighteen recreation and sport facilities in the three Canadian provinces were audited between April and July, 2013; half of the facilities were implementing nutrition guidelines
Classification of items in beverage vending machines by three provincial nutrient profiling systems (BC, British Columbia; AB, Alberta; NS, Nova Scotia) according to healthfulness (![]() , most healthy;
, most healthy; ![]() , moderately healthy;
, moderately healthy; ![]() , least healthy). Beverages (n 618) within vending machines in eighteen recreation and sport facilities in the three Canadian provinces were audited between April and July, 2013; half of the facilities were implementing nutrition guidelines
, least healthy). Beverages (n 618) within vending machines in eighteen recreation and sport facilities in the three Canadian provinces were audited between April and July, 2013; half of the facilities were implementing nutrition guidelines
Proportion of items falling into each system’s most and least healthy categories according to guideline implementation status and provincial rating system. Snacks (n 531) and beverages (n 618) within vending machines in eighteen recreation and sport facilities in the three Canadian provinces were audited between April and July, 2013; half of the facilities were implementing nutrition guidelines

BC, British Columbia; AB, Alberta; NS, Nova Scotia.
a P <0·05 compared with non-implementers.
Agreement among nutrient profiling systems
Overall agreement among rating systems was moderate to good, with κ w values ranging from 0·49 to 0·69 (Table 4). Agreement among beverage ratings in the AB and BC schemes was 0·59; however, agreement with the NS scheme could not be computed due to zero frequency of moderately healthy beverages in NS. Agreement among snacks ranged from 0·32 to 0·50 (Table 4). The highest overall pairwise agreement was between the NS and AB schemes, while for snacks, the BC and NS schemes agreed most closely.
Pairwise weighted Cohen’s κ statistics and percentage agreement for snack and beverage vending machine items by provincial rating system. Snacks (n 531) and beverages (n 618) within vending machines in eighteen recreation and sport facilities in the three Canadian provinces were audited between April and July, 2013; half of the facilities were implementing nutrition guidelines

BC, British Columbia; AB, Alberta; NS, Nova Scotia.
–, Values of κ w and percentage agreement could not be computed due to zero frequency of moderately rated beverages in NS.
Of the 298 unique products assessed, 64 % were rated the same using all three systems, including 63 % of beverages and 65 % of snacks. As a further test of the practical implications of applying these nutrient profiling systems, we examined differences in the proportion of items falling within the most and least healthy categories of each rating system according to guideline implementation status. Policy makers may, for instance, want to know whether implementers of nutrition guidelines offer more healthy items in their vending machines compared with non-implementers. According to all three systems, implementers and non-implementers offered similar proportions of the most healthy items in their vending machines, whereas non-implementing facilities offered proportionately more of the least healthy items in their machines (Table 3; P<0·05).
Nutritional profile of items rated as more or less healthy within each system
The average nutritional profile of items within the most, moderately and least healthy categories of each profiling system is shown in Tables 5 and 6. In general, the systems distinguished between the most nutrient-rich and energy-dense items. BC standards appeared to be the most stringent for beverages, placing only beverages with few to no kilojoules in its most healthy category. The nutritional profile of items in AB’s moderately healthy beverage category appeared worse than the profile of items in the least healthy category for some nutrients (i.e. energy, fat, carbohydrate, sugars), as the former category included juices and flavoured milk with added sugar. By contrast, there were no beverages in NS’s moderately healthy category. For snacks, the NS scheme appeared to be the most nutritionally stringent when the energy and fat content of the most healthy items was examined, whereas the sodium and sugar content of items in this category were lowest in the AB and BC schemes, respectively.
Nutritional profile of items rated as more or less healthy in snack vending machines. Snacks (n 531) within vending machines in eighteen recreation and sport facilities in the three Canadian provinces were audited between April and July, 2013; half of the facilities were implementing nutrition guidelines

BC, British Columbia; AB, Alberta; NS, Nova Scotia; TFA, trans-fatty acids; CHO, carbohydrate.
P values are for main effects from ANOVA.
Nutritional profile of items rated as more or less healthy in beverage vending machines. Beverages (n 618) within vending machines in eighteen recreation and sport facilities in the three Canadian provinces were audited between April and July, 2013; half of the facilities were implementing nutrition guidelines

BC, British Columbia; AB, Alberta; NS, Nova Scotia; TFA, trans-fatty acids; CHO, carbohydrate.
P values are for main effects from ANOVA.
* No beverages were rated as moderately healthy in NS.
Nutritional profile of vending machine items according to guideline implementation status and province
The average nutritional profile of items within snack and beverage vending machines (excluding dairy and soya-based beverages) according to guideline implementation status and province in which the machines were located is presented in Tables 7 and 8. For beverages, there was a significant main effect of province (energy, sodium, carbohydrate, sugars) and implementation status (energy, sodium, carbohydrate, protein, sugars) as well as a significant interaction between province and implementation status for several nutrients (energy, carbohydrate, sugars, protein; P<0·05). For snacks, there was a significant main effect of province (energy, saturated fat, carbohydrate, fibre, sugars) and implementation status (energy, fat, carbohydrate, fibre, sugars) as well as a significant interaction between province and implementation status for several nutrients (energy, saturated fat, protein; P<0·05). The interaction between province and implementation status approached significance for sodium (P=0·06) and fibre (P=0·09).
Average nutritional profile of snacks in vending machines according to guideline implementation status and province. Snacks (n 531) within vending machines in eighteen recreation and sport facilities in the three Canadian provinces were audited between April and July, 2013; half of the facilities were implementing nutrition guidelines

BC, British Columbia; AB, Alberta; NS, Nova Scotia; TFA, trans-fatty acids; CHO, carbohydrate.
Values represent means with their standard errors unless otherwise indicated.
a P<0·05 compared with the non-implementer mean.
b P<0·05 compared with AB implementers.
c P<0·05 compared with NS implementers.
d P<0·05 compared with BC non-implementers.
e P<0·05 compared with AB non-implementers.
f P<0·05 compared with NS non-implementers.
g P<0·05 compared with BC implementers.
Average nutritional profile of beverages in vending machines according to guideline implementation status and province, excluding dairy and soya-based beverages. Beverages (n 618) within vending machines in eighteen recreation and sport facilities in the three Canadian provinces were audited between April and July, 2013; half of the facilities were implementing nutrition guidelines

BC, British Columbia; AB, Alberta; NS, Nova Scotia; TFA, trans-fatty acids; CHO, carbohydrate.
Values represent means with their standard errors unless otherwise indicated.
a P<0·05 compared with the non-implementer mean.
b P<0·05 compared with AB non-implementers.
c P<0·05 compared with NS implementers.
d P<0·05 compared with NS non-implementers.
e P<0·05 compared with BC implementers.
f P<0·05 compared with AB implementers.
g P<0·05 compared with BC non-implementers.
Discussion
Overall findings
Selection and operationalization of appropriate nutrient profiling systems is a key task in efforts to improve children’s food environments. Nutrient profiling systems provide a basis to determine the foods to which children will have access and thus their standards may impact children’s dietary intake, body weight and health outcomes. The present study compared the practical policy implications of applying three nutrient profiling systems to determine products suitable for sale in RSS in three Canadian provinces. Findings showed moderate to good agreement among the systems studied. The systems rated foods/beverages within vending machines in a similar manner, with greatest agreement for the proportion of items that were least healthy. The schemes also agreed that facilities that were and were not implementing nutrition guidelines offered similar proportions of the most healthy items, but that implementers offered proportionately fewer unhealthy items. Taken together, these findings suggest that it may be more efficient to develop a single nutrient profiling system in a national context, as the practical policy outcomes of multiple schemes may be similar. Our findings suggest that organizations within the recreation and sports sector in the Canadian provinces of BC, AB and NS that adhere to their respective provincial nutrition standards will allow similar foods/beverages to be sold within their vending machines.
Differences among nutrient profiling schemes
Although many final food rankings were similar, differences among the schemes were nevertheless evident and there was not agreement on the ratings for all products. Comparison of the average nutritional content of items within each province’s most, moderately and least healthy categories showed that, in general, all three schemes achieved their stated goal to distinguish between nutrient-rich and energy-dense foods and beverages. BC’s scheme was the most stringent on several measures, as it classified the fewest snacks and beverages within its most healthy category, and beverages within this category had few to no kilojoules. While a degree of stringency is desirable within nutrient profiling systems, there can also be a trade-off between stringency and social acceptability. Drewnowski and Fulgoni( Reference Drewnowski and Fulgoni 28 ) reported that the only foods that met the global standards of eight different profiling models were skimmed milk, apples, boiled potatoes, diet soft drinks and leaf tea. Exclusive consumption of these foods would provide a mundane and nutritionally inadequate diet( Reference Drewnowski and Fulgoni 28 ). Thus, profiling systems should not be too nutritionally stringent, and policy makers should consider the social and dietary implications if only the most healthy foods are permitted in some settings such as schools.
During profile development, scientific and practical criteria should be used to systematically consider the purpose of systems, their target population, the model type (across-the-board or category-specific), which nutrients or other food components to consider, reference amounts (per 100 g, 100 kJ/100 kcal or per serving), scoring systems (continuous or categorical) and threshold levels for nutrients( Reference Scarborough, Rayner and Stockley 29 ). The selection of reference amounts is particularly important and strongly influences final food rankings( Reference Drewnowski, Maillot and Darmon 30 ). In the current study, the use of different reference amounts was likely responsible for some of the differences observed among systems. For instance, the AB system is based on pre-specified portion sizes, whereas BC and NS consider a full product package as a reference amount. Thus, individual items always receive the same rating in AB regardless of package size, while larger packages of the same item are rated less favourably in BC and NS. The use of a full package as a serving size in NS and BC reflects consumption patterns, as consumers tend to perceive a package as a serving; however, it provides an inconsistent standard of comparison for products that are available in multiple sizes, which may be confusing to users. Other factors that may have contributed to disparities in ratings include differences in: (i) the number of food categories, with AB having the most and NS the fewest; (ii) the assignment of items to food categories, with potato chips considered grains in NS but fruits and vegetables in BC and AB; (iii) the inclusion of different nutrients and different threshold levels for those nutrients, with AB, for example, having much lower sodium standards than BC and NS; and (iv) their target populations, as the BC guidelines were developed for public buildings (including recreation and sport facilities), the AB guidelines were developed for schools, child-care and recreation and sport facilities, and the NS guidelines were originally developed for schools.
Harmonization of nutrient profiling schemes
Policy diffusion, although often beneficial, can in some instances lead to a patchwork of policies that may ultimately hamper progress towards improving food environments. This was the case with menu labelling in the USA, where a number of cities and states enacted distinct menu labelling regulations, making it difficult for industry to comply with all of them. Similarly, although we have shown that the practical policy implications of these three Canadian systems may be similar, this is not evident to industry stakeholders, who are likely to focus on the differing formats of the systems and perceive the barriers associated with reformulating foods to meet these differing nutritional standards as prohibitive. Indeed, managers from industry have previously indicated that the absence of a single, national Canadian nutrition standard was a barrier to implementing nutrition guidelines in recreation and sport facilities( Reference Olstad, Raine and McCargar 31 ). Therefore, given that the policy outcomes of applying the systems may indeed be similar, harmonization of nutrient profiling standards at a national level appears advisable to reduce unnecessary duplication, avoid contradictory approaches that confuse stakeholders and support product reformulation by industry, the importance of which should not be underestimated, given its potential to reduce population-level energy intakes with little to no effort on the part of individuals( Reference Rayner, Scarborough and Kaur 18 , Reference Sacks, Rayner and Stockley 19 ). A single national system may also have widespread application beyond RSS, such as to guide provision of foods within other settings, as a standard for menu labelling or for a national front-of-package labelling scheme, to inform regulations regarding which foods can be marketed to children, to regulate health and nutrition claims on package labels, and/or as an educational tool to help consumers identify the most nutrient-dense food options( Reference Sacks, Rayner and Stockley 19 ). As an example of a first step in this direction, passage of the Healthy, Hunger-Free Kids Act of 2010 has led to development of minimum nutrition standards for foods sold in US schools that will apply on a national basis( 32 ).
Nutritional profile of vending machine items in facilities that had implemented nutrition guidelines
The overall nutritional profile of vending machines items in facilities that were implementing nutrition guidelines was somewhat superior to the profile of items in facilities that were not implementing nutrition guidelines. Snacks in implementing facilities contained significantly less energy, fat, carbohydrates and sugars, and more fibre; and beverages contained significantly less energy, carbohydrates, sugars and sodium, and more protein, compared with snacks and beverages in vending machines located in non-implementing facilities. Although implementers did not offer more healthy products, they did offer fewer unhealthy options. Differences by province were also observed. In general, the nutritional profile of beverages in NS implementers was better, and of AB non-implementers was poorer, compared with beverages in other facilities. Snacks in AB and NS implementing facilities had better average profiles compared with most others, which were equally poor. These findings are in line with previous research highlighting the reality that meaningful change to food environments within RSS will take time; and that resources, support, willingness and/or capacity to implement nutrition guidelines are essential( Reference Naylor, Wekken and Trill 33 ), and may differ by jurisdiction.
Notably however, the majority of snack and beverage items within all vending machines, regardless of implementation status, were energy-dense, nutrient-poor options, consistent with findings from similar studies( Reference Naylor, Bridgewater and Purcell 5 , Reference Olstad, Raine and McCargar 9 , Reference Olstad, Raine and McCargar 31 , Reference Naylor, Wekken and Trill 33 ). This is concerning because the presence of unhealthy items in vending machines negatively influences the foods children purchase( Reference Wiecha, Finkelstein and Troped 16 , Reference Park, Sappenfield and Huang 34 , Reference Neumark-Sztainer, French and Hannan 35 ) and consume( Reference Wiecha, Finkelstein and Troped 16 , Reference Kubik, Lytle and Hannan 36 – Reference Minaker, Storey and Raine 38 ), and has been associated with higher BMI in children( Reference Kubik, Lytle and Hannan 36 , Reference Minaker, Storey and Raine 38 , Reference Fox, Dodd and Wilson 39 ). Thus, ongoing support for implementation of nutrition guidelines in RSS and other settings remains a high priority.
Limitations and strengths
The generalizability of these findings is unclear; however, we attempted to maximize the representativeness of the sample by assessing snack and beverage machines in three provinces in facilities that were and were not implementing nutrition guidelines. The implementers selected may not be representative of other implementers, as actions taken by individual facilities are likely to differ according to their individual priorities. There is a limited range of popular products suitable for sale within vending machines and a few large brands dominate the market. For these reasons, a larger sample is unlikely to have yielded many new products to evaluate. Vending machines were assessed because they represent the majority of children’s food exposures in RSS. Ambiguities and disagreements among profiling systems might have been more apparent had a broader variety of items from concessions been evaluated. Vending machines were assessed at a single point in time, however stocked vending items do not appear to vary substantially week to week( Reference Naylor, Wekken and Trill 33 ). These limitations are balanced by multiple strengths, including assessment of policy outcomes in a novel community setting, data collection by trained research assistants rather than relying on facilities’ own self reports, evaluation of a large number of products and data verification by multiple independent investigators to ensure accuracy.
It is also important to acknowledge the limitations of nutrient profiling itself, as it is an emerging science. No system is infallible in its categorization and all systems remain susceptible to distortion by the expertise, knowledge, personal and cultural perspectives of their creators( Reference Azais-Braesco, Goffi and Labouze 40 ). Nutrient profiling systems rate individual foods; however, dietary quality is not simply a function of the healthiness of the individual foods consumed, as even the most healthy foods should not be consumed in unlimited quantities. In addition, nutrient profiling systems rate the physical health of foods in terms of the nourishment they offer to the body, but cannot address the cultural and social value of foods, which may be equally consequential to overall health. Finally, many systems in current use have not been validated. Agreement among the systems, as assessed in the present study, does not provide an indication of their validity.
Conclusions
The high prevalence of unhealthy dietary behaviours and obesity among children has elevated the importance of distinguishing between different types of foods. Nutrient profiling systems can provide a basis to regulate food availability within food environments frequented by children and thereby help to ensure children have access to a wide variety of nutritious foods and beverages in these settings. The present study compared the policy outcomes of applying three different provincial nutrient profiling systems in RSS. Findings revealed that the practical policy outcomes of the systems are likely to be similar, suggesting there may be scope to harmonize profiling systems at a national level to avoid unnecessary duplication, reduce confusion, and facilitate and encourage food reformulation by industry. Greater support for implementation of nutrition policies underpinned by well-designed nutrient profiling systems appears necessary, however, as the majority of foods and beverages in all vending machines were unhealthy and facilities that were implementing provincial nutrition guidelines did not offer substantially healthier products compared with facilities that were not.
Acknowledgements
Acknowledgements: The authors are grateful for the excellent statistical assistance provided by Dr Laki Goonewardene and for assistance with data collection/analysis provided by the following research assistants: Crystal Narten, Shelby Cender, Nicole Giacobbo, Karina Kislitsyna, Megan Howlett, Daralynn Pilkie, Joel Johnston, Charlene Sinclair and Laura Gerein with this study. Financial support: This research received no specific grant from any funding agency, commercial or not-for-profit sectors. D.L.O. was funded by an Izaak Walton Killam Memorial Scholarship; the Alberta Centre for Child, Family and Community Research Scobey Hartley Doctoral Award; and a BMO Financial Group Graduate Scholarship. K.P. worked as a research assistant on a Heart and Stroke Foundation/Canadian Institutes of Health Research grant-in-aid project (Built Environment: Population Health Intervention Research initiative). S.F.L.K. acknowledges support from a Canadian Institutes of Health Research Canada Research Chair in Health Services Research. Resources for data analysis were made available through the Coalition for Action on Childhood Obesity which is funded by a financial contribution from Health Canada, through the Canadian Partnership Against Cancer. Conflict of interest: None. Authorship: D.L.O. designed the study, collected, analysed and interpreted the data and wrote the manuscript; K.P. designed the study, collected the data and edited the manuscript; P.-J.N. designed the study, collected and interpreted the data and edited the manuscript; C.S. analysed and interpreted the data and edited the manuscript; S.F.L.K. designed the study, interpreted the data and edited the manuscript. Ethics of human subject participation: Ethical approval was not required.


