Obesity in childhood and adolescence is a growing public health concern in many countries. It is associated with several risk factors for later type 2 diabetes, hypertension, dyslipidaemia and early atherosclerosis(Reference Must, Jacques, Dallal, Bajema and Dietz1–Reference Callahan and Mansfield5). Moreover, it may also have a negative effect on children, such as by reducing their health-related quality of life and leading to an increased occurrence of depression(Reference Williams, Wake, Hesketh, Maher and Waters6–Reference Warschburger9). The increasing prevalence of childhood obesity has therefore become a serious public health problem(10).
In 2000, the international cut-off points for overweight and obesity in children ranging in age from 2 to 18 years were defined by Cole et al., using nationally representative data form Brazil, the UK, Hong Kong, The Netherlands, Singapore and the USA(Reference Cole, Bellizzi, Flegal and Dietz11). They described the development of age- and sex-specific cut-off points for BMI defined to pass through the value of 25 kg/m2 and 30 kg/m2 at age 18 years, and they were linked to the adult cut-off points. The aim of the present study was to examine changes in the age-specific prevalence of overweight and obesity in Japanese children between 2000 and 2005. In addition, we also compared the Japanese centile curves, developed using the same method and definition of the study previously mentioned(Reference Cole, Bellizzi, Flegal and Dietz11), with the international ones.
Subjects and methods
Subjects
We obtained data on the BMI of children from the School Health Survey in 2000–2005. The survey is an annual sample survey conducted by the Ministry of Education, Culture, Sports, Science and Technology in Japan and includes 695 600 children, thus representing nearly 4 % of all kindergarten children and schoolchildren in Japan. For examining the age-specific prevalence of overweight and obesity between 2000 and 2005, we used all the data excluding abnormal values. The number of children included in the analysis was 669 986 in 2000 and 668 234 in 2005.
We randomly chose 2300 children in each sex, age and year for making our data set to develop growth charts, since sample sizes from 400 to 500 are required to attain precision of the centiles at the specific ages selected for the curve fitting(Reference Guo, Roche, Chumlea, Johnson, Kuczmarski and Curtin12). After excluding abnormal values, the number of male and female children included in the data set was respectively 29 900 and 29 895 in 2000, 29 887 and 29 890 in 2001, 29 882 and 29 889 in 2002, 29 887 and 29 900 in 2003, 29 886 and 29 893 in 2004 and 29 886 and 29 886 in 2005, ranging in age from 5 to 17 years.
Data analysis
For examining the age-specific prevalence of overweight and obesity between 2000 and 2005, we adopted the definitions of overweight and obesity of the International Obesity Taskforce (IOTF) and the Centers for Disease Control and Prevention (CDC)(13, Reference Kuczmarski, Ogden, Guo, Grummer-Strawn, Flegal, Mei, Wei, Curtin, Roche and Johnson14). The first was based on the charts developed in Cole et al.’s study(Reference Cole, Bellizzi, Flegal and Dietz11). The second definition was based on CDC growth charts and defined overweight as a BMI-for-age between the 85th and 95th percentile and obesity as a BMI-for-age at or above the 95th percentile. A logistic multivariate regression model was fitted in order to compare the prevalence of overweight and obesity with adjustment for age.
Smoothed centile curves for BMI were constructed by sex using the LMS (least mean squares) method(Reference Cole, Freeman and Preece15). To determine the cut-off points for overweight and obesity of Japanese children, we used the method and definition proposed by Cole et al.(Reference Cole, Bellizzi, Flegal and Dietz11). They defined the cut-off points to pass through BMI of 25 kg/m2 and 30 kg/m2 at age 18 years in their study. Since the maximum age in our subjects was 17 years, instead of 25 and 30 kg/m2 at age 18, we therefore determined the BMI values at age 17 in our study. These values were 24·46 and 24·70 kg/m2 instead of 25 kg/m2, and 29·41 and 29·69 kg/m2 instead of 30 kg/m2, for males and females, respectively. BMI centiles were constructed using lmsChartMaker Pro (The Institute of Child Health, London, UK).
Results
Figure 1 shows the Japanese centile curves for BMI for males and females in 2000 (solid line) and 2005 (dashed line). A large change in shape is seen between the 97th percentile curves for males. We did not insert the centile curves of 2001, 2002, 2003 and 2004 in Fig. 1 for clarity, but the shapes of the centile curves changed progressively from 2000 to 2005. Most of the curves in 2005 were above those in 2000 after age 14 years for males and 13 years for females. At age 17 years, the BMI for each centile curve was higher in 2005 than in 2000 for both sexes.
Japanese centile curves for BMI for males (a) and females (b) in 2000 (——) and 2005 (- - - -); data from the School Health Survey in 2000 and 2005, a large, representative cross-sectional growth study

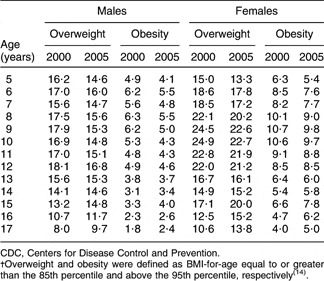
Tables 1 and 2 show the prevalence of overweight and obesity in males and females specified according to the 85th and 95th percentile from CDC and in relation to the IOTF definition in 2000 and 2005, respectively. Using the IOTF definition, in males, overweight prevalence in the different age groups varied from 9·7 % to 18·3 % in 2000 and from 10·4 % to 16·8 % in 2005, whereas obesity prevalence ranged from 1·8 % to 4·5 % in 2000 and from 2·0 % to 3·6 % in 2005. In females, overweight prevalence in the different age groups varied from 9·1 % to 21·7 % in 2000 and from 8·1 % to 21·0 % in 2005, whereas obesity prevalence ranged from 2·6 % to 6·1 % in 2000 and 2·3 % to 5·4 % in 2005. Using the CDC percentiles, in males, overweight prevalence in the different age groups varied from 8·0 % to 18·1 % in 2000 and from 9·7 % to 16·8 % in 2005, whereas obesity prevalence ranged from 1·8 % to 6·3 % in 2000 and from 2·4 % to 5·5 % in 2005. In females, overweight prevalence in the different age groups varied from 10·6 % to 24·9 % in 2000 and from 13·3 % to 22·7 % in 2005, whereas obesity prevalence ranged from 4·0 % to 10·7 % in 2000 and from 5·0 % to 9·8 % in 2005. In Tables 1 and 2, the percentages of overweight and obesity in 2000 were greater than those in 2005 below 13 years of age and lower over 14 years of age.
Prevalence (%) of overweight and obesity in Japanese children and adolescents in 2000 and 2005 according to the IOTF definitionFootnote †; data from the School Health Survey in 2000 and 2005, a large, representative cross-sectional growth study

IOTF, International Obesity Taskforce.
† Overweight and obesity were defined as BMI-for-age equal to or greater than the value plotted on the centile curves which crossed a BMI of 25 kg/m2 and 30 kg/m2 respectively at age 18 years, based on the data table developed by Cole et al.Reference Cole, Bellizzi, Flegal and Dietz(11).
Prevalence (%) of overweight and obesity in Japanese children and adolescents in 2000 and 2005 according to the CDC definitionFootnote †; data from the School Health Survey in 2000 and 2005, a large, representative cross-sectional growth study

CDC, Centers for Disease Control and Prevention.
† Overweight and obesity were defined as BMI-for-age equal to or greater than the 85th percentile and above the 95th percentile, respectivelyReference Kuczmarski, Ogden, Guo, Grummer-Strawn, Flegal, Mei, Wei, Curtin, Roche and Johnson(14).
Table 3 shows age-adjusted odds ratios for percentages of overweight and obesity according to the CDC and IOTF definitions, comparing 2005 with 2000. For the overall group 5–17 years of age, according to the CDC definition, odds ratios were significantly smaller than 1·00 in both males and females, whereas according to the IOTF definition, odds ratios were significantly smaller than 1·00 in only females. Since the percentages of overweight and obesity in 2000 were greater than those in 2005 below 13 years of age and then reversed at 14 years of age and over in Tables 1 and 2, we examined the odds ratios in the age groups of 5–13 years and 14-17 years separately. Odds ratios were significantly smaller than 1·00 at 5–13 years of age, whereas they were significantly greater than 1·00 at 14–17 years of age, in both males and females, according to both definitions (all P < 0·05).
Age-adjusted odds ratios for percentages of overweight and obesity in Japanese children and adolescents, comparing 2005 with 2000; data from the School Health Survey in 2000 and 2005, a large, representative cross-sectional growth study

CDC, Centers for Disease Control and Prevention; IOTF, International Obesity Taskforce.
*P < 0·05.
†Overweight and obesity were defined as BMI-for-age equal to or greater than the 85th percentile and above the 95th percentile, respectivelyReference Kuczmarski, Ogden, Guo, Grummer-Strawn, Flegal, Mei, Wei, Curtin, Roche and Johnson(14).
‡Overweight and obesity were defined as BMI-for-age equal to or greater than the value plotted on the centile curves which crossed a BMI of 25 kg/m2 and 30 kg/m2 respectively at age 18 years, based on the data table developed by Cole et al.Reference Cole, Bellizzi, Flegal and Dietz(11).
Table 4 gives the centiles for overweight corresponding to a BMI of 24·46 kg/m2 for males and 24·70 kg/m2 for females at age 17 for each year. The centiles decreased from 2000 to 2005 in both sexes; i.e. the percentages above the cut-off points increased. In males, the percentage above the cut-off point in 2005 of 18·33 % is 1·30 times higher than that in 2000, 14·10 %; in females, the percentage of 13·09 % above the cut-off point in 2005 is 1·16 times higher than that in 2000, 11·24 %. Table 4 also gives the centiles for obesity corresponding to a BMI of 29·41 kg/m2 for males and 29·69 kg/m2 for females at age 17 for each year. The same decrease as that found for overweight was observed. In males, the percentage above the cut-off point of 3·45 % in 2005 is 1·42 times higher than that of 2·43 % in 2000; and 1·87 % in 2005 is 1·40 times higher than 1·34 % in 2000 in females.
Centiles and Z scores for overweight, corresponding to BMI of 24·46 kg/m2 for males and 24·70 kg/m2 for females at age 17 years, and obesity, corresponding to BMI of 29·41 kg/m2 for males and 29·69 kg/m2 for females at age 17 years, in Japan, derived from fitted LMS curves; data from the School Health Survey 2000–2005, a large, representative cross-sectional growth study

LMS, least mean squares.
Discussion
We examined changes in the age-specific prevalence of overweight and obesity in Japanese children between 2000 and 2005. In Japan, we have our own definitions of overweight and obesity for clinical purposes and they are quite age-specific. We used the IOTF definition and the CDC definition since we examined the prevalence from 5 to 17 years continuously. In our study, the percentages of overweight and obesity decreased from 2000 to 2005. The age-specific prevalences of overweight and obesity in the present study were different from the results of Mexican children(Reference del Rio-Navarro, Velazquez-Monroy and Sanchez-Castillo16). It is suggested that the timing and stage of puberty might influence the prevalence of overweight and obesity.
We developed Japanese centile curves for BMI by sex using the LMS method and then estimated the BMI cut-off points for overweight and obesity in Japanese children aged 5 to 17 years, for each year between 2000 and 2005. The present study basically followed the previous study of Cole et al.(Reference Cole, Bellizzi, Flegal and Dietz11) and we compared the Japanese results with its results. We also examined the change in the Japanese cut-off points from 2000 to 2005.
As seen in Table 4, the centiles for overweight and obesity corresponding to the BMI decreased year by year in both sexes. Regarding the centile for overweight for males, it fell from 85·90 in 2000 to 81·67 in 2005, whereas it ranged from 81·9 in the USA to 95·3 in Brazil in Cole et al.’s study in which the data were obtained in the 1980s(Reference Cole, Bellizzi, Flegal and Dietz11). The Japanese centile for overweight in males appears to gradually be approaching that of the USA from 2000 to 2005. The centile for obesity for males also showed the same approach, decreasing from 97·57 in 2000 to 96·55 in 2005, whereas it ranged from 96·7 in the USA to 99·9 in Brazil in the previous study of Cole et al.(Reference Cole, Bellizzi, Flegal and Dietz11). Regarding the centiles for females, decreases were observed between 2000 and 2005 but they were not larger than those for males.
We compare the shape of the centile curves for BMI between 2000 and 2005 in Fig. 1. Most of the curves in 2000 were above those in 2005 before age 14 years for males and 13 years for females; after thereafter the curves in 2005 exceeded those in 2000. The cohort effect may be one possible explanation. The high prevalence among children aged 8 or 9 years in 2000 became the high prevalence among the children aged 13 or 14 years in 2005. According to the School Health Survey, among children aged 5–17 years, no large increase of average height was found for each age and both males and females between 2000 and 2005, but average weight increased among male children aged 15–17 years by 1 kg, slightly less among female children aged 17 years by 0·6 kg. Moreover, a decrease in average weight was seen among children aged 5–13 years, both male and female, by a few hundred grams. Therefore it can be said that overweight/obesity was increasing among older children and it was decreasing among younger children during the period.
For reference purposes, the percentage of adults aged 20–29 years with BMI ≥ 25 kg/m2 was 18·6 % in 2000 and 19·9 % in 2004 for males, and 6·9 % in 2000 and 5·4 % in 2004 for females in Japan. The prevalence of BMI ≥ 25 kg/m2 was found to increase for males and to decrease for females in Japanese adults aged 20–29 years according to the National Nutrition Survey by the Ministry of Health, Labour and Welfare, Japan(17, 18).
In 2000, the IOTF proposed new BMI cut-off points for assessing underweight, overweight and obesity for Asian adults in the Asian and Pacific region. These cut-off points are 18·5 kg/m2 for underweight, 23·0 kg/m2 for overweight and 25·0 kg/m2 for obesity, which are lower than those in Western populations(10). However, we applied the same cut-off points of 25 kg/m2 and 30 kg/m2 as done in the previous study by Cole et al.(Reference Cole, Bellizzi, Flegal and Dietz11) to make a comparison of the Japanese centile curves with the curves in their study. In future studies with the objective of developing cut-off points for overweight and obesity, new regional cut-off points may be worth using. Regarding the centile curves, the Japanese centile curves were found to approach the international reference curves in the present study; however, the curves of developing countries may still deviate from the reference curves.
Our study has several limitations that must be addressed. First, we could not exactly apply the cut-off points of BMI of 25 kg/m2 and 30 kg/m2 at 18 years of age because the data were obtained from a School Health Survey which did not collect data from children aged 18. Second, owing to the same reason that the School Health Survey did not collect data on the birth month and day, we could not include them in our analysis. However, the sample size of each data set by sex and year may be sufficient to ignore these drawbacks. We did not analyse all 695 600 samples for each year due to technical and software limitations.
Conclusion
The results of the present study indicate that centile curves can change according to the time of observation, thus suggesting that international reference curves therefore need to be regularly revised while also including more data from a larger range of countries.
Acknowledgements
There are no conflicts of interest. N.S. collected the data and L.Y. analysed them. The study was supported by a Grant-in-Aid for Young Scientists from the Ministry of Education, Culture, Sports, Science and Technology, Japan.