

Malnutrition in the form of unintentional weight loss of more than 10 % of body weight is common among acutely and chronically ill medical patients in hospitals( Reference Gilmore, Robinson and Posthauer 1 , Reference McWhirter and Pennington 2 ). The presence of malnutrition adversely affects clinical outcomes and indicates a need to target this population( Reference Charlton, Nichols and Bowden 3 ).
Many factors alter nutritional status( Reference Addolorato, Capristo and Greco 4 ); therefore, it is difficult to estimate the optimal approach to nutritional assessment. However, serum albumin level can be influenced by body fluid distribution, post-operative state and renal and hepatic function( Reference Numeroso, Barilli and Delsignore 5 ). BMI, a simple anthropometric measure, is the most frequently used parameter of nutritional status and is associated with all-cause mortality risk in older people, mostly driven by an increased risk of cardiovascular mortality( Reference de Hollander, Van Zutphen and Bogers 6 ).
On the other hand, Detsky et al.( Reference Detsky, Mc Langblin and Baber 7 ) introduced the Subjective Global Assessment (SGA), which provides an integration of historical (weight loss, dietary intake) and physical (loss of subcutaneous muscle mass or fat mass) data. The application of SGA in nutritional risk screening enhances the ability to predict poor clinical outcomes( Reference Raslan, Gonzalez and Torrinhas 8 ). Thus far, SGA as a malnutrition screening tool has been a good predictor of health-related quality of life in chronic kidney disease as well( Reference Vero, Byham-Gray and Parrott 9 ). BMI and SGA have been used in many studies as predictors of malnutrition prevalence, clinical outcomes and mortality in different periods of follow-up( Reference Raslan, Gonzalez and Torrinhas 8 , Reference Veronese, De Rui and Toffanello 10 ).
Data from European countries on the prevalence of malnutrition in different clinical settings( Reference Pirlich, Schutz and Norman 11 – Reference Vanderwee, Clays and Bocquaert 13 ) are well known; however, general data about the prevalence of malnutrition in Slovak hospitals are uncommon. Thus, we aimed to explore the prevalence of malnutrition in medical (non-surgical) patients admitted to hospital due to acute or chronic illness, using both SGA and BMI as routine screening tools. In addition, we aimed to evaluate the correlation between serum albumin levels and both SGA and BMI as assessment tools of malnutrition. We investigated co-morbid diseases as an important factor of clinical outcome and the impact of nutritional status on the 10-year survival of these patients.
Participants and methods
This was a prospective observational cohort study. All patients hospitalized at the Internal Clinic of the Nitra Teaching Hospital from April 2003 until June 2003 were consecutively included (243 patients). Out of these patients, twenty-two did not agree to participate or could not provide informed consent and nineteen were excluded due to multi-organ failure, resulting in 202 patients included in the study.
Patient nutritional status at admission (up to 12 h) was evaluated by a trained physician using the SGA protocol. SGA is an appropriate tool for assessing malnutrition( Reference Raslan, Gonzalez and Torrinhas 8 , Reference Pirlich, Schutz and Norman 11 ). With regard to SGA we classified patients into two groups: (i) normal nutrition (good nutritional status), SGA classification A; and (ii) malnutrition (moderate or severe), SGA classification B and C.
Body weight and height were measured by an electronic scale with a separate stadiometer. BMI was calculated for every patient (weight and height in the patient’s admission protocol sheet) within the first 12 h of the hospital stay. BMI evaluation was based on the WHO 1998 criteria with the following cut-off points: obesity, BMI≥30·0 kg/m2; overweight, BMI=25·0–29·9 kg/m2; normal weight, BMI 18·5–24·9 kg/m2; and underweight, BMI<18·5 kg/m2 ( 14 ). Nevertheless, the use of BMI to assess nutritional status in elderly patients over 65 years old is widely debated due to body composition alterations( Reference Garrow 15 ).
Blood samples were drawn from the venous line for determination of serum albumin level. Albumin was assessed by colorimetric assay with the bromocresol green method in a local laboratory as a standard part of diagnostic procedures, with references values between 39 and 42 g/l.
Co-morbidity data were extracted from medical and nursing investigation records. The following diseases were recorded: CVD (angina pectoris, myocardial infarction, positive coronarography, congestive heart disease (New York Heart Association Functional Classification, class III and IV), history of stroke); respiratory diseases (bronchial asthma, chronic obstructive pulmonary disorder (Global initiative for chronic Obstructive Lung Disease, since stage III), restrictive pulmonary disorders); neurological diseases (multiple sclerosis, myasthenia gravis, stroke within 3 months, polyradiculoneuritis, dementia); endocrine diseases (thyroid disorders, diabetes mellitus); nephrologic diseases (chronic kidney disease); liver diseases (cirrhosis scoring, Child/Pugh since B/B); gastrointestinal diseases (inflammatory bowel disease based on histology, acute and chronic pancreatitis, coeliac disease); systemic diseases (systemic collagen and vascular diseases such as vasculitis, rheumatoid arthritis); oncologic diseases (active disease with ongoing treatment by chemotherapy or radiotherapy, except skin malignancies); and others (intoxication, psychotic disorders).
Information about patient survival was collected from the registry of the Healthcare Surveillance Authority until June 2012. The local ethics committee of the Nitra Teaching Hospital in Slovakia agreed the research proposal.
Statistics
Descriptive statistics (frequencies, medians and interquartile ranges (IQR)) were used for the sample description. Associations between SGA and the categorical variables were evaluated using the χ 2 test; between SGA and continuous variables using the Mann–Whitney U test. Cox regression was used to explore the association between mortality and a model made up of the following variables: age, gender, BMI, albumin serum level and SGA evaluation. In the second model co-morbidity was also added (only variables significant in bivariate analysis). Kaplan–Meier curves were plotted for survival of patients with normal nutrition and malnutrition. The statistical software package IBM SPSS Statistics version 20 was used for statistical analyses.
Results
No significant differences were found between participants and non-participants regarding age and gender. The median age of patients was 63·5 (IQR 51·0–74·0) years; 112 of them were males (55·4 %); median BMI was 25·9 (IQR 22·1–29·0) kg/m2; and median serum albumin level was 39·0 (IQR 34·3–43·0) g/). Based on SGA evaluation, sixty-eight patients were malnourished (SGA classification B) and nine patients were severely malnourished (SGA classification C); due to the small number in the SGA C group we merged these two categories. Detailed information on the sample divided into normal nutrition (SGA classification A) and malnutrition (SGA classification B and C) is given in Table 1; the major reasons for hospitalization are described in Table 2.
Baseline characteristics according to nutritional status among hospitalized non-surgical patients (n 202; median age 63·5 years) admitted to Nitra Teaching Hospital, Slovak Republic, April–June 2003

Normal nutrition, SGA classification A; malnutrition, SGA classification B and C; IQR, interquartile range; SGA, Subjective Global Assessment.
*Significant difference between SGA classification A and SGA classification B and C.
Co-morbidity according to nutritional status among hospitalized non-surgical patients (n 202; median age 63·5 years) admitted to Nitra Teaching Hospital, Slovak Republic, April–June 2003
Normal nutrition, SGA classification A; malnutrition, SGA classification B and C; SGA, Subjective Global Assessment.
*P value for the difference between SGA classification A and SGA classification B and C.
Malnutrition was more common in older patients (P=0·023), patients with lower BMI (P<0·001), with gastrointestinal co-morbidity (χ 2=10·7, P=0·001), oncologic co-morbidity (χ 2=5·35, P=0·021) and those with lower serum albumin (P=0·049).
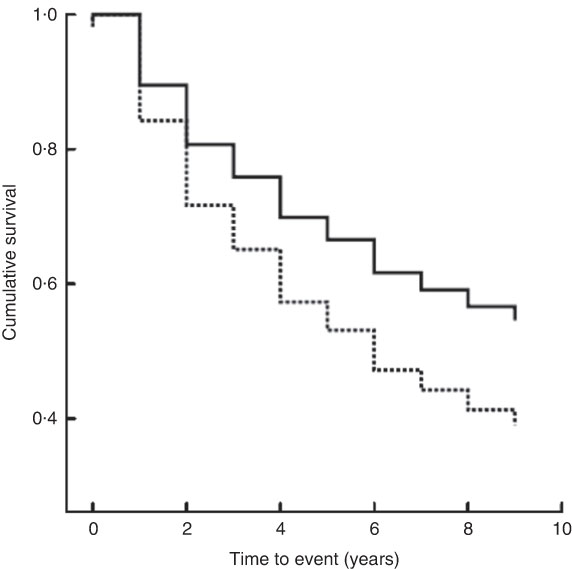
The median follow-up period was 8·5 (IQR 3–8·5) years. The median period of follow-up for patients with malnutrition was 6 (IQR 2–9) years and for patients with normal nutrition it was 9 (IQR 4–9) years. In-hospital mortality was low (six patients, 3·0 %), but during the following 10 years 105 patients died (52·0 %), forty-seven of whom were from the malnutrition group. A significantly higher proportion of patients with malnutrition died (61·0 %) compared with patients having normal nutrition (46·4 %; log-rank test χ 2=5·37, P=0·02). Cox regression analysis controlling for age, gender, BMI and serum albumin showed that SGA was an independent predictor of death (hazard ratio=1·55; 95 % CI 1·04, 2·32, P=0·031; Table 3 and Fig. 1).
Kaplan–Meier curves showing the association between nutritional status as evaluated by SGA (——, normal nutrition, SGA classification A; – – – – –, malnutrition, SGA classification B and C) and 10-year survival among hospitalized non-surgical patients (n 202; median age 63·5 years) admitted to Nitra Teaching Hospital, Slovak Republic, April–June 2003 (SGA, Subjective Global Assessment)
Results of Cox regression models of 10-year survival among hospitalized non-surgical patients (n 202; median age 63·5 years) admitted to Nitra Teaching Hospital, Slovak Republic, April–June 2003

β, beta coefficient; HR, hazard ratio; ref., referent category; malnutrition, SGA classification B and C; normal nutrition, SGA classification A; SGA, Subjective Global Assessment.
*Significant predictor.
Discussion
Our study estimated the prevalence of malnutrition as assessed by SGA at 38·1 %. However, classification of malnutrition according to BMI was not sensitive enough; only the SGA A group had the same value of interpretation, as no patient with a BMI<18·5 kg/m2 was classified as A according SGA assessment. On the other hand, only 13·0 % of malnourished patients according SGA classification B and C were assessed as undernourished using BMI. BMI assessment also estimated obesity (BMI≥30·0 kg/m2) in four patients who were evaluated by SGA as undernourished. This is the reason why more sensitive and specific tools that include weight loss as the key indicator for evaluating malnutrition must be used. The advisability of using BMI as an appropriate indicator of nutritional status has been widely discussed, especially in patients with heart failure( Reference Gastelurrutia, Lupon and Domingo 16 ) or elderly residents of nursing homes( Reference Kimyagarov, Klid and Levenkrohn 17 ), and some recent studies have shown no associations between BMI and mortality risk in cancer or respiratory disease patients( Reference de Hollander, Van Zutphen and Bogers 6 ). However, in some specific cases (nursing home residents), BMI showed superiority among three parameters considered to be nutritional predictors (BMI, Mini Nutritional Assessment score and serum albumin levels)( Reference Veronese, De Rui and Toffanello 10 ) and might be used as a simple screening tool, although its poor sensitivity must still be carefully considered.
Age is the most relevant confounding factor of malnutrition and we confirmed a higher prevalence of malnutrition assessed by SGA among older patients. Fewer men than women were malnourished according to SGA, but the differences between genders were not statistically significant.
Albumin is often advocated as being an indicator of malnutrition, but with the possible exception of kwashiorkor, serum albumin level is an unreliable marker of nutritional status( Reference Friedman and Fadem 18 ). Other proteins as markers of malnutrition can also be estimated (transferrin, transthyretin, retinol-binding protein). There are many reasons (the half-life of albumin, the dependence of transferrin on Fe status, the rather expensive estimate of retinol-binding protein) why transthyretin is a very suitable marker for assessing efficacy in acute nutritional intervention. But for the clinical setting in Slovakia, albumin is the most common parameter of nutritional screening due to its general affordability. Individuals with simple malnutrition are rarely hypoalbuminaemic. Serum albumin concentration does not often discriminate between well-nourished and malnourished patients( Reference Addolorato, Capristo and Greco 4 ). In our cohort of patients hypoalbuminaemia was measured quite frequently in patients with good nutritional status (15·2 %), as well as in undernourished patients (20·8 %); the differences were not statistically significant. Therefore, in line with others, we consider serum albumin to be rather a marker of severity of concomitant illness rather than of nutritional status( Reference Zadak 19 ). Therefore, it is also reasonable to estimate plasma levels of inflammatory markers such as C-reactive protein, together with the proteins of nutritional status, in order to distinguish the inflammatory response of the body to nutritional status and malnutrition per se. Unfortunately, as our study was started 10 years ago, the routine measurement of C-reactive protein for general screening purposes without the presence of acute concomitant illness was not assigned as mandatory by health-care authorities. Nevertheless, hypoalbuminaemia in our study was found to be associated with mortality as an independent predictor of death; each decrease in albumin by 1·0 g/l was associated with a 3 % increase in mortality( Reference Hrnciarikova, Juraskova and Hyspler 20 ). Similar data have been shown in studies of patients with end-stage renal disease( Reference Dashti, Einollahi and Nabachtian 21 ), after hip fracture( Reference Miyanishi, Jingushi and Torisu 22 ) or in frail elderly patients( Reference Kitamura, Nakamura and Nishiwaki 23 ).
Malnutrition is commonly associated with certain diseases( Reference Davies, Philips and Naish 24 , Reference Charlson, Pompei and Ales 25 ), so we explored the prevalence of malnutrition estimated by SGA among the co-morbidities. A statistically significant difference in the prevalence of malnutrition was clearly noted only in patients with gastrointestinal and oncologic diseases. Surprisingly, we failed to find a difference in the group of patients with liver diseases; this is probably due to low presence of end-stage liver disease in our sample. We have a similar explanation for the negative findings among patients with neurological diseases, probably due to the short time since onset of neurological disorders and the low number of patients with dementia in our cohort.
The impact of malnutrition on the higher need of hospitalization and increased in-hospital mortality was reported by Agarwal et al.( Reference Agarwal, Ferguson and Banks 26 ); weight loss of 15 % or more of maximum body weight is also associated with increased risk of death( Reference Ingram and Mussolino 27 ). Nutritional status also influences treatment tolerability in oncology patients( Reference Barret, Malka and Aparicio 28 ). Our study was underpowered to show any differences in short-term (in-hospital) mortality, as only six patients died, but we did find an association of malnutrition with long-term mortality at up to 10 years of follow-up. The impact of nutritional status on mortality was analysed using Cox regression models, controlled for age, gender, BMI and serum albumin level. Age and serum albumin level were independent predictors of survival, as expected. In addition, malnutrition as assessed by SGA was an independent predictor of death in a 10-year follow-up in the Slovakian health-care setting; the mortality of malnourished patients was 55 % higher compared with patients with normal nutrition. Our findings are similar to results from studies in patients with various diseases( Reference Rodriguez-Pecci, Carlson and Montero-Tinnirello 29 , Reference Castellanos Fernandez, Santana Porben and García Jordá 30 ). However, when co-morbidity (oncologic and gastrointestinal) was added to our statistical analysis, nutritional status was no longer a significant predictor of survival; we expected a confounding effect from co-morbidity. The relatively small sample size might also have contributed to this result.
In summary, SGA is a simple screening tool of nutritional status and can be routinely used in Slovak hospitalized medical patients to indentify malnutrition, which predicts long-term risk of death. SGA may be used as a reliable and valid instrument for screening of malnutrition in patients who might benefit from some nutritional interventions; the effectiveness of such treatment should be prospectively evaluated.
Acknowledgements
Acknowledgements: The authors would like to thank the staff of the Department of Internal Medicine, Teaching Hospital Nitra (cooperating physicians, nurses, dietitians and administrative staff) for their kind support of this study. Financial support: This research received no specific grant from any funding agency in the public, commercial or not-for-profit sectors. The Slovak Society of Parenteral and Enteral Nutrition (SSPEV) initiated and supported the study (provided ethical support and advisory recommendations) with the aim of mapping the situation in one of Slovakia’s largest hospitals and publishing the results of this study as the first data from Slovakia in this field. Conflict of interest: None. Authorship: V.K., design and coordination of the study, writing of the manuscript; J.R., design of the study and statistical analysis; M.G., collection of data; A.K., collection of data and statistical analysis. Ethics of human subject participation: The study was approved by local ethics committee of the Nitra Teaching Hospital in Slovakia.


