Introduction
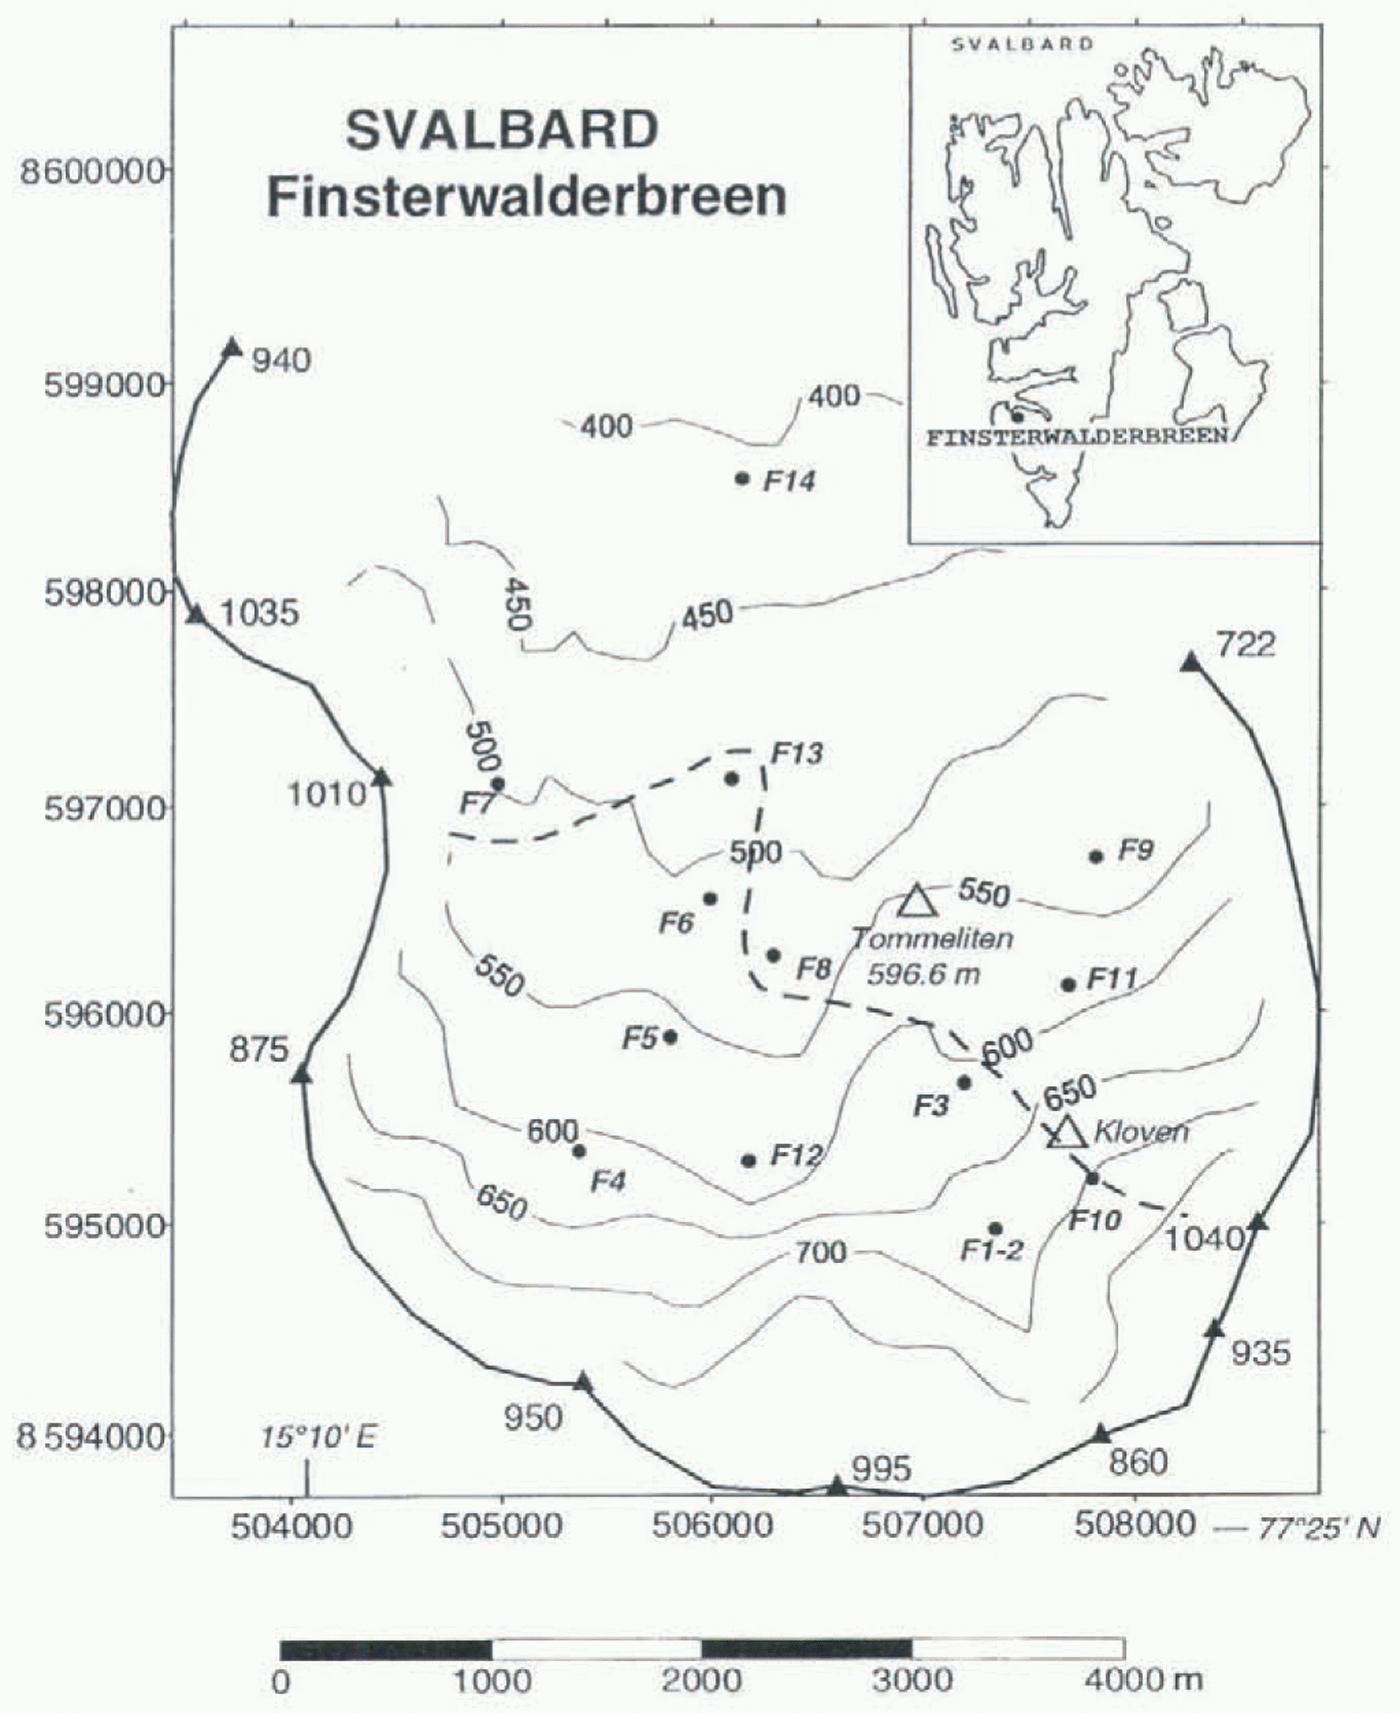
Finsterwalderbreen is a surge-type glacier, with a polythermal regime, in a quiescent phase since its last surge around 1900 (Liestol, 1969; Nixon and others, 1985; Hagen and others, 1993). The glacier is located in Spitsbergen at 77°26ʹN, 15°15ʹE. It is 11 km long, has a 44.5 km2 surface, and ends on a moraine. It has been chosen as a test site to be investigated under EU project EV5V-CT93-0299: “Investigations of glacier surges: measurements and modelling of ice dynamics in Svalbard, European Arctic” (Fig. 1).
The aim of the present study is to estimate the recent net mass balance of the glacier and to determine the equilibrium line (EL), as well as the l37 Cs and 2l0 Pb fallout levels. In the accumulation area the detection well below the surface of a reference radioactive peak corresponding to the atmospheric thermonuclear tests conducted in 1961–62, at sites including Novaya Zemlya, Russia (71–73° N, 55° E) (Aarkrog and others, 1994), and deposited in 1962–63, can be used to determine the net accumulation (Lefauconnier and others, 1994). 210 Pb (21.3 years half-life), of natural atmospheric origin, is the daughter of the rare gas isotope 222 Rn, from the 238 U series.
During the 1994 and 1995 spring seasons, in the accumulation area and close to the estimated EL, at elevations of 445–730 m a.s.l. (Fox and Nuttall, in press), we made 13 ice cores with a light electromechanical drill (denoted F2, F3, F4, F5, FC, F7, F8, F9, F10, F11b, F12, F13 and F14, with depths ranging from a few meters up to 30 m), and collected samples from a pit (F11t) (table 1). The locations of the cores were plotted on an accurate map by Fox and Nuttall (in press), based on a 1990 air photograph (Fig. 1). After density measurement, the snow samples (25 cm mean length) were sealed in plastic bags. All ice cores consist of superimposed ice, even in the accumulation area. Just under the winter layer, the snow density rapidly increases to 0.9. Then, in the base camp close to the glacier, the samples were melted and filtered through ion-exchange resin paper (Delmas and Pourchet, 1977), in order to conduct high-resolution gamma spectrometry at the laboratory in France.
In the ablation area, melting and water run-off take place in summer. Natural and artificial radioactive deposits are concentrated in a dust layer just under the winter snow layer, and represent an accumulation of dust and particles over many years (Pourchet and others, in press). For ice cores collected close to the EL, the original specific activities and deposition rates are enhanced by subsequent adsorption of additional radioactivity. Directly in the field, a gamma-ray
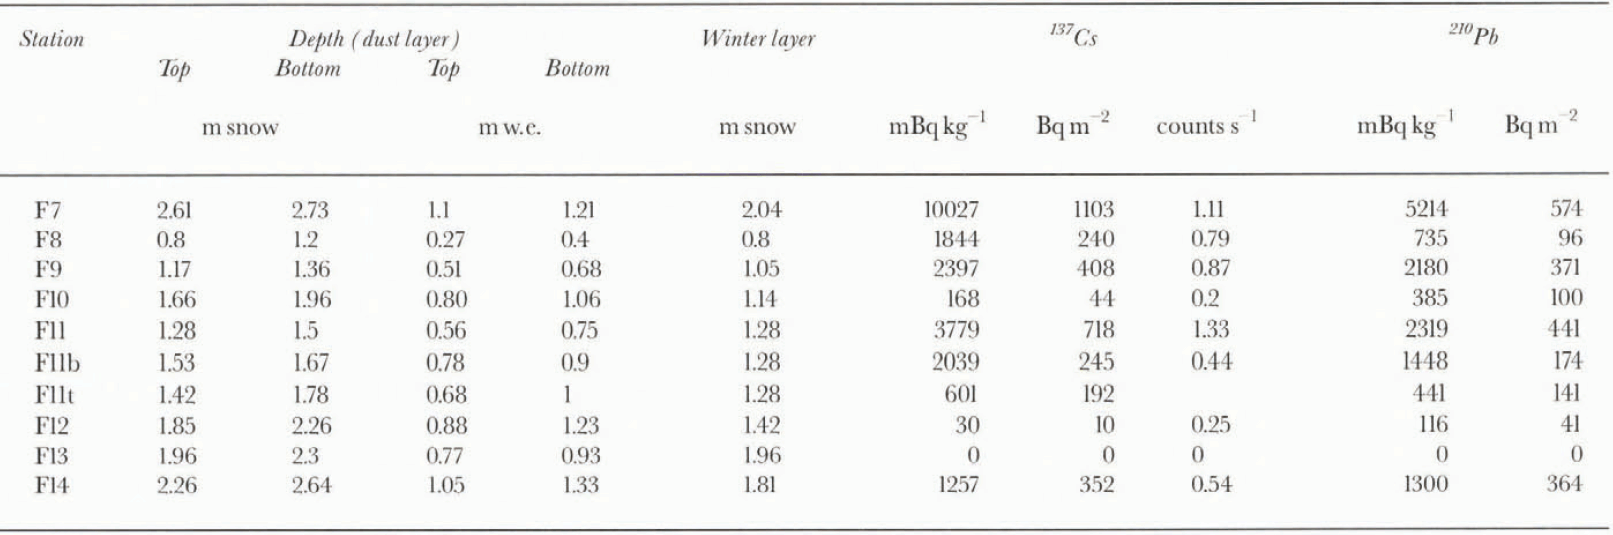
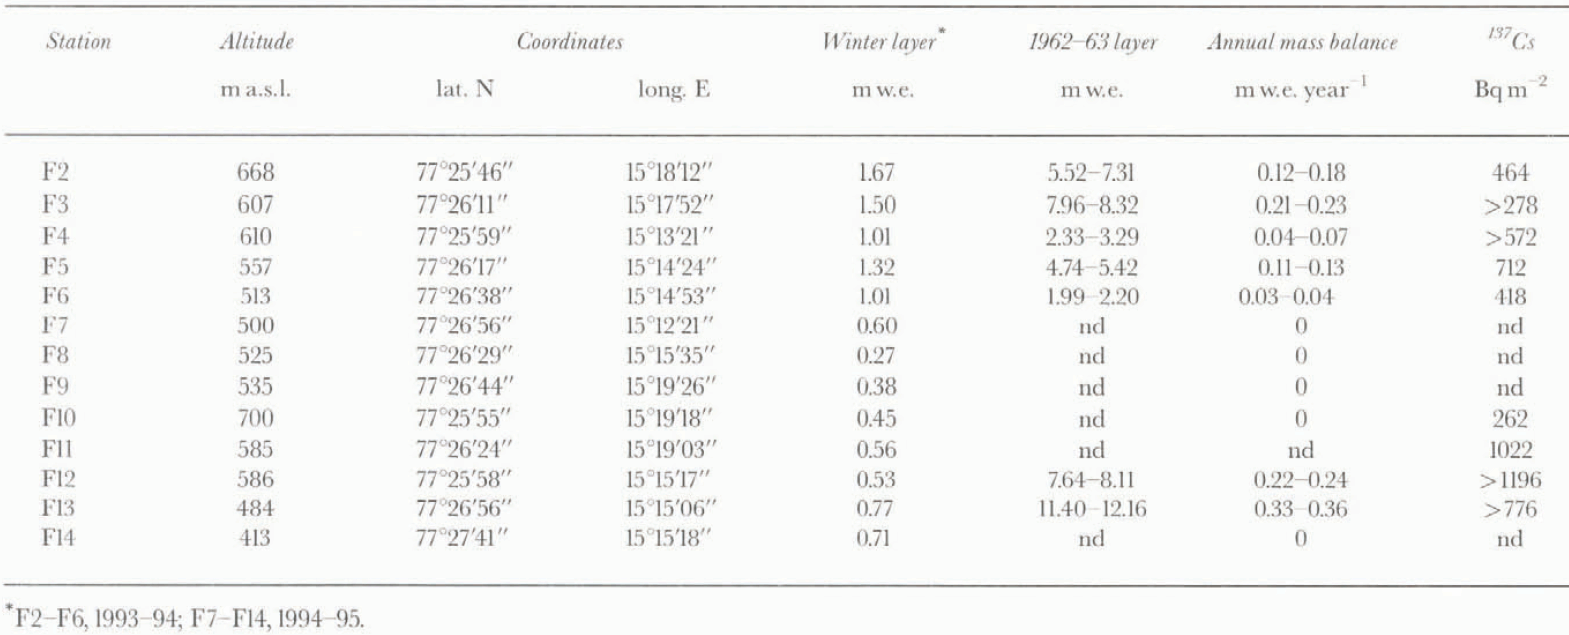
Ice core locations, winter layer thicknesses, accumulation rates and total 137 Cs deposition rates from thermonuclear tests (at the time of deposition)
detector was lowered down each borehole for determination of this highly radioactive layer, prior to the laboratory measurements.
In Situ And Laboratory Gamma-Ray Measurements
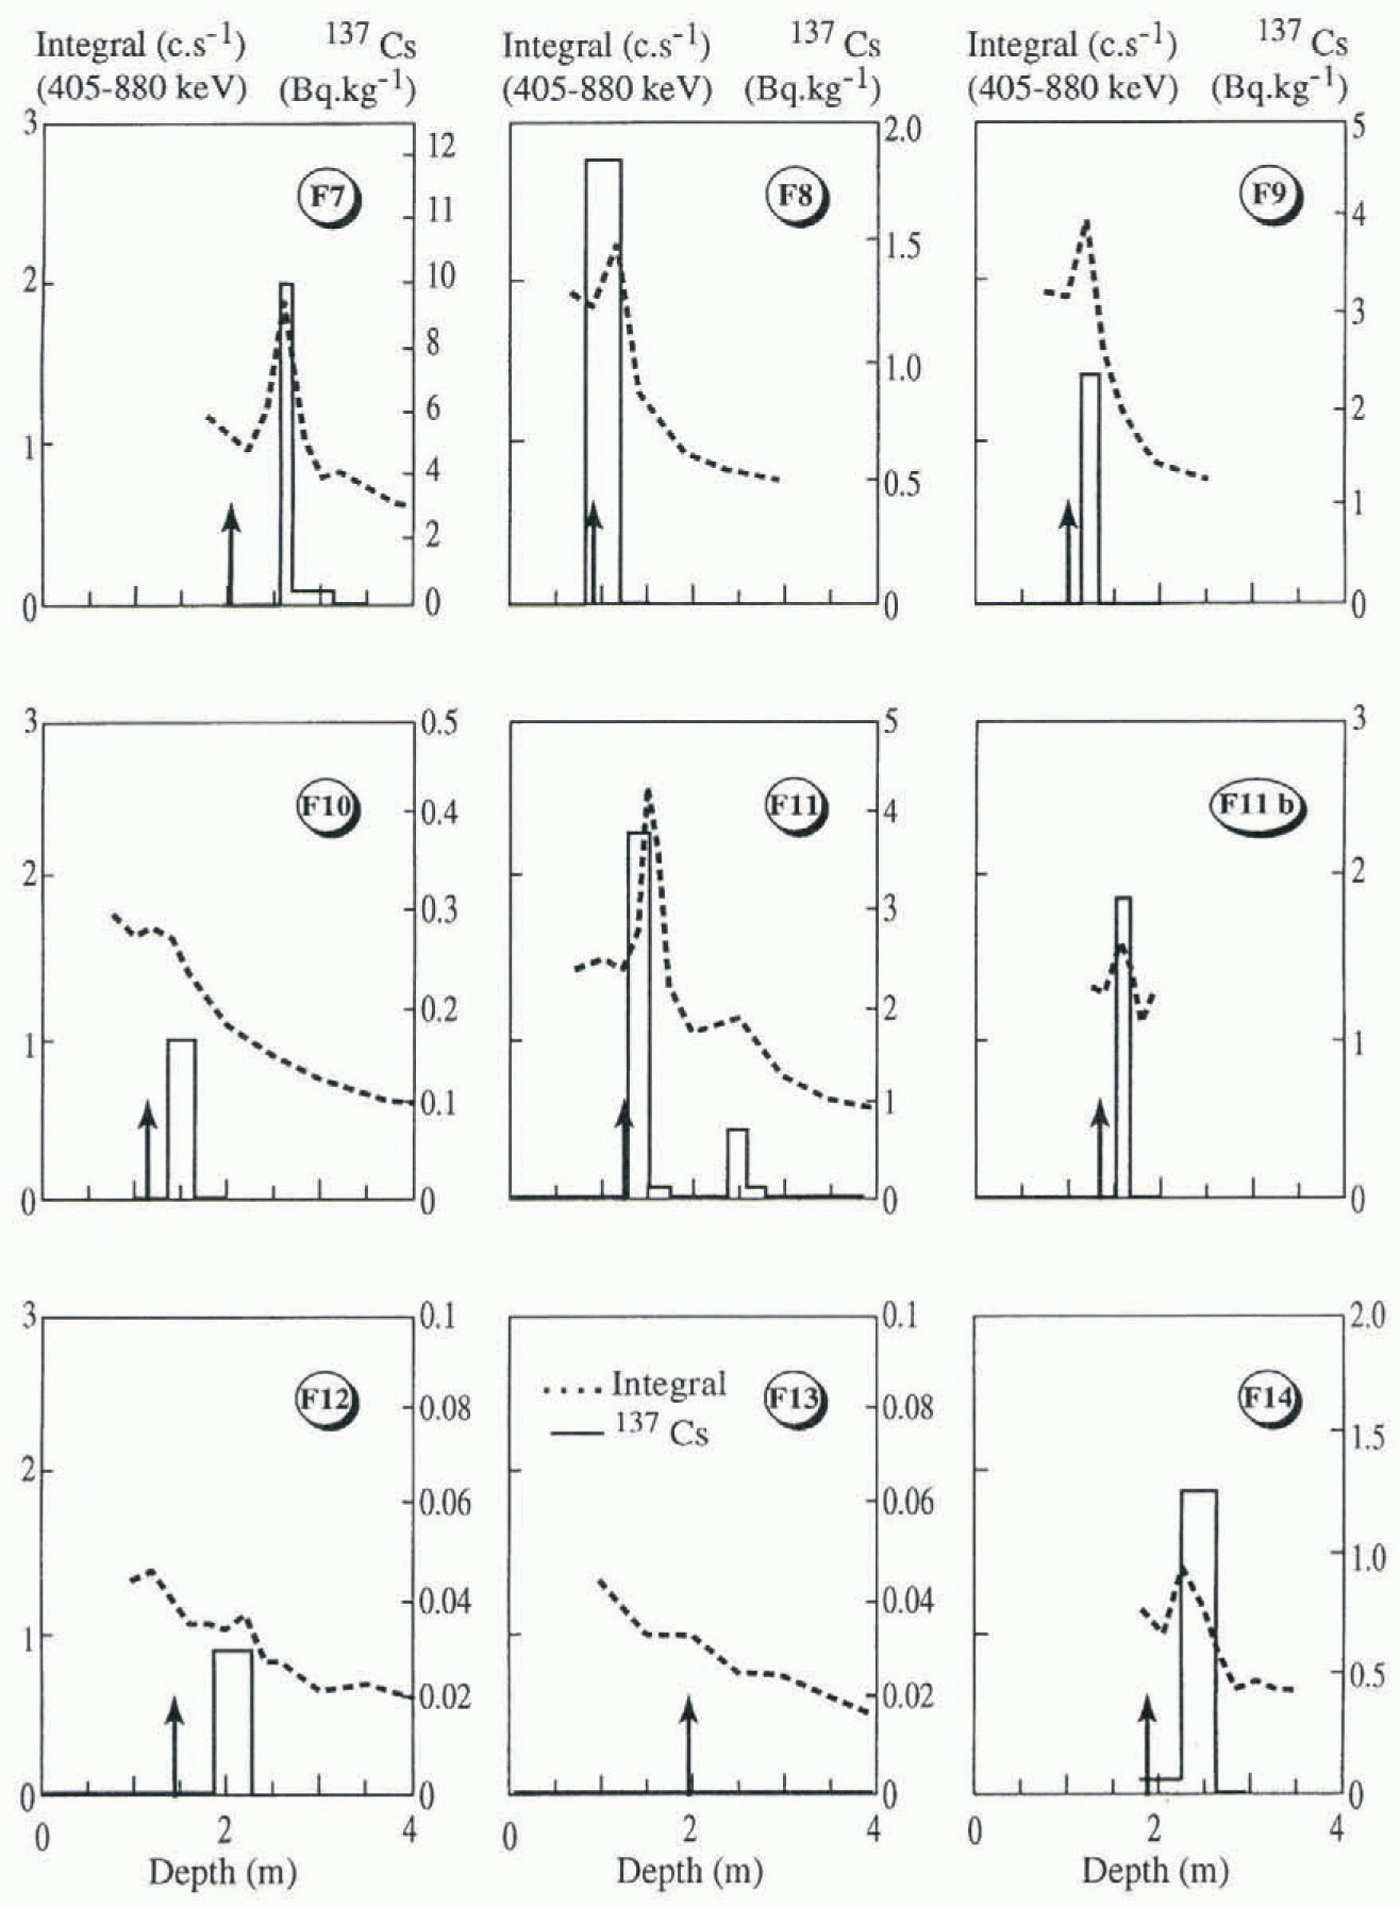
An in situ gamma-ray detector (NaI (T1)) was lowered down each borehole, and 137 Cs contents (energy window: 405–880 keV) were recorded at successive depths (Pinglot and Pourchet, 1989), with a 5 cm depth resolution. As the depth increases, the cosmic-ray signal decreases. Just below the winter layer, the counting rate (integral of Counts in the energy window; 5 mn counting time) rapidly increases and shows a clear maximum at stations F7–F11sb and F14, whereas it is not delectable at stations F12 and F13 (situated in the accumulation area as discussed below) (Fig. 2).
Map of Finsterwalderbreen with proposed zone for the equilibrium line (dashed line), drainage basin (thick line), ice cores (F1–F14) and altitudes (m a.s.l).
On corresponding ice-core samples, high-resolution gamma spectrometry was conducted at the laboratory with a high-purity, N-type germanium detector (20.6% relative efficiency) used with a low specified background. It was mounted with an anti-Compton annulus which combines a 9 in × 8 in and a 3 in × 3 in plug of NaI (T1) scintillators (Pinglot and Pourchet, 1994). This type of detector exhibits excellent efficiency, even down to energies as low as 46.52 keV (210 Pb). The absolute efficiency curve from 40 keV to 2.6 MeV was established using standard solutions (LMRI, Amersham, NBS) and quantitative analysis software (db Gamma from Canberra Electronique Company). The detection threshold levels for 210 Pb and 137 Cs were 25 and 4 m Bq, respectively (Pinglot and Pourchet, 1995).
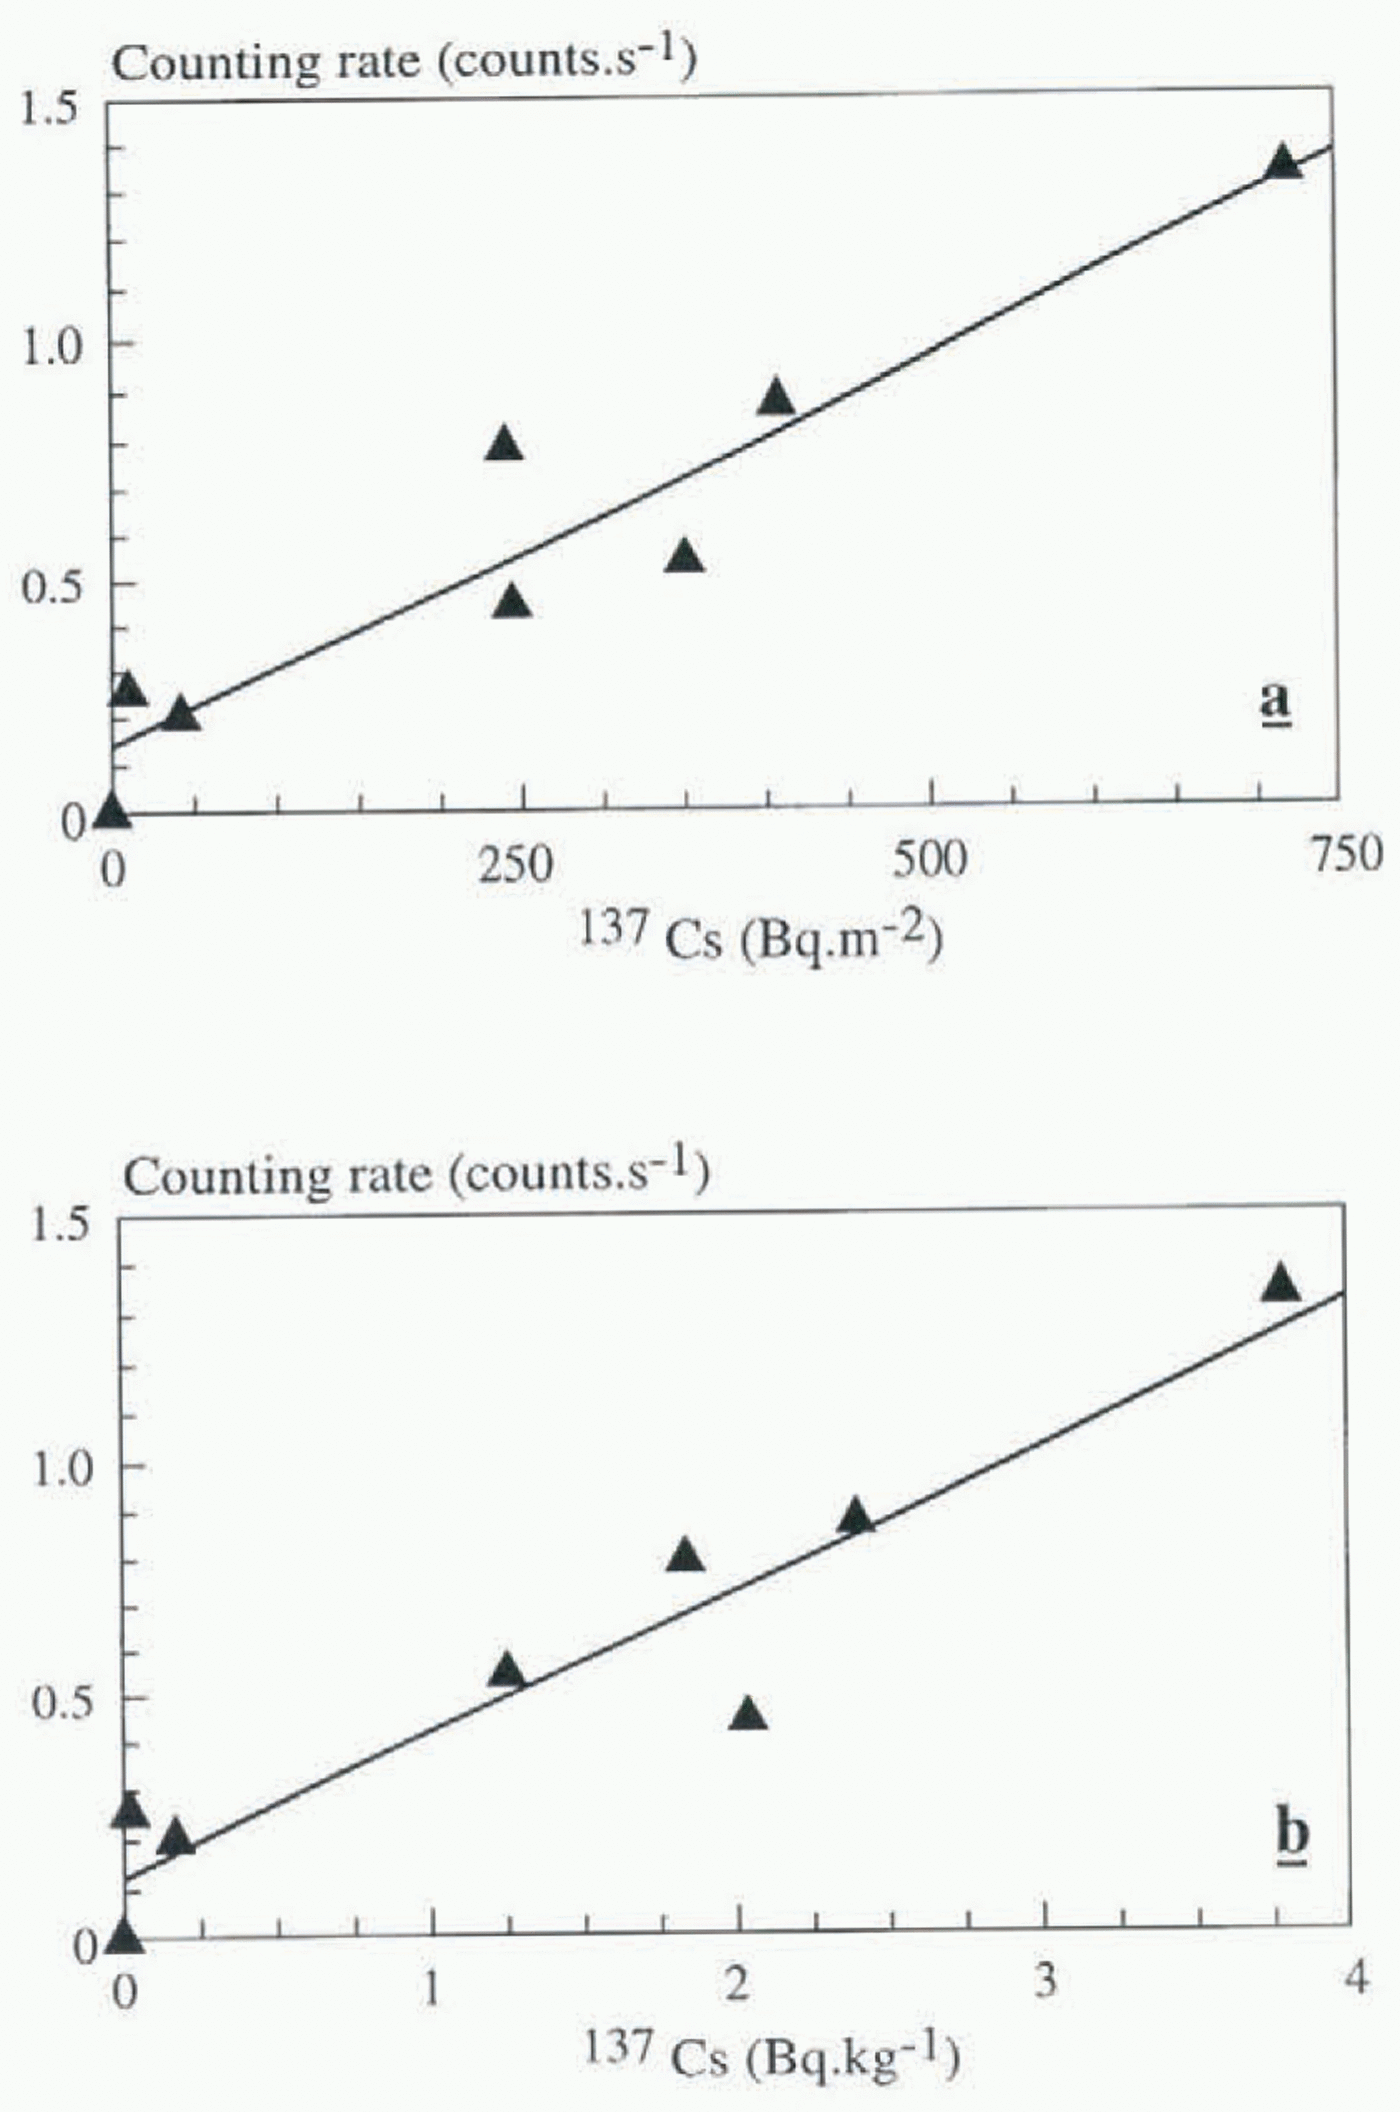
Gamma spectrometry on samples perfectly matches the in situ determinations, showing maximum 137 Cs contents at the same depths, as well as maximum 210 Pb contents (Fig. 2; Table 2). The counting rate of the in situ detector is proportional (r = 0.90) to the 137 Cs deposition rate and the specific activity (Fig. 3). In order to determine the sensitivity of the detector, the measurement from F7 was removed. The corresponding radioactive layer was too narrow (0.12 m), and the detector response led to an underestimate of both the activity (3 instead of 10 Bq kg−1) and the deposition (600 instead of 1100 Bq m−2) for 137 Cs.
The detector sensitivity is 0.4 counts s−1 per Bq kg−1. This value is lower than previous determinations (1.43 counts s−1 per Bq kg−1) (Pinglot and Pourchet, 1989), for similar energy windows (430–440 to 730–880 keV). This difference may be due to higher density of the ice at Finsterwalderbreen (0.86–0.92).
137 Cs Fallout From Thermonuclear Tests In The Accumulation Area
The in situ gamma-ray detector was used to make measurements in the estimated accumulation area of Finsterwalderbreen
In situ gamma-ray (dashed line) and 137 Cs (solid line) measurements vs depth for nine ice cores in the ablation area, with winter snow layer (arrow).
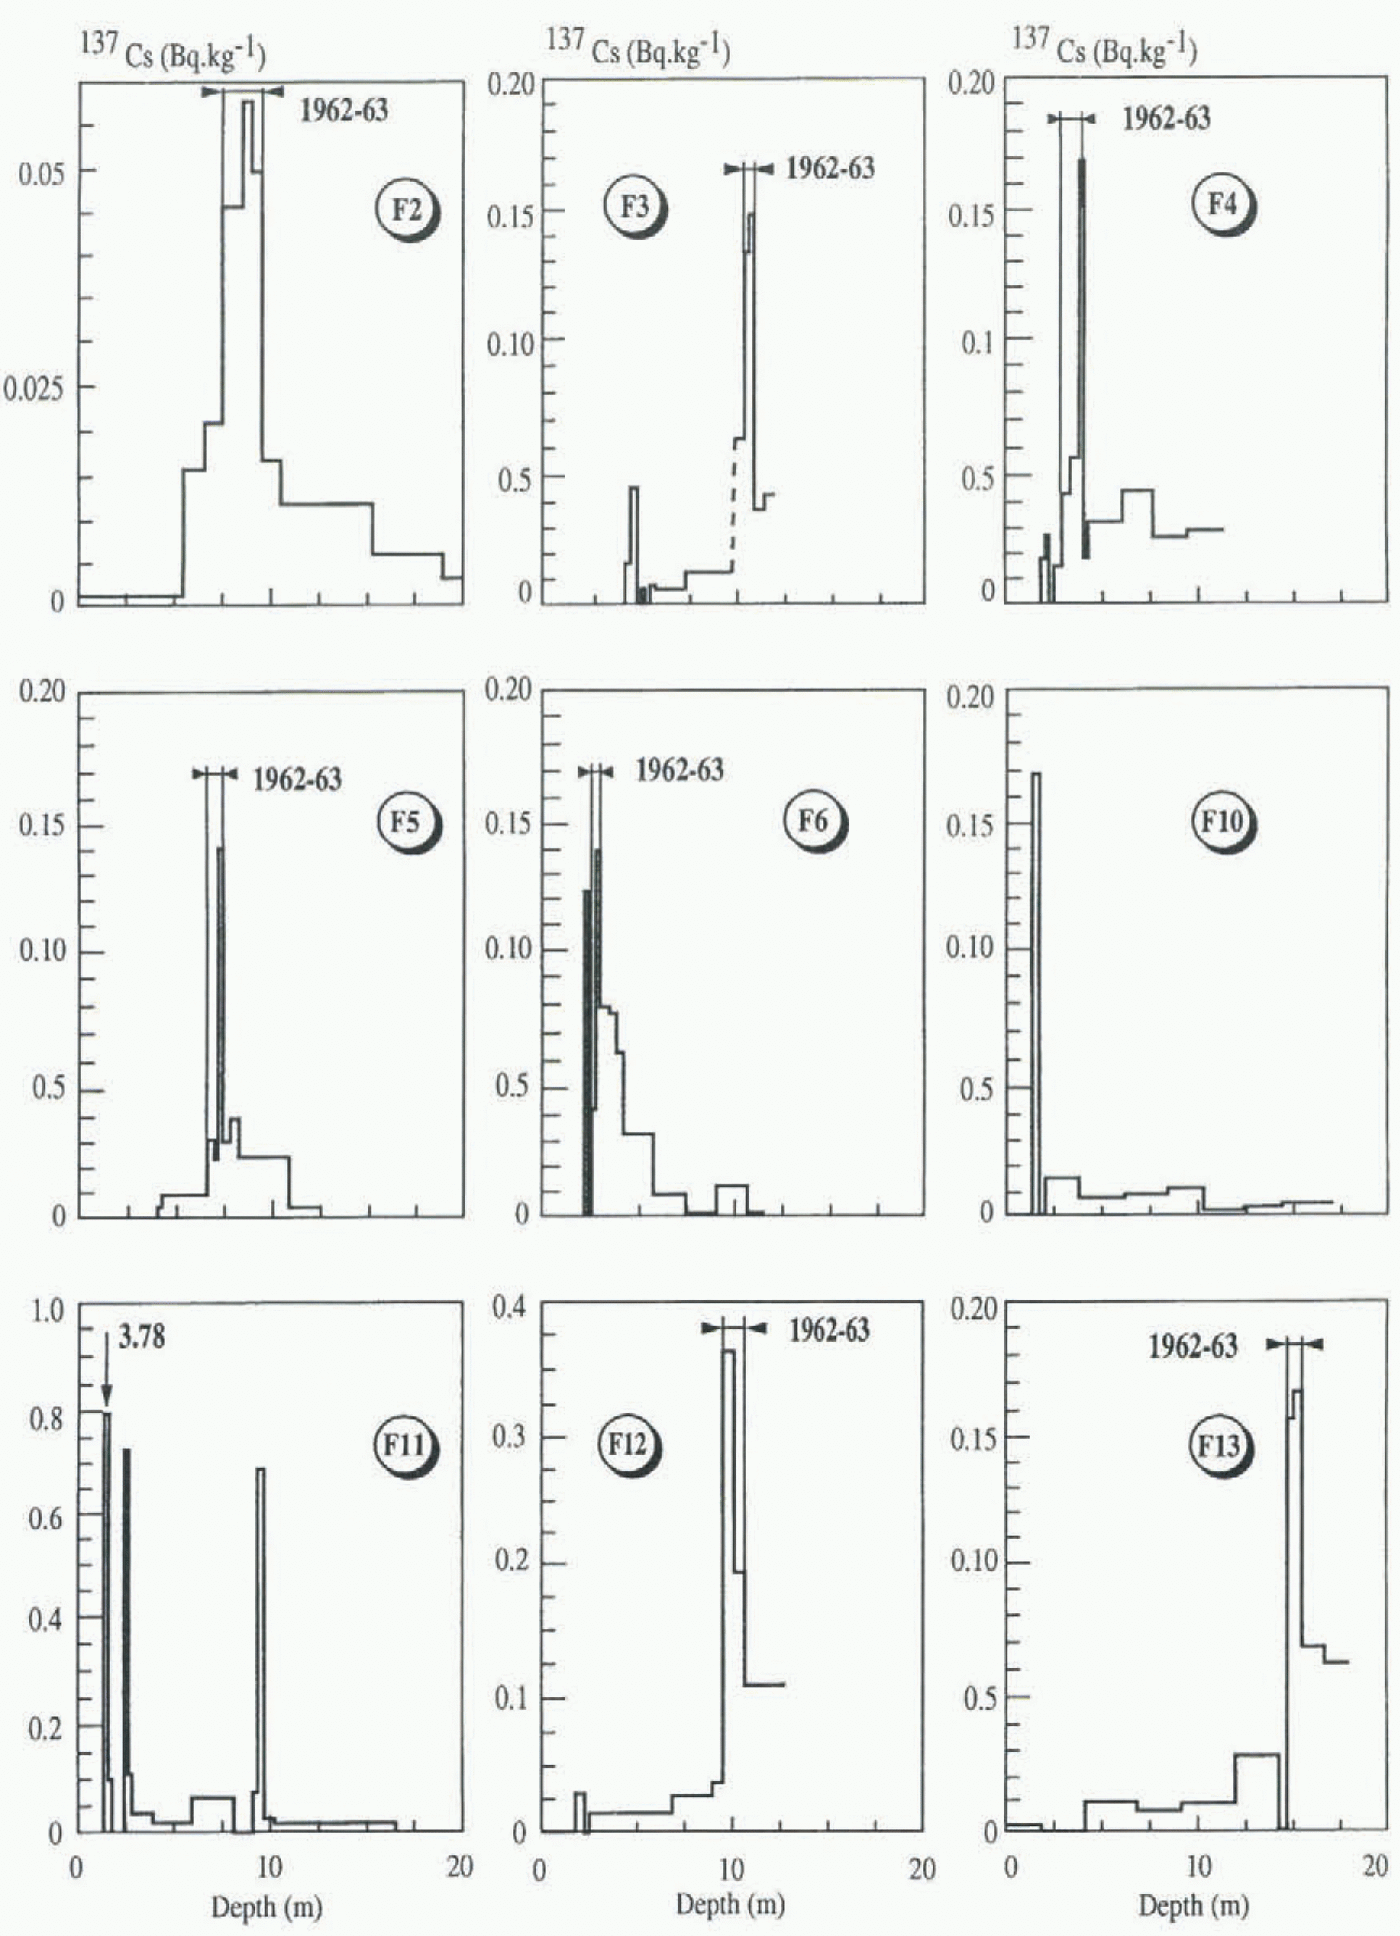
in order to determine the 1962–63 layer, down to the bottom of ice cores F10–F13. These direct measurements in the field are well correlated with laboratory determinations: no, or very weak, 137 Cs peak in F10; peaks at 9.5, 10 and 15 m, respectively, for F11 (narrow peak), F12 and F13 (Fig. 4). From the in situ and laboratory gamma-ray measurements, F12 (with a very weak 137 Cs signal) and F13 clearly belong to the accumulation area.
In the accumulation area of six glaciers over Svalbard (showing a clear densification feature), assuming that no
137 Cs and 210 Pb activities and deposition rates of the dust layer, under the winter snow layer (at the date of measurement: 1 July 1995)

Counting rate of the gamma-rat detector vs the deposition rate (a) and 137 Cs specific activity (b).

radioactivity is lost by water flow, the mean 137 Cs fallout from the atmospheric thermonuclear tests (1954–74) reached 340 Bq m−2 (110 Bq m−2 standard deviation) at the time of deposition (Pinglot and others, 1994).
In the accumulation area of Finsterwalderbreen, with superimposed ice, the 584 (±304) Bq m−2 mean value for eight ice-cores (Table 2; Fig. 4) is nearly twice the mean Svalbard value. The 137 Cs deposition is greater than the original atmospheric fallout. It may indicate that additional 137 Cs is introduced by extra surface deposition (water flow) from higher locations on the glacier, including, then, an influence of the basin area.
Another special feature of the 137 Cs distribution in ice cores in the accumulation area is the presence of 137 Cs well below the 1962–63 maximum. In all ice cores, 137 Cs is found down to the bottom of the boreholes, at an estimated date well before 1954, when the first tests were conducted. Taking into account the value of the mean annual mass balance, with the assumption of no great change, the deposition date of the bottom layers in ice cores F6, F2 and F4 is at least 1900; likely about 1915 at F5 and 1950 at F3, F12 and F13.
This suggests, due to melting and percolation (Ambach and others, 1989), the possible transportation of radioactive isotopes along the grain boundaries, or the presence of many microfractures, or crevasses, all over the glacier surface.
Mean Annual Accumulation And Equilibrium Line
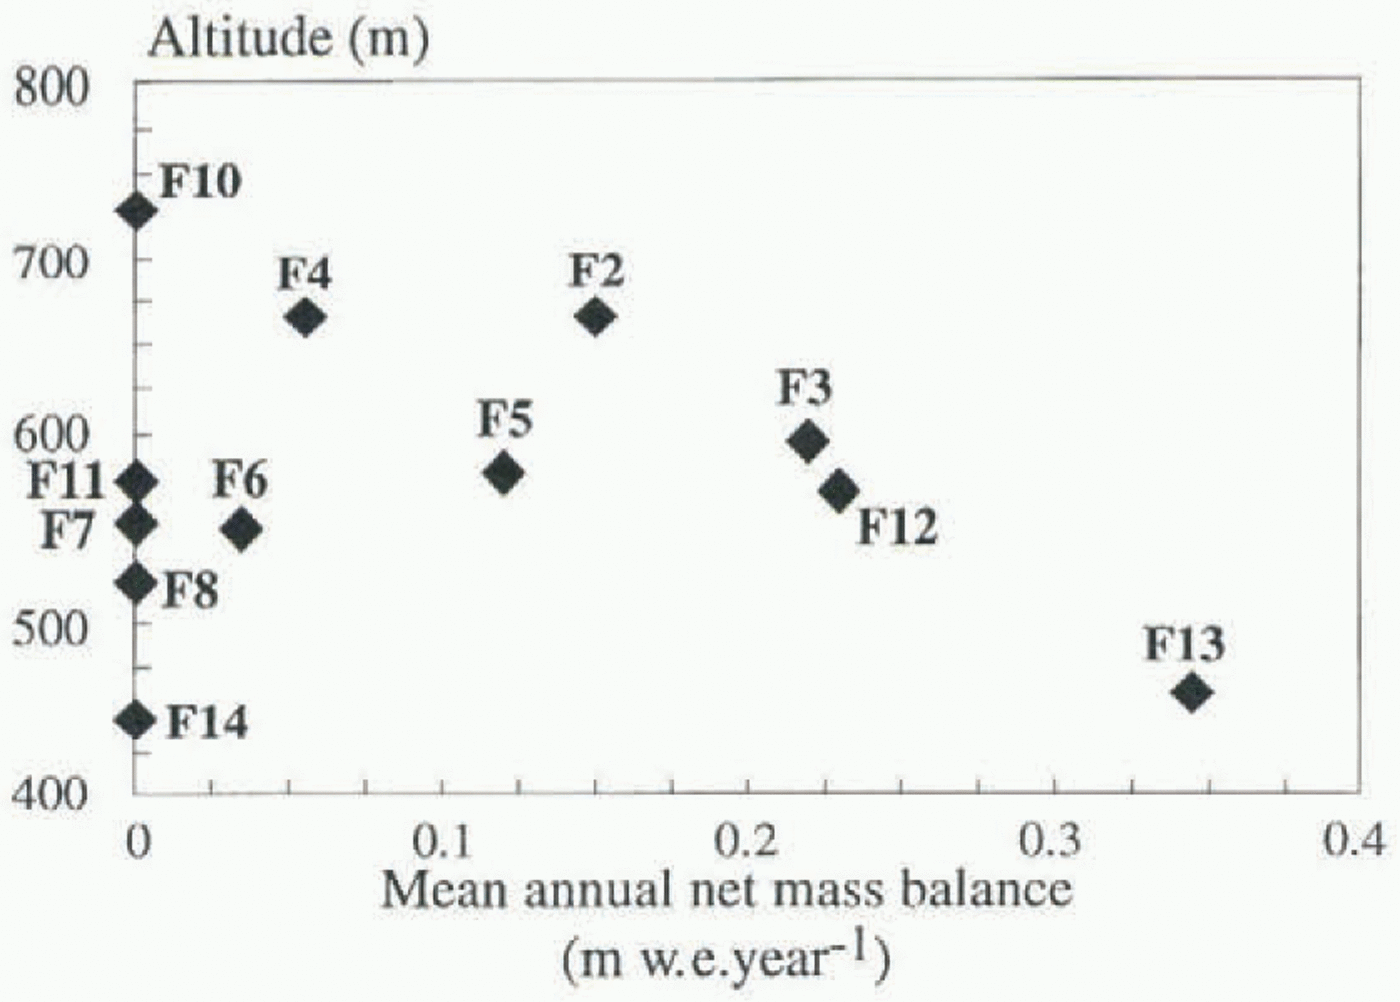
The mean annual accumulation is computed over 31 or 32 years (137 Cs fallout from 1962–63 to 1993 or 1994). The 1962–63 maximum was estimated from the 137 Cs profile, taking into account the most probable slight vertical transport due to melting, as described above. This net mass balance varies independently with altitude (Fig. 5). It is maximum at F13 (0.34 m w.e.) at 484 m a.s.l., and exhibits lower values at F3 and F12 (0.23 m w.e.) at 607 and 586 m a.s.l., respectively. However, the mass balance is highly variable at a given altitude. It can be as low as zero for altitudes of 445–700 m. The EL of Finsterwalderbreen is not represented by a constant altitude line but can be located roughly in a zone as illustrated in Figure 1.
There exists, from the surrounding basin area (900–1000 m maximum altitude) a central zone down to 460 m altitude where annual accumulation occurs. We measured the thickness of the winter snow layer with a rigid stick. It is maximum along this axis (0.77 m w.e. at F13 for winter 1994–95). Ablation determination with stakes (Nuttall and others, 1997) shows a similar pattern, with no ablation at F9 between the summers of 1994 and 1995. This may be due to winter snow topographic features in relation to Erdmannberget summit (1035 m) and Tommeliten nunatak (597 m).
Concerning our study of 12 Svalbard glaciers, the mean ELA varies from 340 m (Amundsenissen) to 750 m (Gruvfonna and Kronebreen) (Pourchet and others, in press). With an ELA averaged to 545 m a.s.l., the accumulation area ratio (AAR) of Finsterwalderbreen is 0.3. This indicates a strong negative net balance.
137 Cs AND 210 Pb Deposition Rates In The Ablation Area
In situ (137 Cs) and laboratory (137 Cs and 210 Pb) gamma spectromctries were conducted in the seven ice cores and their samples, in the ablation area (Fig. 2; Table 2).
The dust layer corresponding to the ablation surface of the glacier, under the winter snow layer, represents an accumulation over many years. The 137 Cs deposition rate at the time of measurement, 1 July 1995, varies from 0 (in the accumulation area, for locations higher than the EL) to 1103 Bq m−2 (station F7, in the ablation area) (Fig. 2). In the ablation area, radioactivity values are those given at the time of measurement, as we do not know the exact initial deposition location.
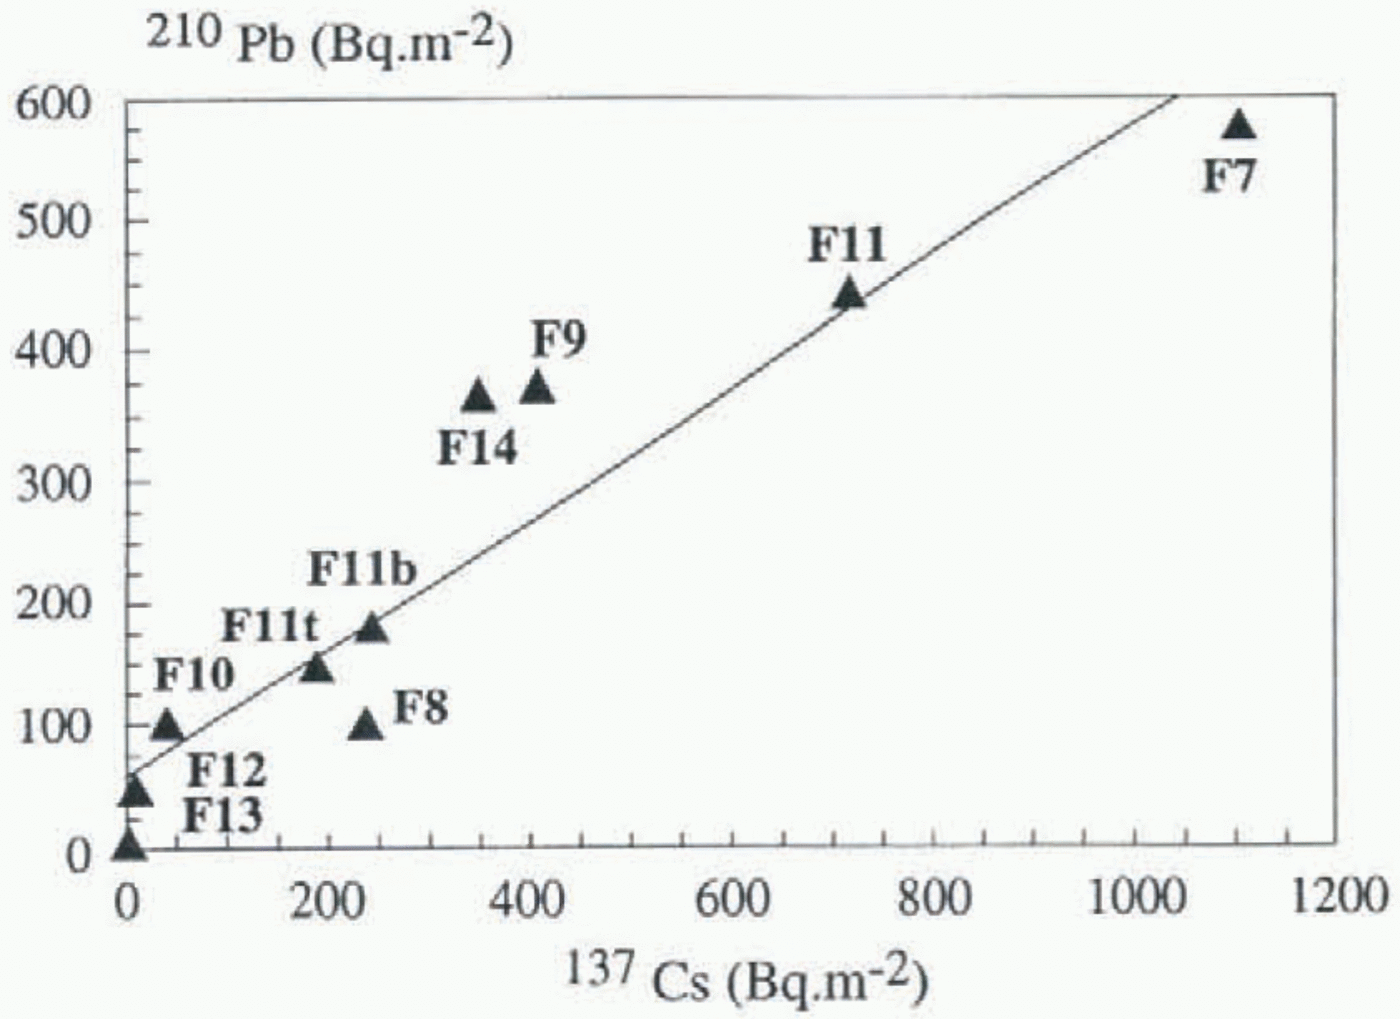
The 210 Pb deposition rate ranges from 0 to 574 Bq m−2. A linear relationship (r 2 = 0.90) exists between 137 Cs and 210 Pb deposition rates (Fig. 6). This means that the process of concentration of radioactive materials is the same for a constant natural deposition (210 Pb) and for transient events like the atmospheric thermonuclear tests of 1954–74 (137 Cs). In the ablation area, close to the EL of Finsterwalderbreen, the 137 Cs mean deposition is even higher than in the accumulation area. The mean 137 Cs deposition for seven ice cores for this dust layer is 465 Bq m−2, compared to 292 and 170 Bq m−2, respectively (values not corrected to the time of deposition), in the accumulation areas of Finsterwalderbreen and from six Svalbard ice cores (Pinglot and others, 1994). This shows a strong 137 Cs concentration. This increase in 137 Cs deposition reinforces the previously mentioned extra deposition due to water flow and infiltration at the glacier surface during the summer season (at F7 the deposit is 1103 Bq m−2). This dust layer, by a subsequent adsorption, acts like a filter for radioactive materials removed from the basin (a soil sample from Tommeliten nunatak showed 137 Cs activity).
137 Cs vs depth for nine ice cores in the accumulation area, with estimated 1962–63 thermonuclear test maximum.
The mean 1993–94 and 1994–95 winter depositions for 210 Ph for all studied ice cores on Finsterwalderbreen were 62 and 29 Bq m−2, respectively. As much as ten times this value is found in the dust layer (even without half-life correction). Ice cores recovered close to the EL exhibit concentrations of 137 Cs and 210 Pb which are clearly present in the dust layer. This process allows the location and mapping of the ablation area and EL zone on Finsterwalderbreen, as described above.
Analysis of the profile at F10, together with a small amount of 137 Cs (42 Bq m−2) indicates that F10 is located in the accumulation area, with a mean annual mass balance close to zero (Fig. 4).
Large water run-off deeply influences the deposition of particles, as demonstrated at F11. Two ice cores (F11 and F11b, 5 m apart) and a pit (F11t) (figs 2 and 4) show a great variability of 137 Cs and 210 Pb depositions in the dust layer, from 192 to 718 Bq m−2 for 137 Cs, and from 141 to 441 Bq m−2 for 210 Pb (the winter layer shows a 17 Bq m−2 210 Pb deposition). F11 belongs to the set of ice cores showing strong 137 Cs and 210 Pb contents of the dust layer under the winter snow, but also a continuous 137 Cs distribution down to 10 m depth. The 0.69 Bq kg−1 maximum 137 Cs content between 9.34 and 9.64 m, which is also a maximum 210 Pb content (0.44 Bq kg−1) does not represent 1962–63, but rather a layer with a concentration of isotopes due to melting and redistribution.
Conclusions
In the accumulation area of Finsterwalderbreen, with superimposed ice, the detection well below the surface of a radioactive peak corresponding to the atmospheric thermonuclear
Mean annual net mass balance vs altitude at Finsterwalderbreen.
210 Pb vs 137 Cs deposition rates.
tests conducted in 1961–62 can be used to determine the mean annual net accumulation. This accumulation varies independently with respect to altitude, with a maximum of 0.34 m w.e. However, due to infiltration, 137 Cs is found down to the bottom of the boreholes, at estimated dates well before 1954.
In the ablation area, all artificial radioactive deposits are concentrated in the ice surface layer just under the winter snow. On corresponding ice-core samples, gamma spectrometry perfectly matches the in situ determinations, showing maximum 137 Cs contents at the same depths. The counting rate of the in situ detector is proportional to the 137 Cs deposition rate and the specific activity A linear relationship exists between 137 Cs and 210 Pb deposition rates. This dust layer arts like a filter for radioactive materials removed from the basin. In the ablation area, close to the EL, the 137 Cs apparent mean deposition in the dust layer is higher than in the accumulation area, 465 vs 292 Bq m−2, making it possible to locate and map the ablation area and the EL zone. With an ELA averaged to 545 m a.s.l., the AAR is 0.3, indicating a strong negative net balance for Finsterwalderbreen.
Acknowledgements
This study was funded by EU project No. EV5V-CT93-0299, and fieldwork during spring 1994 and 1995 was jointly financed by the Institut Français pour la Recherche et la Technologie Polaires (project No. 265-294) and the Fondation Franco-Norvégienne. The logistic support from Norwegian Polar Institute at Longyearbyen was greatly appreciated. The authors would like to thank Drs J. O. Hagen, J. A. Dowdeswell, A.-M. Nuttall and R. S. Ødegård for helpful discussions and Mr C. Vincent for the map of the upper part of Finsterwalderbreen. The comments from Dr D. Peel and an anonymous reviewer were greatly appreciated.