


1. Introduction
The Svalbard archipelago, containing ~10% of the glaciated area in the Arctic outside the Greenland ice sheet (Schuler and others, Reference Schuler2020), is one of the fastest warming polar regions (Isaksen and others, Reference Isaksen2022). This glaciation is unevenly distributed within the archipelago territory. Oceanic and atmospheric circulation give rise to a gradient in air temperature and precipitation over Svalbard from the western coast of Spitsbergen Island, exposed to the warmer Atlantic Ocean, to the northeast (Isaksen and others, Reference Isaksen2016). This regional-scale circulation is amplified locally by the warming effects of the ongoing ‘Atlantification’ of western Spitsbergen fjords, including the broad Isfjorden and the smaller Grønfjorden bays (Bloshkina and others, Reference Bloshkina, Pavlov and Filchuk2021). The glaciers in the central, less glaciated part of Spitsbergen Island, located along the Isfjorden bay, have started to retreat faster compared to the other Svalbard glaciers (Chernov and Muraviev, Reference Chernov and Muraviev2018).
Many different approaches to assessing the archipelago-wide glacier mass balance have been presented to date, all of which involve mathematical modelling or, at least, spatial inter- and extrapolation of point or glacier-wide mass-balance values (Hagen and others, Reference Hagen, Melvold, Pinglot and Dowdeswell2003; Schuler and others, Reference Schuler2020; van Pelt and others, Reference Van Pelt2019). Future projections were evaluated as well, suggesting an accelerating decrease of the average climatic mass balance under Representative Concentration Pathways 4.5 and 8.5 emission scenarios (van Pelt and others, Reference Van Pelt, Schuler, Pohjola and Pettersson2021). The mass-balance modelling requires thorough validation based on in situ data, and the best data source is the direct mass-balance observation, which captures the large temporal and spatial variability of climatic and glacier processes. Notably, a recent study by Schuler and others (Reference Schuler2020) incorporated 12 direct mass-balance series from ongoing monitoring programmes (lasting longer than 5 years) into different parts of the archipelago. The Barentsburg area was represented by the only glaciological record from the Austre Grønfjordbreen glacier. Elagina and others (Reference Elagina2021) state that the glacier-wide annual values of Austre Grønfjordbreen are not annual after all; these values were obtained over a period of more or less than exactly 1 balance year, and are not accompanied by winter mass-balance values.
A mass-balance dataset, which is now the longest series in the Barentsburg area, is presented below for a glacier named Aldegondabreen. This series follows the conventional floating-date system and also includes seasonal mass-balance values. The data have been homogenised since 2007/08 and compared with a geodetic mass balance, which was computed over two pentads, i.e. 2008–13 and 2013–18.
2. Study site
Aldegondabreen (WGMS ID 3470) is a land-terminating debris-free valley glacier located in Nordeskiöld Land, Spitsbergen Island (Svalbard Archipelago), ~10 km southwest of Barentsburg (Fig. 1). It is the second closest in proximity to Barentsburg (after Vøringbreen), and is the closest polythermal glacier. At the end of 2019, it had an elevation range of 140–650 m a.s.l. (99% of its surface was below 500 m) and an area of ~5.3 km2 (Borisik and others, Reference Borisik, Novikov, Glazovsky, Lavrentiev and Verkulich2021). The single snout is elongated from the southwest to the northeast and descends towards Grønfjorden Bay without reaching the coastline. The highest part of the glacier is situated in the south and is unavailable for any ground-based survey due to the steep surface slopes and crevasses rendering it inaccessible.
(a) Location of Aldegondabreen, and (b) changes in its outlines during the monitoring period and ablation stakes networks.

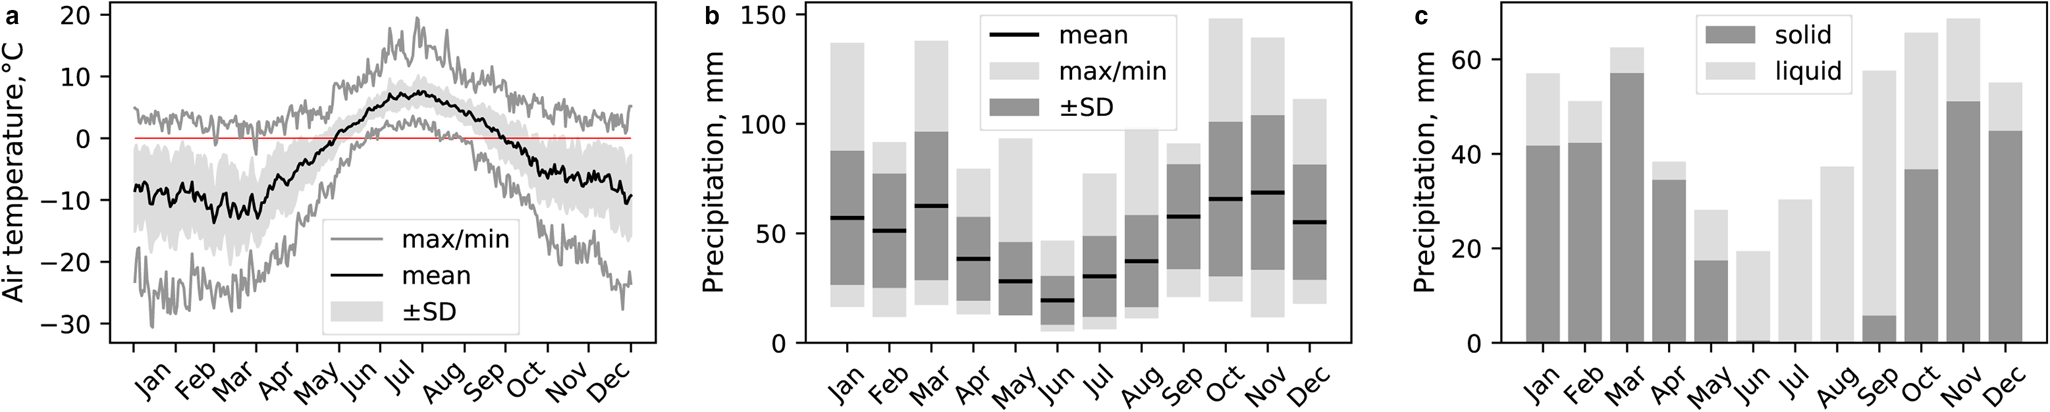
The nearest weather station (WMO identifier 20107) is located on the opposite shore of Grønfjorden Bay in Barentsburg at 76 m a.s.l., ~10 km northeast of the glacier (Fig. 1). There is data available from 1934 on the air temperature and precipitation amount and this source has no major gaps in data since 1993 (Demidov and others, Reference Demidov2020). Averaged intraannual variability of the air temperature and the precipitation amounts is shown in Figure 2.
Daily-averaged air temperature (a), monthly precipitation means (b) and the ratio between solid and liquid precipitation (c) at the Barentsburg weather station in 2000–20.
3. Data and methodology
3.1 Glaciological method
3.1.1 Annual mass-balance measurements
The only known direct observation of the annual mass balance of Aldegondabreen in the 20th century was carried out in 1975/76 (Guskov and Gordeychik, Reference Guskov and Gordeychik1978). At the beginning of 21st century, the Institute of Geography (Russian Academy of Science) made an attempt to establish regular annual mass-balance monitoring which lasted 5 years (Mavlyudov and Solovyanova, Reference Mavlyudov and Solovyanova2007; Solovyanova and Mavlyudov, Reference Solovyanova and Mavlyudov2007). Unfortunately, only glacier-wide results without any point-scale data were reported. No sources of additional data for computation such as the area–altitude distribution were mentioned. Thus, the reported values are used as is, without any reprocessing.
The Arctic and Antarctic Research Institute (AARI, Saint Petersburg, Russia) started regular direct mass-balance observations in 2007/08. The first ablation stake network consists of 18 stakes and was used for 3 mass-balance years until 2009/10 (Fig. 1b), after which a gap in observation occurred. The observations resumed in September 2013 and since then, a new ablation stake network with 14 stakes has been used (Fig. 1b) and preserved from year to year. The ablation stake network is well distributed around the glacier surface, covering the entire elevation range except for the inaccessible part in the south (stake locations are presented in Tables A1 and A2 in the Supplementary material). The wooden stakes are inserted up to 2.5 m into the ice using a hand-powered ice auger drill. Annual mass-balance values are computed on a floating-date basis (September–September). Typically, the researchers take readings and perform re-drilling from the beginning of July to mid-September when ice ablation occurs. The revisit time during the melt season varies significantly from year to year, from a week to ~50 d. While taking a stake reading, only ice ablation is measured, hence no chronological information on snow ablation is available.
To inter- and extrapolate from a point to glacier-wide mass-balance values, the conventional profile method with a linear fit is applied, using 50 m elevation bins. For this, Eqn (1) is used:

where ρ is the ice density assumed to be 850 ± 60 kg m−3 as proposed by Huss (Reference Huss2013), b z is the bin-averaged mass-balance value in ice equivalent units and w z denotes the dimensionless ratio of the z-th elevation bin area in the total glacier area. To define these ratios for 2008, 2013 and 2018, three area–altitude distributions (AADs) are used, represented by three consecutive glacier surface DEMs: S0 Terrengmodell fragment (2008), ArcticDEM strip (2013) and our topographic survey results from 2018. For the years in between, each w z is interpolated linearly from the nearest AADs.
3.1.2 Seasonal mass-balance values
Since 2002, regular snow measurements have been carried out on Aldegondabreen annually, i.e. in April, with the only gap in data appearing in the spring of 2013. Details on the fieldwork and available data are summarized in Table 1. The unification and preservation of the overall schema of the fieldwork has only been carried out since April 2007, hence the results of the first 5 years are almost impossible to homogenize. For example, the 2003 survey was based on the two transects made across the glacier, in contrast to all the other spatial surveys. Consequently, the 2006 survey programme was significantly affected and snow thickness measurements were only made inside several pits; coordinates and even the layout of sampling points during the 2001/02 and 2004/05 period are unknown.
Data description for snow surveys on Aldegondabreen

The latter surveys consist of several dozen snow thickness measurement points (the typical number is ~40), arranged in a quasi-regular grid (Fig. B1 in the Supplementary material); the thickness is measured using an avalanche probe. At some points, snow pits are dug (typically nine) to determine the structure of the snow cover and to determine the bulk density of the snow cover.
The coordinates of the snow thickness sampling points have not been preserved for all surveys conducted before 2016, hence interpolating values to compute a glacier-averaged value from a grid is impossible. Therefore, in order to maintain homogeneity, the glacier-averaged snow thickness is assumed to be the arithmetic average of all the thickness measurements for the given year. The same is performed for density measurements in the pits, i.e. an average between all the pits for a certain year is assumed to be a glacier-mean one.
The summer mass balance is defined as the difference between the annual and winter mass-balance values.
3.2 Geodetic mass-balance and surface velocity measurements on Aldegondabreen glacier
Three DEMs, representing the years 2008, 2013 and 2018, are available for Aldegondabreen, allowing for the calculation of the geodetic mass balances for two pentadal time spans. The DEM (which is of 5 m spatial resolution) for 2008 is a part of the S0 Terrengmodell dataset (Norwegian Polar Institute, 2014), which is derived from aerial photography. The precise date of the aerial survey from which the S0 Terrengmodell fragment was developed is unknown; from the dataset description, the aerial survey had been carried out in the second half of July 2008. The DEM for 2013 is a ‘strip’ of ArcticDEM of 2 m resolution (Porter and others, Reference Porter2018), which is based on WorldView-2 cloudless imagery taken on 17 August 2013. The DEM for 2018 is derived from the results of the ground-based survey, which was conducted by the authors of this paper. This survey was carried out on 7–8 August 2018 using the kinematic GNSS technique with post-processing, as well as Sokkia GRX1 and GRX2 receivers (the routes and coverage are shown in Fig. C3 in the Supplementary material). Excluding all the measurements with vertical precision lower than 5 cm, the rest was interpolated using the Thin Plate Spline algorithm, implemented in the open-source ‘SAGA GIS’.
All three DEMs do not contain data gaps on the glacier surface, hence preliminary interpolation of missing data was not necessary. Initially, the ‘demcoreg’ package for the Python language (Shean and others, Reference Shean2016), implementing a co-registration technique proposed by Nuth and Kaab (Reference Nuth and Kääb2011), was used, with S0 Terrengmodell as a reference DEM. The co-registration procedure only involves the pixels on stable ground, which rendered it useless for the 2018 DEM as it only covers glaciated surfaces. Thus, several GNSS profiles outside the glacier were used to perform the vertical adjustment by subtracting the median absolute deviation of the profiles from all the DEM pixels.
The geodetic mass balance is defined as the product of area-averaged surface lowering and glacier density. The area-averaged surface lowering is computed by dividing a glacier volume change, ΔV by its area at the beginning of the differencing time span. A simple equation of the volume change (Eqn (2)) can be given by (Zemp and others, Reference Zemp2013)

where r is the pixel size, k is the number of pixels involved in the volume change computation and Δhk is the elevation change in the corresponding pixels of the differenced DEM.
Annual surface ice flow velocity is measured (done only once between 8 August 2018 and 1 August 2019) by determining the displacement of 14 ablation stakes. The same DGPS equipment was used to perform static surveys at every stake.
3.3 Reconstruction of surface mass-balance for missing years
Mean summer air temperatures, annual positive degree-day (PDD) sums and solid atmospheric precipitation amounts were computed based on mean daily values from the Barentsburg weather station, which were downloaded from the website ‘meteo.ru’ run by the Research Institute of Hydrometeorological Information – World Data Center (Obninsk, Russia). The research team used a sum of daily precipitation amounts as an approximation of solid precipitation for the days with a negative mean daily temperature at the Barentsburg weather station from October to April, which are the months with a negative mean temperature that precede the snow surveys typically carried out in late April.
Based on the relationship between PDD and solid precipitation, an empirical model which relates the B a of Aldegondabreen to the main meteorological parameters recorded at the Barentsburg weather station can be implemented. Since the air temperature and precipitation amounts are the most available series throughout all historical observations on Svalbard, no other variables are added. The linear regression model with two predictors (Eqn (3)) will be given by

where PDD is the annual positive degree-day amount, P solid is the sum of daily precipitation amounts for the days with a negative daily mean temperature, k 1 is the widely known degree-day factor (Ohmura, Reference Ohmura2001; Hock, Reference Hock2005) and k 2 is assumed to be the precipitation scaling factor.
4. Uncertainty assessment of surface mass-balance measurements
4.1 Glaciological method
4.1.1 Annual mass balance
The authors emulate Galos and others (Reference Galos2017) in the uncertainty assessment of the annual mass-balance values by accounting for various uncertainties. As seen from Eqn (1), there are three components to computing the glacier-averaged mass balance using the profile method: the glacier ice density, dimensionless weights wz of every z-th elevation bin and their mean mass balances bz.
The ice density has never been measured in situ on Aldegondabreen. An uncertainty of ±60 kg m−3, proposed by Huss (Reference Huss2013) and appropriate for a wide range of conditions, is attributed to every elevation bin and may be introduced as below:

where B and σ B are the glacier-averaged mass balance and its uncertainty, respectively, in the units of an ice equivalent. To assess the uncertainty σ B, the following equation is applied:

where $\sigma _{w_z}$ is the uncertainty of the weight of z-th elevation bin, and $\sigma _{b_z}$
 is the uncertainty of the mean mass balance of every z-th bin. The value of $\sigma _{w_z}$
 was assumed to be no more than 0.01 (1% of the total glacier surface); the value of $\sigma _{b_z}$
 accounts for the two major sources of error: limited stake representativeness and extra- and interpolation errors.
The first source of error, i.e. the limited representativeness of a point measurement, stems from the fact that the altitude is not the only predictor for the ice melt. Some local factors such as changes in albedo, which is known to vary significantly in space, are not driven by altitude and may lead to a variability of the point mass balance in either direction. It is not possible to estimate these local effects directly, but surface roughness (the height of the surface features at the end of summer) can be used as an approximation (Galos and others, Reference Galos2017). While performing the topographic survey in 2018, the research team measured 30 extra points between the survey routes which were not used in the DEM construction. Then, the elevations of these points were compared with the corresponding pixels of the obtained DEM. The RMS deviation was found to be 0.30 m, and this value was assumed to be the first uncertainty component, σ repr, equal for all mass-balance years and elevation bins. The second error of source is related to the shape of the curve used to approximate the vertical mass-balance profile. For every z-th bin, an RMSE of the linear fit relative to the measured values, RMSE z, was computed. Then, the two errors are combined into $\sigma _{b_z}$ using:

Finally, from Eqns (4–6), the uncertainty values of 0.14–0.25 m w.e. were obtained, which are typical of the mass-balance studies performed by the direct method as shown in an overview by Klug and others (Reference Klug2018). For results published prior to 2007/08, there are no field data, hence using the proposed schema to conduct the uncertainty is impossible; the largest computed uncertainty value is attributed to them.
4.1.2 Seasonal mass balances
The total uncertainty of a winter mass balance is determined by estimating its two components, i.e. the uncertainty of the snow thickness and of the bulk density, and then combining them.
The glacier-wide snow thickness is computed through arithmetically averaging the measurements, which disqualifies inter- and extrapolation as a source of error. Therefore, it can be assumed that there are two major contributors to the uncertainty of thickness: the point-scale error of a single measurement (due to e.g. probe tilt) and the positioning of the sampling points over the glacier surface; the improved bootstrap method is used to estimate both values at once. Firstly, the research team produced two reference grids by interpolating snow thickness for the years with the least and thickest snow cover as well as the largest amount of sampling points (2016 and 2018). Secondly, both grids are ‘sampled’ with a certain number of points 1000 times and a random error (following a normal distribution) is applied to every point, effectively simulating the error on the point scale; the RMS of this error is assumed to be no more than 2 cm. Between every trial, each point is shifted randomly with an amplitude that preserves a more or less regular network. This is done to prevent sampling only a small part of a glacier, which does not happen during real snow surveys. The test is performed for different sampling points between their minimum and maximum amounts in real snow surveys (19 and 86) to obtain the empirical curve of the RMS error against the number of sampling points (Fig. B2 in the Supplementary material). This error is applied to the thickness measurements that correspond to the number of sampling points this year.
For most of the mass-balance years, the most straightforward option is used to assess the uncertainty of the glacier-wide snow density. It is assumed that the uncertainty is equal to the RMS deviation of all the pit measurements taken within a 1-year survey period. However, this will result in an unreliably small value for the years with <9 pits dug, e.g. in 2020, when only two pits with very similar bulk densities were dug due to a reduced field programme. Thus, in 2004/05, 2006/07, 2011/12 and 2019/20, the density uncertainty is assumed to be equal to the maximum uncertainty in the observational series, i.e. 63 kg m−3.
The uncertainty of the summer mass balance is propagated from the uncertainties of the annual and winter balances of the corresponding year.
4.2 Geodetic method
The variance of volume change, based on the rules of uncertainty propagation, will equal:

σ Δh for both time spans was assumed to be the RMS deviation of ground control points, located around Aldegondabreen on a quasi-stable terrain. The estimated values of σ Δh are 0.89 m for 2008–13 and 0.31 m for 2013–018.
The second step is to compute the uncertainty for the area-averaged surface lowering A by propagating the earlier found σ ΔV with the error of the glacier area σ S:

which provides values of 0.06 and 0.07 m. The uncertainties of the glacier area σ S were defined as the std dev. of the multiple manual digitizations from independent analysts, as proposed by Paul and others (Reference Paul2013).
Finally, after combining these results with the uncertainty of the assumed glacier density, using the below equation:

the total uncertainty values for the near-pentad geodetic mass balance B of 0.32 m w.e. (2008–13) and 0.44 m w.e. (2013–18) are obtained.
4.3 Annual ice velocity
The observation time for every stake was varied between 20 and 60 min depending on the available number of satellites and their configuration in the sky; this was done to provide a more accurate uncertainty value than ±0.05 m for the horizontal component. However, difficulties encountered while centring above the hole in which the stake was set-up led to an increase in the error in the horizontal plane. Hence, the final accuracy of every stake displacement is estimated to be ±0.10 m.
5. Results
5.1 Glaciological mass balance
During the monitoring programme of 2002–20, measured annual mass balance of Aldegondabreen was always negative, ranging between −0.24 ± 0.14 m w.e. (2009/10) and −2.19 ± 0.24 m w.e. in 2019/20 (Table 2). Point annual mass-balance values (measured at the stakes) are presented in Tables A3 and A4 in the Supplementary material. Presented mass-balance gradients and equilibrium-line altitudes (ELAs) were deduced from a linear fit of vertical mass-balance profiles.
Glacier-wide mass-balance values for Aldegondabreen
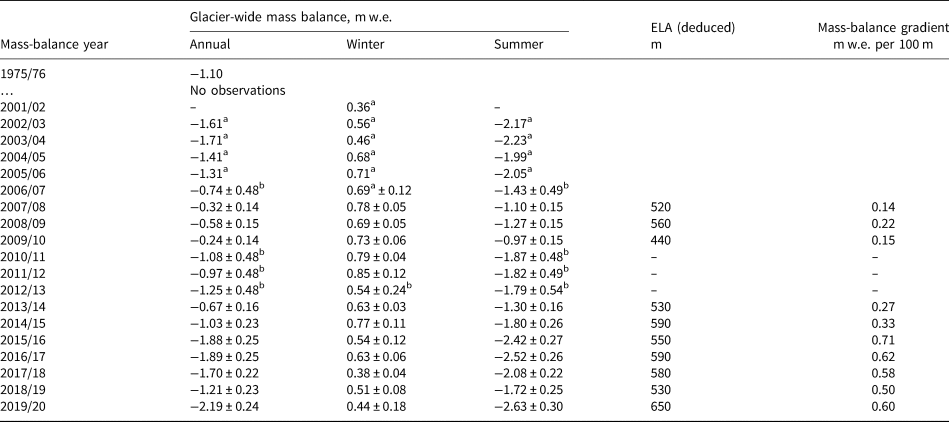
a Not homogenised values, shown as reported in Mavlyudov and Solovyanova (Reference Mavlyudov and Solovyanova2007) and Solovyanova and Mavlyudov (Reference Solovyanova and Mavlyudov2007).
b Reconstructed values.
The snow survey results are summarized in Table 3. Some of the presented values, marked in Table 3, are deduced from the two known variables for the same year, i.e. the area-averaged snow thickness for 2010/11 and 2013/14 and the area-averaged bulk snow density for 2004/05.
Snow survey results for Aldegondabreen

a Deduced from the winter mass balance, as the source data are now lost.
b Uncertainty assumed equal to max historical value.
The winter mass-balance values vary between 0.36 and 0.85 m w.e. (2001/02 and 2011/12, respectively). A maximum area-averaged snow thickness of 2.00 m was observed during the spring of 2008. The minimum observed mean snow thickness value of 1.08 m corresponds to the spring of 2018. The extreme values of snow density are 294 ± 63 (2015/16) and 467 ± 39 kg m−3 (2005/06). Examples of snow thickness and density maps are shown in Figure B3 of the Supplementary material.
The reconstructed B a values for 2010/11–2012/13 (i.e. when stake measurements were not performed) and B w values for 2012/13 were computed using Eqn (3) and are presented in Table 2. The coefficients for the equation, which were empirically obtained from the observation sample of ten reported mass-balance years, are: k 1 = −2.8 mm w.e. per degree × day and k 2 = 2.05. These regression parameters were adjusted to minimize the RMS errors of both B a and B w. The resulting model is significant at the 0.01 level and has a determination coefficient of R 2 = 0.91. According to the model, even the highest observed amount of solid precipitation is about two times less than needed for Aldegondabreen to obtain equilibrium.
5.2 Geodetic mass balance and annual surface velocity
As observed from the analysis of the three consecutive DEMs (Fig. 3c), the AAD of Aldegondabreen decreases gradually. The most prominent changes from 2008 to 2018 relate to the largest elevation bins of 300–350 and 250–300 m in the central part of the glacier; ~8% of the glacier surface was transferred from the higher bin to the lower bin.
Elevation changes of Aldegondabreen in 2008–13 (a) and 2013–18 (b), and decadal changes in the area–altitude distribution (c).

The spatial distribution of elevation changes of Aldegondabreen by two pentads is shown in Figure 3. The first grid (2008–13) seems to be more detailed, due to the latter (2013–18) being produced from sparser topographic survey results (the routes of the conducted GNSS survey are shown in Supplementary C). The overall elevation change pattern is preserved through time; glacier thinning increases from the southernmost, most elevated part to the terminus in the northeast. Although the point-scale surface elevation change is not identical to the point mass balance, the observed pattern is well in accordance with the assumed surface melting dependency from the altitude. The zero contour in the southern part between 2008 and 2013 is certainly not evidence of any accumulation happening, but rather shows the deformation of glacier ice at the steepest and highest parts in the south (Fig. 4b). The ice velocity measurements of 2018–19 confirm that this ice displacement is still occurring today. However, from 2013 to 2018, it was not able to compensate for the surface melt, as seen in Figure 3b.
(a) Surface glacier velocity measured on Aldegondabreen at the ablation stakes in August 2018–August 2019 and the glacier bed slope (derived from Borisik and others, Reference Borisik, Novikov, Glazovsky, Lavrentiev and Verkulich2021); and (b) Aldegondabreen cross section and the surface velocities.

The observed annual surface ice velocities are shown in Figure 4 (the values are listed in Table C2 in the Supplementary material). The northern side of Aldegondabreen is flatter and can be assumed to be non-moving (or, at least, moving slower than 10 cm a−1, which is the estimated uncertainty of the measured displacements). The maximum ice flow speed was observed closer to the southernmost (and the most elevated) part of the glacier. The highest southern part of the glacier, located on a steep slope, is being deformed; the maximum stake velocity is observed here, at the foot of this steepest part (Fig. 4b). In the lower part of the glacier, the flow diverges because of the emerging bedrock riegel, which has been exposed since 2008. Since the annual flow rate on Aldegondabreen is very low, the changes in the surface elevation reflect the annual mass balance of the glacier.
6. Discussion
6.1 Cumulative mass loss
The cumulative glaciological mass balance of Aldegondabreen since the beginning of monitoring in September 2002 (including both measured and reconstructed values) is −21.79 m w.e., which corresponds to the mass loss of 129.6 million tonnes. Assuming a total glacier volume of 0.278 km3 for 2018–19 from Borisik and others (Reference Borisik, Novikov, Glazovsky, Lavrentiev and Verkulich2021) and a constant glacier ice density of 850 ± 60 kg m−3, the relative mass loss of 37% in 18 mass-balance years can be calculated. This is comparable to the 36% of volume loss between 1999 and 2019, which was computed using the results of two GPR studies. These studies revealed that the glacier volume and the area both decreased from 0.437 to 0.278 km3 and from 6.94 to 5.34 km2 (or 23%) respectively (Borisik and others, Reference Borisik, Novikov, Glazovsky, Lavrentiev and Verkulich2021).
According to our observations, the accumulation zone of Aldegondabreen has disappeared by 2020. Taking into account that 99% of the glacier surface now lies below 500 m, it can be inferred that the corresponding accumulation–area ratios (AARs) for all the mass-balance years since the beginning of the monitoring were <0.01. In 2009/10, when the ELA was at its minimum elevation, the AAR still did not exceed 0.02 (Table 2). In 2019/20, the deduced ELA reached the uppermost glacier margin, which resulted in the AAR decreasing to zero. It is possible that some remnants of the firn layer are still present in the upper inaccessible parts of the glacier, the area of which is constrained by only several per cent of the total glacier surface. As a result of this, meltwater and liquid precipitation refreezing for the glacier are now negligible.
Several studies reported on the previous changes of Aldegondabreen, since the beginning of the 20th century. Using the elevation data obtained from aerial and satellite imagery, Holmlund (Reference Holmlund2021) calculated the geometry changes of Aldegondabreen from 1910 to 2016; and discovered that the glacier experienced a 79 ± 6% reduction in volume and a 50% reduction in length. The glacier was tidewater before the 1930s, and since then, it has retreated 2 km, changing its dynamics into a terrestrial-terminating one (Holmlund, Reference Holmlund2021). This is consistent with the warming on Svalbard following the end of the Little Ice Age (~AD 1900) and the general glacier recession trend observed in this region (Lovell and others, Reference Lovell2005).
The mean annual mass balance measured during our monitoring programme in 2002–20 was −1.21 m w.e., which is 1.7 times more negative than an estimate for the 1936–90 period of −0.7 m w.e. (Navarro and others, Reference Navarro2005). During the previous century, the rates of Aldegondabreen ice thinning were also likely to increase gradually (Holmlund, Reference Holmlund2021). This agrees with the climatic changes in the region; linear trends for air temperatures were +0.26°C decade−1 (annual) and +0.16°C decade−1 (summer) during the 20th century and have dramatically increased since 1971, with values of +0.81°C decade−1 (annual) and +0.33°C decade−1 (summer), then followed by an unprecedented warming in the beginning of the 21st century (Hanssen-Bauer and others, Reference Hanssen-Bauer2019; Isaksen and others, Reference Isaksen2022).
6.2 Interannual variability of the surface mass balance
Previous studies on the Svalbard glaciers showed that a large portion of the interannual mass-balance variability may be explained by the fluctuations of the main climatic variables: the mean summer temperature, the annual PDD sum and solid precipitation amounts (Hagen and Liestøl, Reference Hagen and Liestøl1990; Lefauconnier and Hagen, Reference Lefauconnier and Hagen1990). These findings are consistent with correlation tests conducted on Aldegondabreen.
The Pearson's coefficient obtained from B a and T 6–9 (the mean air temperatures from June to September, which are typically the months with a mean positive air temperature) is −0.81 (shown in Fig. 5a). Although this value is high, the corresponding coefficient obtained from B a and annual PDD sums is slightly higher (−0.84, Fig. 5b). The PDD is more suited to this calculation due to its larger variability; for example, both mass-balance years 2016/17 and 2018/19 were equal in terms of mean T 6–9 (+4.9°C), but differed in PDD amounts by ~10% (670 vs 610°C × day, respectively). The corresponding coefficient values are then computed for the homogenized record of ten mass-balance years of monitoring (since 2007/08). With the addition of published results from previous years, the correlation coefficients significantly decrease to −0.53 and −0.60 respectively. This can be attributed to a lack of homogenization, which cannot be carried out here due to the lack of source data in the early 21st century.
Relationship between meteorological parameters measured at the Barentsburg weather station (2002–20) and mass-balance values of Aldegondabreen (a, b, c) and between winter and annual mass balance of Aldegondabreen (d).

The correlation coefficient between B w and the solid precipitation, 0.79, is higher than previously reported values in Svalbard at 0.79 (Fig. 5c); however, this is only the case if the homogenized data after 2007 are used. Notably, Hagen and Liestøl (Reference Hagen and Liestøl1990) reported a correlation value of 0.63 that was obtained from the B w of Austre Brøggerbreen and the Ny-Ålesund winter precipitation. Soviet observations on the B w of Vøringbreen yielded a correlation coefficient value of −0.13 when computed using the September–May precipitation amounts at the Barentsburg weather station. This unusual value was explained by the brevity of the glaciological record (9 years from 1973/74 to 1981/82), which consequently increases the uncertainty of the correlation coefficient (Macheret and Zhuravlev, Reference Macheret and Zhuravlev1985). However, we suppose that daily sums, which were used for Aldegondabreen, are a much better approximation to the real solid precipitation when compared to monthly precipitation sums for the colder part of the year. Adding earlier data that were computed from a different fieldwork layout significantly decreases the correlation value to 0.48. This is evidence that a crucial factor in long-term monitoring is the preservation of continuity in the methods of both fieldwork and post-processing techniques, as stated in the study by Zemp and others (Reference Zemp2013).
The correlation coefficient obtained from B a and B w is 0.76 (Fig. 4d). This indirectly validates the dominant role of shortwave radiation in the energy budget of low-elevated glaciers, as shown in Arnold and others (Reference Arnold, Resvdes, Hodson and Kohler2006), Prokhorova and others (Reference Prokhorova, Terekhov, Ivanov and Demidov2023) and Zou and others (Reference Zou2021). Large amounts of snow accumulation during winter will cause the surface albedo from June to July to remain high for longer periods of time. Therefore, the extremely negative annual mass-balance value of 2019/20 can not only be attributed to the warmest summer, but also to the low winter snow accumulation; if the broad uncertainty band of the snow survey is considered, this value may be the lowest in the series (Table 2).
The relationship between the snow thickness, snow density and the altitude above sea level was not considered when computing the winter mass balance. Snow thickness at a certain point tends to increase with elevation for most winters, but this correlation is moderate; depth-averaged snow density has an even weaker correlation with snow thickness. Moreover, the coefficients change their sign in some years; in 2006/07, snow density decreased with altitude (Table 4). This shows a lack of reliable dependency of B w from the altitude.
Linear correlation coefficients between main snow cover properties and morphometric variables on Aldegondabreen in 2003/04–2020/21
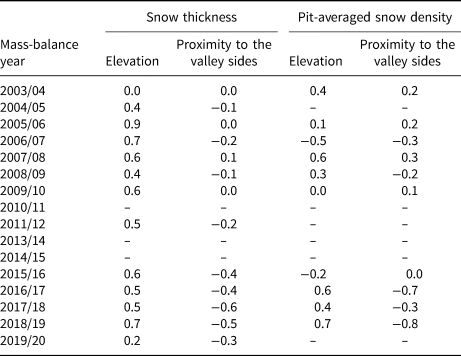
Missing values are caused by a loss of the point data or a small sample size.
Another topographic variable that was tested for correlation with the main snow cover properties is the distance to the valley sides. A tangible correlation was expected because the ridges contouring the glacier have the potential to influence the snow accumulation process through avalanches, wind shadowing and other wind effects (Dadic and others, Reference Dadic, Mott, Lehning and Burlando2010). The analysis showed that a strong correlation existed in certain years, but the years before 2013 yielded near-zero coefficients (Table 4).
6.3 Reliability of the reconstruction of surface mass balance for missing years
A regression model intended for the reconstruction of missing values (Eqn (3)) was developed based on simple linear relationships with climatic variables; these relationships were confirmed empirically. The 95% prediction band of the proposed model yielded a value of ±0.49 m w.e. for B a, which is about two to three times the estimated uncertainty of the measured values (Table 2). An analysis of the differences between reconstructed and measured values also revealed that the regression tends to overestimate the absolute values for less negative values of B a; it also tends to underestimate the absolute values for the most negative values of B a (Fig. 6). This is a clear source of systematic error in the presented series. Therefore, it is important to check the possible bias using another independent method of mass-balance computation, i.e. geodetic mass-balance computation.
Scatterplot for measured and reconstructed annual mass-balance values for Aldegondabreen in 2007/08–2019/20.

A comparison between cumulative values obtained by both direct and geodetic methods for 2008–13 and 2013–18 is shown in Table 5. The latter differencing interval spans only the measured values, while the first includes the reconstructed ones. The precise date of the 2008 DEM dataset is unknown; visual analysis of the corresponding orthoimage from the same dataset reveals that a snowline was still in recession in the lower part of Aldegondabreen and ice ablation was only occurring on the smaller part of the glacier. Thus, the DEM may be attributed to the very start of the mass-balance year, which coincides with the beginning of the direct measurement interval. The subsequent comparison between the results of the two methods proves the absence of any systematic error in the time series of B a from 2007 to 2018.
Comparison of cumulative mass balances of Aldegondabreen measured by two methods
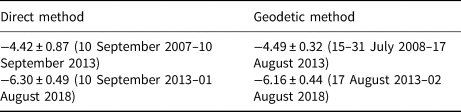
The uncertainties in cumulative geodetic mass-balance values are large relative to the measured values, i.e. 7% for both time spans. This prevents the use of a glaciological reanalysis within the framework proposed by Zemp and others (Reference Zemp2013). It can be concluded that the time spans for geodetic differencing should be longer (e.g. a decade instead of pentad) and the quality of DEM co-registration should be higher. The latter may be achieved by using an uncrewed aerial vehicle to conduct aerial surveys with GNSS equipment on board, which allows differential kinematic positioning that provides a co-registration precision of several centimetres, as shown in Florinsky and Bliakharskii (Reference Florinsky and Bliakharskii2019).
6.4 Trends and periodicity of B a and B w
There are two major reasons as to why a negative trend should be present in the mass-balance series of Aldegondabreen. Firstly, the glacier surface has been lowering since at least the beginning of 21st century, as seen from the presented AADs (Fig. 3c). Secondly, the air temperature during the summer, which drives glacier melt, shows a positive trend in Svalbard, especially over the western coast where the study site is located (Isaksen and others, Reference Isaksen2022). However, it is not possible to detect any significant trend in the presented time series of B a and B w using both parametric and non-parametric criteria; the trend is insignificant, even at the 10% level. This can be attributed to a period with a high B w and not very negative B a between 2005 and 2013 (number 2 in Fig. 7). This interrupted the intensive mass loss occurred before 2005 and after 2013 (periods 1 and 3 in Fig. 7). The same periodicity was observed for the other glaciers in the Svalbard archipelago.
Annual and winter mass-balance values for Aldegondabreen in 2001/02–2019/20. The numbers 1, 2 and 3 stand for three periods of different atmospheric circulation patterns.

An analysis of remote-sensing data showed a significant increase in the mass loss of Svalbard glaciers in the beginning of the 21st century. Bamber and others (Reference Bamber, Krabill, Raper, Dowdeswell and Oerlemans2005) compared the two lidar surveys from 1996 and 2002 and showed that the mean mass balance of the glaciers during this time span was −0.19 m w.e. a−1, which is significantly less than that in the previous 30 years. From 2003 to 2005, glacier thinning became four times more intensive relative to the period of 1936–62, which was the earliest that geodetic differencing was available on Svalbard (Kohler and others, Reference Kohler2007). The very negative B a values were also observed for Vestre Grønfjordbreen and Vøringbreen (in the Barentsburg area) using the direct method (Solovyanova and Mavlyudov, Reference Solovyanova and Mavlyudov2007). Then, a period with the significantly less negative mass balance followed: based on the gravimetric data of the GRACE satellite mission, Wouters and others (Reference Wouters, Gardner and Moholdt2019) showed that from 2005 to 2012, the overall mass loss of Svalbard fell to zero.
The observed period of the increased mass balance (‘2’ in Fig. 7) was also extended to the other glaciers in the vicinity of Barentsburg. The geodetic mass balance of the Austre Dahlfonna glacier, located 6 km south of Aldegondabreen, was less negative in 2008–13 than in 2013–18 (−5.22 ± 0.37 and −6.83 ± 0.48 m w.e., respectively; Terekhov and others, Reference Terekhov, Prokhorova, Borisik, Demidov and Verkulich2022). Elagina and others (Reference Elagina2021) reported that the geodetic mass balance of Austre Grønfjordbreen was −0.97 m w.e. from 2008 to 2013 and was notably more negative, −1.45 m w.e., from 2013 to 2017.
Lang and others (Reference Lang, Fettweis and Erpicum2015) proposed an explanation for the observed decadal mass-balance variability of the archipelago. The study, based on the results of the regional-scale climatic model forced by the ERA Interim reanalysis, detailed the shifts in atmospheric circulation since the beginning of the 21st century. Before 2005, a south-south-westerly flow prevailed over Svalbard. From 2005 to 2012, a change in circulation brought summer north-westerly flows over the archipelago, reducing the effects of the Arctic warming. In 2013, the atmospheric circulation reverted back to a south-south-westerly flow, causing an even more intense melt than the one that occurred before 2005.
The mass balance of Aldegondabreen from 2002 to 2020 reflects the regional-scale patterns of atmospheric circulation over Svalbard, being consistent both with the decadal periodicity of atmospheric processes proposed by Lang and others (Reference Lang, Fettweis and Erpicum2015) and with observed mass-balance patterns of the other glaciers on the archipelago. This implies that in a time frame of 5–10 years, local factors influencing the Svalbard glacier mass balance are being outweighed by regional-scale factors. Therefore, it can be concluded that the Aldegondabreen mass-balance series can be used as a representative for Svalbard.
7. Conclusions
This study summarizes the result of two decades of ongoing mass-balance observations on the Aldegondabreen glacier in the vicinity of Barentsburg. The annual mass balance of Aldegondabreen in 2002–20 was negative, resulting in 21.79 m w.e. of cumulative mass loss. The reported series is now the longest in the central part of Spitsbergen Island; it follows the conventional floating-date mass-balance date system, includes the seasonal values and the uncertainty assessment.
By 2020, the accumulation zone of Aldegondabreen, which is low-elevated compared even to the other Svalbard glaciers, had disappeared. While the overall hypsometry of Svalbard glaciation has a marked peak at ~450 m above sea level, coinciding roughly with the current snowline of the archipelago (Noël and others, Reference Noël2020), ~98% of Aldegondabreen surface lays nowadays below this altitude.
The analysis of the relationships between mass-balance and meteorological values shows that current snow accumulation is at least two times lower than needed to compensate for the summer melt. This led to a 37% in glacier volume reduction from 2002 to 2020 and a mean B a of −1.21 m w.e., which is 1.7 times more negative than the corresponding value for the 1936–90 period.
The linear relationships between B w and solid precipitation and between B a and PDD at the Barentsburg weather station are strong. Moreover, a strong correlation (r = 0.76) also exists between B w and B a, which is consistent with studies highlighting the dominant role of shortwave radiation in the surface energy balance. The low-elevated Svalbard glaciers in the central part of Spitsbergen Island are highly sensitive to the changes in solid precipitation, which amplifies the summer melt through albedo feedback.
The decadal periodicity of Aldegondabreen annual and winter mass balance is overall consistent with regional mass-balance patterns, being controlled to a greater extent by the regimes of atmospheric circulation over Svalbard. Therefore, Aldegondabreen mass-balance series may be treated as representative for the entire archipelago.
Supplementary material
The supplementary material for this article can be found at https://doi.org/10.1017/aog.2023.40
Acknowledgements
This study was funded by Project 5.1.4 ‘Monitoring of State and Pollution of the Environment, Including the Cryosphere, in the Arctic Basin and in the Area of Scientific Station Ice Base Cape Baranov, Hydrometeorological Observatory of Tiksi and Russian Scientific Centre on Spitsbergen’, within the Plan NITR of Roshydromet 2020–24. The authors are grateful to the Russian Arctic Expedition on Svalbard (Arctic and Antarctic Research Institute, Saint Petersburg, Russia) for assisting with logistics, providing necessary equipment and offering assistance in the field. The ArcticDEM strip used in the study was provided by the Polar Geospatial Center under NSF-OPP awards 1043681, 1559691 and 1542736.
Author contributions
S. V. and M. A. conceptualised and supervised this study. O. S. provided the data and metadata of the glaciological method. K. R. provided the data and metadata of the snow surveys. V. D. and A. T. carried out a topographic survey and provided its results. A. T. homogenised the data, computed geodetic mass balance and made the uncertainty estimation. U. P. tested the relationship of mass-balance values with the climatic variables, carried out the reconstruction of missing data and analysed the snow survey data. A. T. and U. P. wrote the original draft of the manuscript and produced the figures. All authors contributed to manuscript review and editing.
Conflict of interest
The authors declare that they have no conflict of interest.


 Open access