


Dietary guidelines are developed to inform the population about healthy food consumption. They are based on evidence that is obtained for a representative selection of population and directed at the population as a whole. However, it can be argued that personalised dietary recommendations should be available because of the variation within the population. Personalised recommendations may be perceived as more relevant and have stronger motivational effects because these can account for an individual’s preferences, requirements, needs, beliefs, etc.( Reference Brug, Campbell and van Assema 1 ).
Previous diet optimisation studies have explored personalised guidelines by modelling personalised intake recommendations that deviate as little as possible from observed intake levels, while fulfilling several health-related criteria on nutrient and contaminant recommendations, energy intake and/or intake weight( Reference Persson, Fagt and Pires 2 – Reference Maillot, Vieux and Ferguson 4 ). The arguments for minimising the deviation from individual intake were that such recommendations will be more relevant, realistic and achievable for consumers, and therefore a higher compliance with the recommendation could be expected.
An example of a national dietary guideline is the recommendation for fish intake in Denmark, which states that the Danes should eat 350 g of fish per week, of which 200 g should be fatty fish( Reference Tetens, Andersen and Astrup 5 ). This guideline is directed at the healthy population over 3 years of age. As a step towards developing personalised guidelines, we previously modelled individual fish intake recommendations for eight species of fish for 3016 Danes, using mathematical optimisation methods, and found that 74% of the study population should be advised to increase their fish consumption( Reference Persson, Fagt and Pires 2 ). The modelled intakes fulfilled constraints on EPA, DHA, vitamin D, methyl mercury, dioxins and dioxin-like polychlorinated biphenyls (dl-PCB), as these nutrients and contaminants are the main contributors of beneficial and adverse health effects from fish consumption( 6 ).
Most nutrients and contaminants present in a specific food (such as fish) can be provided by background exposure as well, which can impact the critical intake levels of the food product considered. When optimising the intake of one specific food, the background exposure to nutrients and contaminants that can be found in the food product in question needs to be considered. While previous studies( Reference Persson, Fagt and Pires 2 , Reference Sirot, Leblanc and Margaritis 7 ) estimated average background exposure values for the whole population, background exposures will also vary between individuals and may therefore have a different impact for different consumers. The objective of this study was to analyse the effect of including individual variation in background exposure when modelling personalised dietary recommendations for fish. It is primarily a methodological study, in which fish consumption is used to demonstrate the potential of the method.
Methods
Data
Observed intakes and body weights
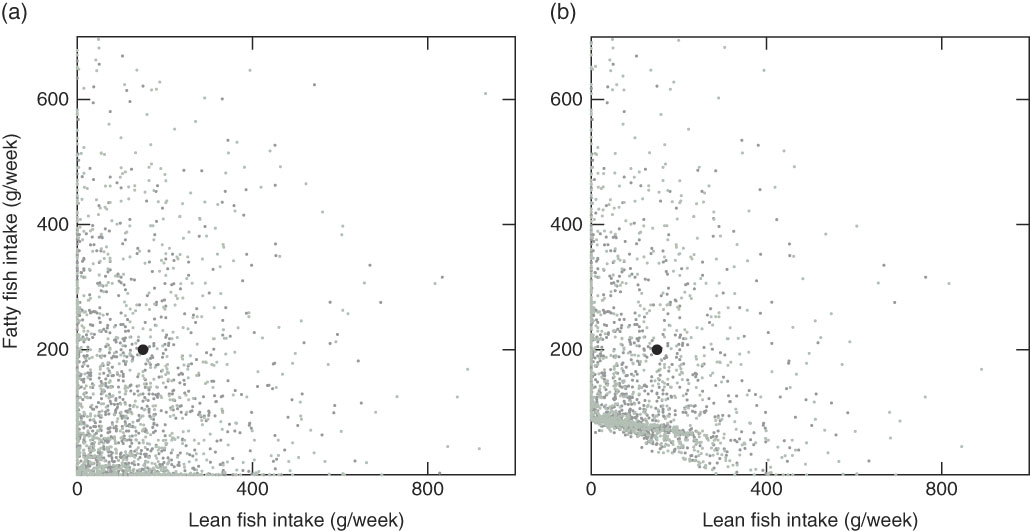
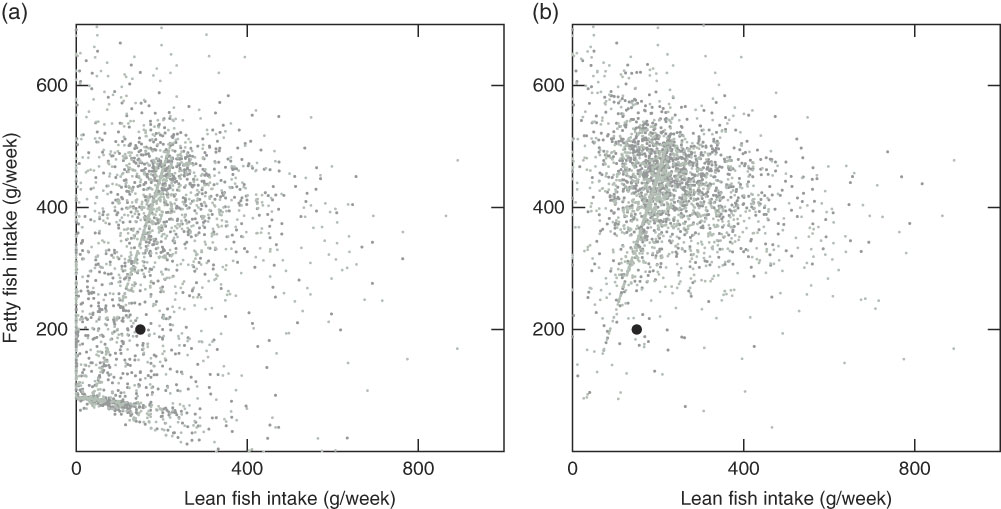
Observed individual food intake (7-d estimated records) along with self-reported body weight from the Danish national survey of diet and physical activity (DANSDA) (AN Pedersen et al., unpublished results, April 2011–August/September 2013) were used. Individuals aged 18–75 years (1552 women and 1464 men; a total of 3016 individuals) defined our study population. In total, 433 foods were reported and seventeen were defined as fish in this study. Raw, smoked, canned and marinated fish were included. The fish consumed corresponded to eleven species of fish (Table 1), denoting the elements of the optimisation variable (d=11). The observed fish intake was not normally distributed, according to the Lilliefors test at significance level 5%. Species with fat content up to 5% were classified as lean fish (six species) and species with fat content higher than 5% were classified as fatty fish (five species)( 6 ). See the observed intake amounts of lean and fatty fish in Fig. 1(a). Fish roe and fish liver were not included. The average daily intake was converted to average weekly intake by multiplying the average daily intake by seven. As eel is considered critically endangered; marketing and consumption of European eel is debated, and therefore it was excluded from this study. Individual body weights are required in the model since the limit values for the contaminants are body-weight dependent. There were forty-seven missing recorded values (for sixteen men and thirty-one women) for body weight in DANSDA. For these individuals, the sex-specific average body weight of an individual in the study population was used: 69·7 kg for women and 84·4 kg for men.
Observed intake of lean and fatty fish for 3016 individuals (1552 women and 1464 men) (a) and modelled recommended fish intake for 2992 of the individuals with the Mid-season scenario with individual intake of other foods and individual intake of supplements (Mid-season Ind scenario) (b). ![]() , Guideline;
, Guideline; ![]() , women;
, women; ![]() , men.
, men.
Observed fish intake* (Mean values and standard deviations; medians and interquartile ranges (IQR))

n r, number of individuals with reported intake; smo, smoked; mar, marinated; DANSDA, Danish national survey of diet and physical activity.
* Reported fish intake data from DANSDA. Study population: 3016 individuals aged 18–75 years.
Concentrations
Nutrient concentration data (EPA, DHA and vitamin D) were from the Danish food composition database( 8 ), and contaminant concentration data (mercury and dioxins+dl-PCB) were from two different chemical contaminant reports( 9 , 10 ). The weighted averages of the nutrient and contaminant concentrations for the eleven species were calculated with weights equal to the reported intake amounts of the categories raw, smoked, canned and marinated. The weighted averages of the two contaminant reports were calculated with the number of samples per report serving as weights. To get concentrations for methyl mercury, we used the same conservative approach as used by European Food Safety Authority( 11 ): 100% of mercury in fish was considered as methyl mercury, and methyl mercury comprised 80% of the total mercury in seafood other than fish. For three lean fish species (European flounder, garfish and saithe), data on one or more nutrient or contaminant were missing. European flounder is in the same family as plaice and therefore the data on plaice was used when a value was missing (methyl mercury). Saithe is in the same family as cod, and data on cod was used accordingly (EPA+DHA and dioxins+dl-PCB). Garfish is not in the same family as any of the other species included in this study. For garfish, the average value of the lean species was used when a value was missing (methyl mercury). The concentrations used in this study are presented in Table 2.
Limit values
The recommended daily intake for EPA+DHA( 12 ) and vitamin D( 13 ), and the tolerable weekly intake per body weight for methyl mercury( 11 ) and dioxins+dl-PCB( 14 ), were used as limit values (Table 3). These recommendations are for total intake and exposure, and therefore background intake and exposure had to be subtracted from them in the model. Daily values were converted to weekly values by multiplying daily recommendations by seven, and per-body-weight values were converted to individual values by multiplication with individual body weight. For vitamin D, there is an upper level of 100 µg/d( 15 ), but it was neglected because the contaminant constraints were limiting the fish intake amount long before this value could be reached.
Recommendations for nutrients and contaminants

BW, body weight; dl-PCB, dioxin-like polychlorinated biphenyls; TEQ, toxic equivalency.
Model overview
The quadratic programming model( Reference Persson, Fagt and Pires 2 ) is expressed as:
 $$ \mathop{{{\rm minimise }}}\limits_{{\bf x}} ||{\bf x}{\minus}{\bf x}_{{{\bf obs}}}|| _{2} $$
 $${\rm subject\,\,to\,\,}{\bf Bx}\geq {\bf b}$$
 $$\qquad \qquad \ {\rm }{\bf Rx}\leq {\bf r}$$
 $$\qquad \quad \ \qquad {\rm }{\bf x}\geq 0{\rm }$$
where the vector ${\bf x}$
(d×1) is the optimisation variable representing weekly intake amounts of d different fish species, and the vector
${\bf x}$
(d×1) is the optimisation variable representing weekly intake amounts of d different fish species, and the vector ${\bf x}_{{{\bf obs}}} $
(d×1) is a constant vector describing the corresponding observed intake amounts of an individual. The optimisation variable denotes eleven species of fish reported in the intake data (d=11). The objective function (a) of the model is the
${\bf x}_{{{\bf obs}}} $
(d×1) is a constant vector describing the corresponding observed intake amounts of an individual. The optimisation variable denotes eleven species of fish reported in the intake data (d=11). The objective function (a) of the model is the $L_{2} $
-norm of
$L_{2} $
-norm of ${\bf x}{\minus}{\bf x}_{{{\bf obs}}} $
:
${\bf x}{\minus}{\bf x}_{{{\bf obs}}} $
:
 $${||\bf x}{\minus}{\bf x}_{{{\bf obs}}}|| _{2} {\equals} \sqrt {\left| {x_{1} {\minus}x_{{{\rm obs},1}} } \right|^{2} {\plus}{\rm }\left| {x_{2} {\minus}x_{{{\rm obs},2}} } \right|^{2} {\plus} \cdots {\plus}\left| {x_{n} {\minus}x_{{{\rm obs},d}} } \right|^{2} } $$
The objective function is minimised, and hence the sum of the square of the deviations between the individual observed intake ${\bf x}_{{{\bf obs}}} $
(from individual intake data) and the optimised (by the model) intake
${\bf x}_{{{\bf obs}}} $
(from individual intake data) and the optimised (by the model) intake ${\bf x}$
is minimised. Personal objective functions are thereby defined by the personal intake amounts
${\bf x}$
is minimised. Personal objective functions are thereby defined by the personal intake amounts $x_{{{\rm obs},1}} ,{\rm }x_{{{\rm obs},2}} ,\,\ldots\,x_{{{\rm obs},d}} $
. The objective function can be rewritten to a quadratic function, since
$x_{{{\rm obs},1}} ,{\rm }x_{{{\rm obs},2}} ,\,\ldots\,x_{{{\rm obs},d}} $
. The objective function can be rewritten to a quadratic function, since ${\bf x}$
is real-valued:
${\bf x}$
is real-valued:
 $$(x_{1} {\minus}x_{{{\rm obs},1}} )^{2} {\plus}(x_{2} {\minus}x_{{{\rm obs},2}} )^{2} {\plus} \cdots {\plus}(x_{n} {\minus}x_{{{\rm obs},d}} )^{2} $$
The model constraints ensure that the optimised intake meets weekly lower limits on the nutrients EPA+DHA and vitamin D (b) without violating weekly upper limits on the contaminants methyl mercury and dioxins+dl-PCB (c), and the constraints make sure that no negative intake occurs (d). The vector ${\bf b}$
(m×1) describes the weekly lower limits for the nutrient intake amounts due to fish intake (m=2), and
${\bf b}$
(m×1) describes the weekly lower limits for the nutrient intake amounts due to fish intake (m=2), and ${\bf r}$
(k×1) describes the weekly upper limits for the contaminant intake amounts (k=2). The matrix
${\bf r}$
(k×1) describes the weekly upper limits for the contaminant intake amounts (k=2). The matrix ${\bf B}$
(m×d) describes the mean nutrient concentrations for the different fish species, and
${\bf B}$
(m×d) describes the mean nutrient concentrations for the different fish species, and ${\bf R}$
(k×d) describes the mean contaminant concentrations. The model allows an individual’s non-reported fish species in her/his output intake. As it may be unlikely that people start choosing fish species they did not eat before, the model can be modified to only allow reported species by employing equality constraints in (d) for the non-reported species of the individual. Different background exposure scenarios correspond to different limit values (vectors
${\bf R}$
(k×d) describes the mean contaminant concentrations. The model allows an individual’s non-reported fish species in her/his output intake. As it may be unlikely that people start choosing fish species they did not eat before, the model can be modified to only allow reported species by employing equality constraints in (d) for the non-reported species of the individual. Different background exposure scenarios correspond to different limit values (vectors ${\bf b}$
and
${\bf b}$
and ${\bf r}$
) in the constraints. All vectors
${\bf r}$
) in the constraints. All vectors ${\bf x}$
that satisfy the constraints make up the feasible region of the problem. If there is no combination of fish species that can meet the constraints, no feasible solution is obtained and the model cannot generate a recommendation.
${\bf x}$
that satisfy the constraints make up the feasible region of the problem. If there is no combination of fish species that can meet the constraints, no feasible solution is obtained and the model cannot generate a recommendation.
Background exposure
Other foods
The background intake of nutrients and exposure to contaminants due to foods other than fish were potentially supplied by the 416 of the 433 reported foods in the intake data that were not fish (DANSDA 2011–2013, AN Pedersen et al., unpublished results). The food intake is not normally distributed, according to the Lilliefors test (α=5%). Individually reported whole diets, excluding fish intake, were multiplied with concentrations of the nutrients and contaminants of the different foods. Hence, the total intake of the different nutrients and contaminants was obtained for each individual in the study population (Table 4). EPA+DHA could be supplied by twenty-seven of the reported foods, mainly seafood (shrimp, mussels, fish roe, fish liver, etc.), and a smaller fraction by chicken and a few additional animal products. The background intake of EPA+DHA was 14 and 12% of the total average intake for women and men, respectively. For vitamin D, the relative importance of sources other than fish was higher, and the respective numbers were 61 and 63%, respectively. Background intake of vitamin D was potentially supplied by 116 of the reported foods, and the major sources were animal products including dairy products. For methyl mercury, eleven seafoods were the source of background exposure. These seafoods contributed to 9 and 6% of the total average dietary exposure for women and men, respectively. For dioxins+dl-PCB, 64 and 65% of the total average dietary exposure was due to background exposure for women and men, respectively. The background exposure to dioxins+dl-PBC was potentially supplied by 153 foods and the major sources were animal products including dairy products, as for vitamin D.
Nutrient and contaminant exposure* (Mean values and standard deviations; medians and interquartile ranges (IQR))

dl-PCB, dioxin-like polychlorinated biphenyls; TEQ, toxic equivalency; DANSDA, Danish national survey of diet and physical activity.
*Reported whole diet data and supplement intake data from DANSDA multiplied with concentration data for nutrients and contaminants( 8 – 10 ). Study population: 3016 individuals aged 18–75 years.
Supplements
Data on individual vitamin D intake from vitamin D supplements and multi-minerals from DANSDA were used (Table 4). In the study population, 62% of the women and 49% of the men had recorded intake of supplements containing vitamin D. No data on EPA+DHA supplement intake were available and therefore only vitamin D supplement intake was included in this study.
Sun and airborne contaminants
Vitamin D can be provided by UVB radiation from the sun that gets synthesised in the skin. In Denmark (latitude 55°N to 58°N), there is a significant seasonal variation in how much UVB radiation reaches the surface of the earth; the highest level is in summer, and the lowest is in winter( Reference Andersen, Brot and Jakobsen 16 , Reference Hansen, Tjønneland and Køster 17 ). We calculated (see Appendix) three different scenarios for sun exposure to cover the seasonal variation; winter, mid-season and summer. Food consumption is the major source of dioxins, contributing to more than 90% of the total human exposure( 18 ). We calculated (see Appendix) two different scenarios for airborne dioxin exposure: baseline (default) and low dioxin (LD). For methyl mercury, fish and seafood consumption is considered the major source of exposure( 11 , Reference Hong, Kim and Lee 19 ), and the average exposure due to air is <0·04 µg/d( Reference Hong, Kim and Lee 19 ). Since our assumptions for methyl mercury concentration in food were conservative, we assumed food as the only source.
Software
The models were implemented using Matlab (R2015b, version 8.6). The package CVX, for specifying and solving convex programs( Reference Grant and Boyd 20, Reference Grant and Boyd 21 ), was used for optimisation.
Background exposure scenarios
To analyse the impact of background exposure, twenty-four background exposure scenarios were created. First, six scenarios for the sun and airborne contaminant exposure were defined, combining the winter, mid-season and summer sun exposure scenario with the baseline and LD airborne dioxin scenarios (Table 5). These six scenarios were run with individual intake of foods other than fish and individual supplement intake, individual intake of foods other than fish without supplements (by assigning all individuals zero supplement intake), sex-specific average values for intake of foods other than fish and sex-specific average supplement intake and sex-specific average values for intake of foods other than fish without supplements. Hence, in total, twenty-four background exposure scenarios were created and each scenario was given a short name (Table 5). The mid-season scenario with individual intake of foods other than fish and individual supplement intake (Mid-season Ind) is the baseline background exposure scenario of our study.
Background exposure scenarios

LD, low dioxin; dl-PCB, dioxin-like polychlorinated biphenyls; TEQ, toxic equivalency.
*Baseline scenario.
Results
Mid-season and individual values
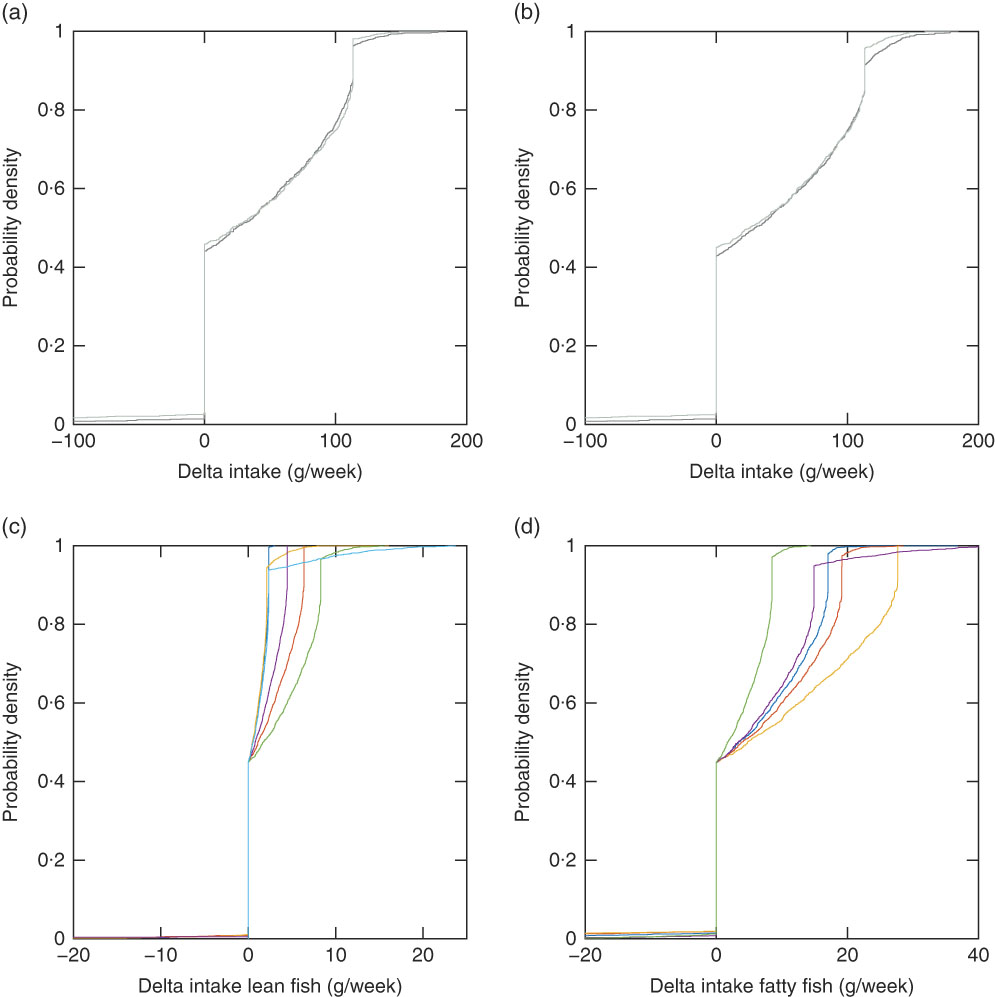
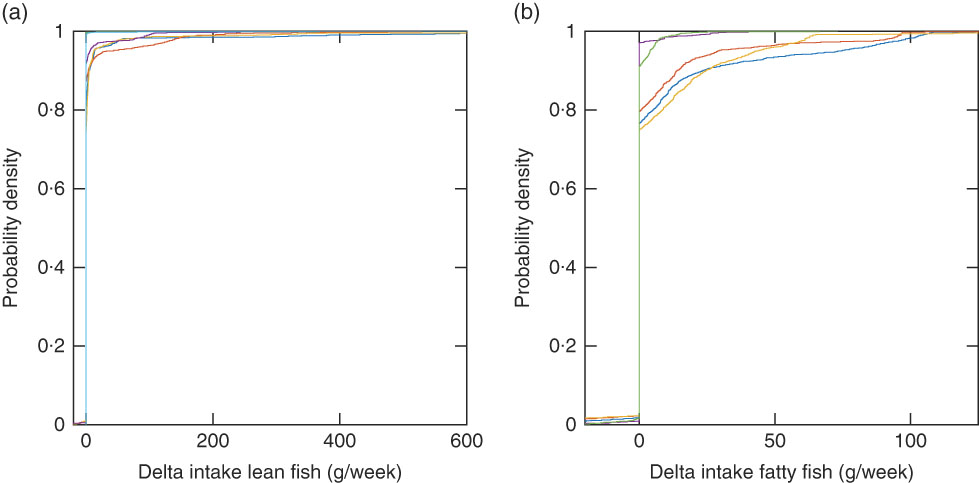
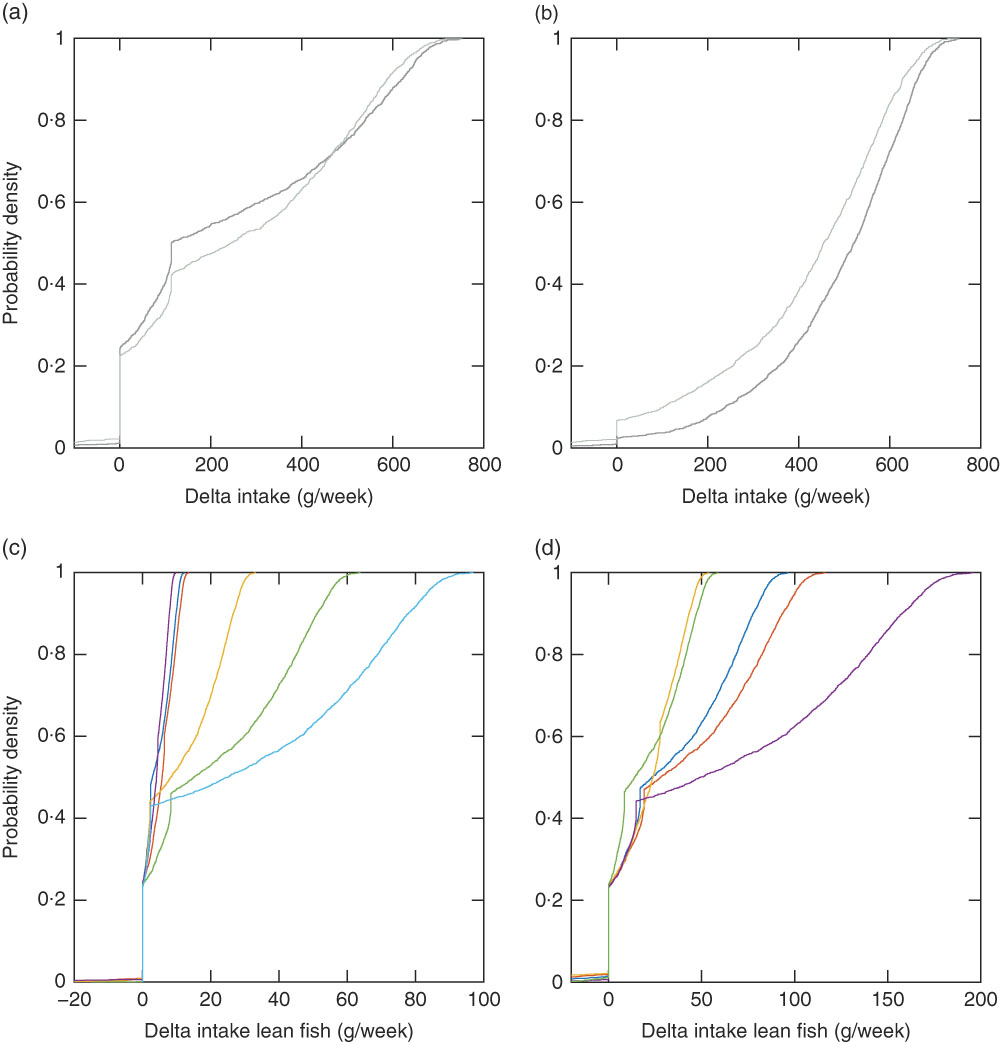
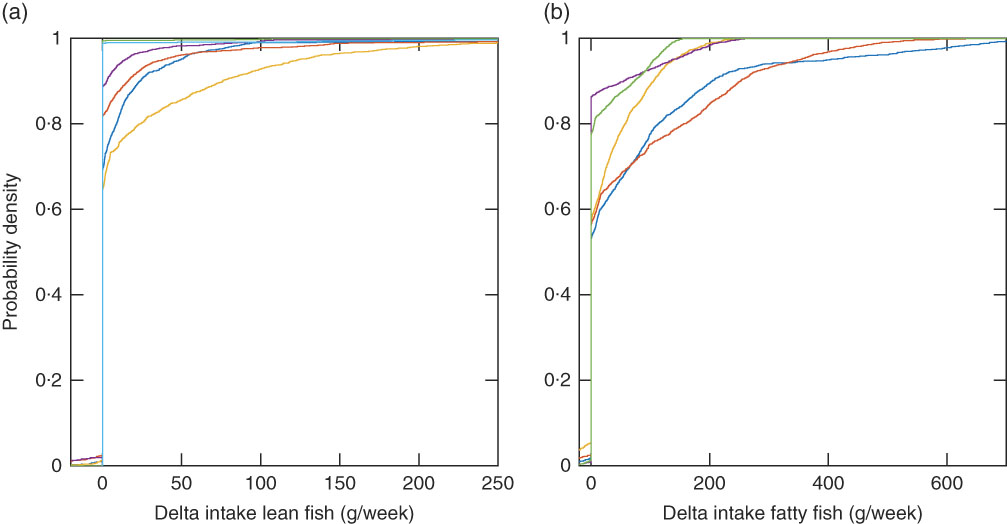
Out of the 3016 individuals in the study population, there were twenty-four individuals not obtaining a feasible solution, that is, no personalised recommendation could be generated with the mid-season sun exposure scenario with and without supplement intake (Mid-season Ind and Mid-season Ind No Sup) (Table 6). Out of these, twenty-two had a background exposure to dioxins+dl-PCB that was higher than the threshold (14 pg toxic equivalency (TEQ)/kg body weight per week). The other two had a background exposure to dioxins+dl-PCB just below the threshold, but there was a conflict with the nutrient constraints, so that no fish intake could fulfil all constraints. The observed intake and the modelled recommendations with the Mid-season Ind scenario, which is our baseline scenario, are grouped into lean and fatty fish for the purpose of visualisation (Fig. 1). The average modelled fish intake recommendations (also grouped into lean and fatty fish) with the twenty-four different background exposure scenarios can be seen in online Supplementary Table S1. The suggested changes in fish intake (delta intake), modelled recommendations minus observed intakes, can be visualised with empirical cumulative distribution functions. For these functions, the value on the y-axis at any specified value of the delta fish intake is the fraction of individuals in the study population that should be suggested to make a change less than or equal to the specified value. Fig. 2 shows this for the Mid-season Ind scenario (Fig. 2(a), (c) and (d)) and for the Mid-season Ind No Sup scenario (d). Our results suggest that 43% of the 2992 individuals with feasible solutions (99% of the study population) should be advised to maintain their current fish consumption pattern, that 55% should be recommended to increase their total fish intake up to 184 g/week (24% with more than 100 g/week) and that only 2·0% should be recommended to decrease their fish intake (Fig. 2(a)). With the Mid-season sun exposure scenario, the difference in the results generated with and without supplements is small, and so is the difference with individual and average data (online Supplementary Table S1). Different species dominate the recommended intakes, which depends on whether the EPA+DHA or the vitamin D constraint is the critical lower constraint. For example, saithe dominates the lean fish species and trout dominates the fatty fish species when the vitamin D constraint is critical, whereas garfish and herring dominate when the EPA+DHA constraint is critical (Fig. 2(c) and (d)). When the model was modified to only allow reported fish intake in the modelled recommendations, 536 individuals had no feasible solutions, and different species dominated the modelled intakes: tuna, plaice and cod dominate the lean fish species, and mackerel and salmon dominate the fatty fish species (Fig. 3).
Empirical cumulative distribution functions for delta fish intake (modelled recommendation minus observed intake) for 2992 individuals with the Mid-season scenario with individual intake of other foods and individual intake of supplements (Mid-season Ind scenario) (a), the Mid-season scenario with individual intake of other foods and no intake of supplements (Mid-season Ind No Sup scenario) (b), the Mid-season Ind scenario, lean fish species (c), and the Mid-season Ind scenario, fatty fish species (d). (a, b) ![]() , Women;
, Women; ![]() , men. (c)
, men. (c) ![]() , Cod;
, Cod; ![]() , plaice;
, plaice; ![]() , tuna;
, tuna; ![]() , flounder;
, flounder; ![]() , garfish;
, garfish; ![]() , saithe. (d)
, saithe. (d) ![]() , Salmon;
, Salmon; ![]() , herring,
, herring, ![]() ; mackeral;
; mackeral; ![]() , trout;
, trout; ![]() , hailbut.
, hailbut.
Empirical cumulative distribution functions for delta fish intake (modelled recommendation minus observed intake) for 2480 individuals with the Mid-season scenario with individual intake of other foods and individual intake of supplements (Mid-season Ind scenario), lean fish species (a), and the Mid-season Ind scenario, fatty fish species (b) when only individual reported fish species are allowed in the modelled intake. (a) ![]() , Cod;
, Cod;![]() , plaice;
, plaice; ![]() , tuna;
, tuna; ![]() , flounder;
, flounder; ![]() , garfish;
, garfish; ![]() , saithe. (b)
, saithe. (b) ![]() , Salmon;
, Salmon; ![]() , herring,
, herring, ![]() ; mackeral;
; mackeral; ![]() , trout;
, trout; ![]() , hailbut.
, hailbut.
Number of individuals out of 3016 with no feasible solution for the different background exposure scenarios

LD, low dioxin
* Only individual reported species allowed in modelled recommendations.
Winter and individual values
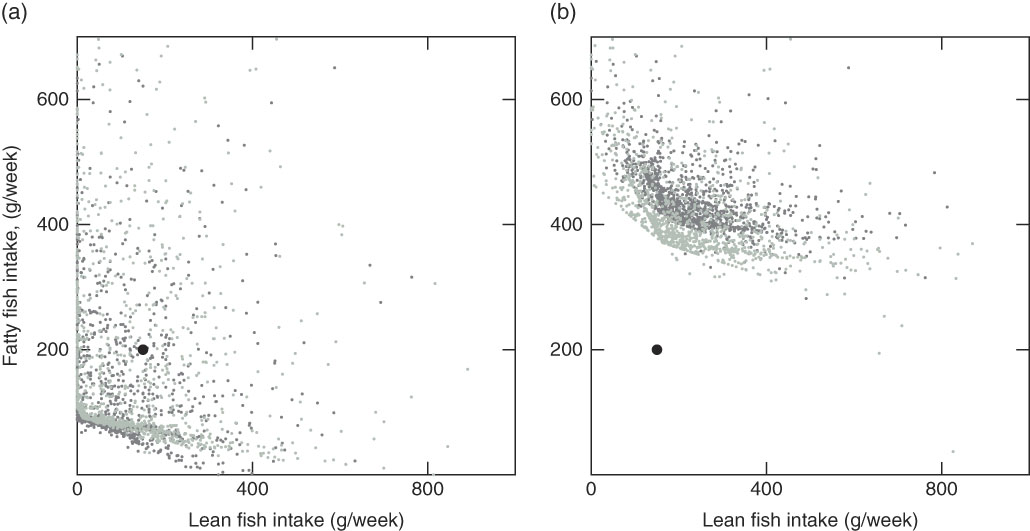
The recommended intake modelled with the Winter sun exposure scenario with and without supplement intake (Winter Ind and Winter Ind No Sup) shows the impact of vitamin D supplements (Fig. 4). When the supplement intake is excluded, 960 women and 715 men should be recommended to increase their fish intake a lot more than with the scenario including the observed supplement intake. With the winter scenario, one additional woman had no feasible solution as compared with the mid-season scenario. Her reported body weight was low (41 kg) and a conflict between the vitamin D constraint and the dioxins+dl-PCB constraint (which is body-weight dependent) occurred with this scenario that has no sun exposure contributing to vitamin D intake. With the winter scenario, the same fish species as for the mid-season scenario dominate, depending on the critical lower constraint. However, a larger fraction of the study population has the vitamin D constraint as the critical lower constraint (Fig. 5). When the Winter Ind scenario is analysed under the condition that only reported fish intake is allowed in the modelled recommendations, 791 individuals had no feasible solutions and tuna dominates the lean fish species, and herring and salmon dominate the fatty fish species (Fig. 6).
Modelled recommended fish intake for 2991 individuals with the Winter scenario with individual intake of other foods and individual intake of supplements (Winter Ind scenario) (a) and the Winter scenario with individual intake of other foods and no intake of supplements (Winter Ind No Sup scenario) (b). ![]() , Guideline;
, Guideline; ![]() , women;
, women; ![]() , men.
, men.
Empirical cumulative distribution functions for delta fish intake (modelled recommendation minus observed intake) for 2991 individuals with the Winter scenario with individual intake of other foods and individual intake of supplements (Winter Ind scenario) (a), the Winter scenario with individual intake of other foods and no intake of supplements (Winter Ind No Sup scenario) (b), the Winter Ind scenario, lean fish species (c) and the Winter Ind scenario, fatty fish species (d). (a, b) ![]() , Women;
, Women; ![]() , men. (c)
, men. (c) ![]() , Cod;
, Cod; ![]() , plaice;
, plaice; ![]() , tuna;
, tuna; ![]() , flounder;
, flounder; ![]() , garfish;
, garfish; ![]() , saithe. (d)
, saithe. (d) ![]() , Salmon;
, Salmon; ![]() , herring,
, herring, ![]() ; mackeral;
; mackeral; ![]() , trout;
, trout; ![]() , hailbut.
, hailbut.
Empirical cumulative distribution functions for delta fish intake (modelled recommendation minus observed intake) for 2225 individuals with the Winter scenario with individual intake of other foods and individual intake of supplements (Winter Ind scenario), lean fish species (a), and the Winter Ind scenario, fatty fish species (b) when only individual reported fish species are allowed in the modelled intake. (a) ![]() , Cod;
, Cod; ![]() , plaice;
, plaice; ![]() , tuna;
, tuna; ![]() , flounder;
, flounder; ![]() , garfish;
, garfish; ![]() , saithe. (b)
, saithe. (b) ![]() , Salmon;
, Salmon; ![]() , herring,
, herring, ![]() ; mackeral;
; mackeral; ![]() , trout;
, trout; ![]() , hailbut.
, hailbut.
Winter and average values
The winter scenarios with average values for intake of other foods and supplements show how average values can give misleading results (Fig. 7). The modelled recommendations differ greatly compared with when individual values are used (Winter Av and Winter Av No Sup) (Fig. 4). With average values, all individuals had a feasible solution due to the fact that the twenty-five individuals with high background exposure to dioxins+dl-PCB get a lower value that is compatible with the other constraints, and the individuals not consuming supplements (592 women and 749 men) get a great addition to their background intake of vitamin D when the average values for supplements are used.
Modelled recommended fish intake for 3016 individuals with the Winter scenario with average intake of other foods and average intake of supplements (Winter Av scenario) (a) and the Winter scenario with average intake of other foods and no intake of supplements (Winter Av No Sup scenario) (b). ![]() , Guideline;
, Guideline; ![]() , women;
, women; ![]() , men.
, men.
Summer and average values
The vitamin D intake due to sun exposure in the summer scenario (15 µg/d) is higher than the recommended vitamin D intake (10 µg/d). Hence, the vitamin D constraint is already fulfilled, and the EPA+DHA constraint is the lower critical constraint for all individuals. The summer scenario is hard to distinguish from the mid-season scenario in a figure, and hence not shown.
Low dioxin
With the LD airborne exposure scenarios (LD), two more individuals (one woman and one man) had feasible solutions compared with when the baseline value for dioxins+dl-PCB is used. The majority of the study population should be recommended the same intake with LD exposure as with the baseline value, since the number of individuals with reported high fish intake are fewer than those with lower reported intake (Fig. 1).
Non-fish consumers
In the study population, 12% of the individuals reported no fish intake. With the winter sun exposure scenario with individual values (Winter Ind and Winter Ind No Sup), the modelled intake recommendations located on an imaginary line (Fig. 4) correspond to recommendations for individuals with no fish intake. The ratio between lean and fatty fish is 1:2·3 for these recommendations, and the line is orthogonal to the individual critical lower vitamin D constraints. With the summer sun exposure scenario (Sun Ind and Sun Ind No Sup), the EPA+DHA constraint is the critical lower constraint for all individuals, and with this scenario, the ratio between lean and fatty fish species is 1:3·3 for non-fish consumers.
Discussion
To our knowledge, this is the first intake optimisation study exploring the effect of individual background exposure to nutrients and contaminants due to the consumption of other foods and supplements, as well as sun and airborne contaminant exposure. We showed that individual differences in background exposure can be included in the analysis and that these differences provide additional insights and affect the personalised recommendations. The majority of the 3016 Danes in our study population had reported a fish intake that was lower than her/his individual model constraints allowed, and hence the lower nutrient constraints (EPA+DHA and vitamin D) were critical for the largest part of the study population. The modelled recommendations were specifically sensitive to the vitamin D background exposure. Comparing the mid-season scenario (the baseline scenario) with the winter scenario, that differ with 7·25 µg/d vitamin D background intake, the individuals not taking vitamin D supplements should be recommended a much higher fish intake in winter. A few individuals with high background intake of dioxins+dl-PCB were affected by a lower dioxin airborne exposure than the baseline value, but the largest part of the study population was not. The exposure to EPA+DHA and methyl mercury is mainly due to fish consumption, and therefore the background exposure to these compounds had little effect. However, as mentioned, EPA+DHA supplements may have been taken, which we unfortunately had no data on. Such input would have been very important for the individuals and scenarios where the EPA+DHA constraint dominated, since a higher background intake will lower the constraint resulting in lower fish intake recommendations.
According to our criteria on fish intake (the model constraints on EPA+DHA, vitamin D, methyl mercury and dioxins+dl-PCB), following the recommendation for fish intake in the official Danish dietary guideline (350 g fish/week of which 200 g should be fatty fish) is, as expected, healthy and not harmful. However, the official guideline demands larger changes in consumption than necessary, which may lead to a lack of compliance. This is concluded using our baseline scenario for background exposure (Mid-season Ind). This was also concluded in our previous study on individual fish intake recommendations( Reference Persson, Fagt and Pires 2 ). In this study, we show that fewer individuals need to be recommended to increase their fish intake when individual background exposures are used: 55% of the study population compared with 74% as concluded in our previous study using the same average background exposures for all individuals.
When only reported fish species are allowed in the modelled recommendation, larger intake amounts of fish should be suggested compared with when all species are allowed. Since the reported intake was a 7-d estimated record, and other species of fish may well have been consumed by an individual during another week, we concluded that the results from the model only allowing reported species in this study are less relevant. However, if the observed intake data were, for example, individual yearly average values, the modified model only allowing individual reported fish species may be appropriate for generating the personalised recommendations, since the intake data would reflect which species an individual consumes. If data on which fish species an individual could consider consuming and which species she/he do not wish to consume was available, the results could be further personalised by only allowing the species she/he wants in the personalised recommendation.
A future application of our model could be to create software that individuals could use and generate personalised recommendations themselves. The user would be asked by the software to insert how much she/he currently consumes of some food items, and to select which additional food items she/he would consider for consumption. By application of our model, the software could then generate a personalised recommendation that accounts for the individual’s inserted preferences. If the individual would set too few foods she/he is willing to consume to obtain a feasible solution, the software would have to ask the individual to select additional foods.
In our previous study( Reference Persson, Fagt and Pires 2 ), all individuals obtained a feasible solution, that is, a personalised recommendation could be made. With the inclusion of individual background exposures, twenty-four individuals (0·8% of the study population) had unfeasible solutions due to a too high background exposure to dioxins+dl-PCB with the mid-season scenario. It is important to stress that there are other ways to modify diets to fulfil the requirements on the EPA, DHA and vitamin D without exceeding the limit value for methyl mercury and dioxin+dl-PCB than to only modify fish intake. As mentioned, vitamin D and dioxin+dl-PCB, for example, can be provided by several animal products including diary. Therefore, the twenty-four individuals without feasible solutions should typically be suggested to eat less of these foods. In this study, fish was the only food in focus; foods other than fish were defined as background exposure, and substitution with other foods was not considered, but the optimisation approach can be extended to include foods other than fish in the optimisation variable; even whole diets can be optimised( Reference Maillot, Vieux and Amiot 3 , Reference Maillot, Vieux and Ferguson 4 , Reference Barre, Vieux and Perignon 22 ). By expanding the optimisation to several foods and ultimately whole diets, the substitution issue is resolved. This may require inclusion of several additional constraints on nutrients and contaminants on top of those mentioned in this fish intake optimisation study.
When using average values for the background exposures in this study, all individuals had feasible solutions with all scenarios. This suggests that individuals at risk of exceeding the upper levels for the contaminants may not be detected when average background exposures are used. Some individuals would be recommended a fish intake that would result in too high of an exposure to contaminants (dioxins+dl-PCB in this case) when using average background exposures. In general, when the variation in background exposure from a food compound is large, average values may be misleading. This is also the case when a nutrient (or contaminant) constraint is critical and hard to reach for several individuals due to relatively low (or high) background exposure to the compound. This was shown for the vitamin D background exposure by comparing individual background exposure from foods and supplements with average values. With the winter scenario and average values, the model resulted in much lower recommended intakes than appropriate, especially for individuals not taking supplements.
In previous fish intake optimisation studies, it has been concluded that when a substantial amount of vitamin D is required to come from fish, there is a conflict between vitamin D and contaminants( Reference Persson, Fagt and Pires 2 , Reference Sirot, Leblanc and Margaritis 7 ). In these studies, all individuals were assigned the same average background exposures. In this study, we concluded that there is a conflict only for twenty-five individuals when sun exposure and supplements are excluded, which is the extreme case, and twenty-four individuals when including sun exposure and supplements. Hence, this study shows that the conflict between vitamin D and contaminants is not as critical as concluded earlier. When a high level of vitamin D is required to come from fish, the recommended fish intake should be high, but still within the feasible region for the majority of the study population. It is however clear that vitamin D exposure from the sun greatly affects the modelled intake. From this, it could be argued that all individuals in Denmark should eat supplements to reach the vitamin D recommendation, whereby only the EPA+DHA constraint would be relevant for the fish consumption. This would result in lower and hence more achievable fish intake recommendations. Obviously, if we would have been able to include the intake of fish oil supplements as well, fish intake recommendations based on EPA+DHA requirements would have reduced even more.
This approach can be used to estimate personalised intake recommendations for other foods and/or other populations. When considering using average values for background exposure, we suggest starting by performing a rough scenario analysis with different average values to investigate the sensitivity of the results on the background exposure, and to obtain an indication of how many individuals can be at risk of exceeding the tolerable intake levels for the contaminants. After this, a conscious decision on whether or not to include individual background exposure data can be made. This applies to all background exposures, but especially to supplements because the nutrient concentration(s) in supplements are usually high (and often cover the recommended intake(s) alone), and individuals either take or not take supplements. If individual supplement intake data are used, the modelled recommendations may be grouped into two clusters of individuals, with and without reported supplement intake, which is important to stress when communicating the modelled recommendations.
Lastly, this method builds upon the assumption that personalised dietary recommendations deviating as little as possible from current consumption have a higher compliance than national guidelines, which has not been confirmed. How individuals respond to personalised recommendations is an area that requires additional research.
Acknowledgements
The authors thank Sara M. Pires and Morten Poulsen for valuable discussions and for critically reading the manuscript.
The preparation of this manuscript was funded through the Metrix project by the Ministry for Environment and Food in Denmark. The Ministry for Environment and Food in Denmark had no role in the design, analysis or writing of this article.
The authors contributions are as follows: M. P. and M. J. N. formulated the research question, designed the study and drafted the manuscript; S. F. provided essential material; M. P. carried out the study and analysed the data; and all authors approved the final version.
The authors declare that there are no conflicts of interest.
Supplementary material
For supplementary material/s referred to in this article, please visit https://doi.org/10.1017/S0007114518002131
Appendix
Sun exposure
To estimate a value for vitamin D intake due to sun exposure, we assumed a linear relationship between vitamin D status and intake. For Danish adults (n 2625) not taking vitamin D supplements, the median serum 25-hydroxyvitamin D (25(OH)D) concentrations (from blood samples) were in a study on vitamin D status in Denmark measured to 68·4 and 40·0 nmol/l in the autumn and spring, respectively( Reference Hansen, Tjønneland and Køster 17 ). We used data from an Irish study to define the linear relationship between this vitamin D status and intake. In the Irish study( Reference Cashman, Hill and Lucey 23 ), conditional distributions of serum 25(OH)D concentration (in late winter) at specific values of vitamin D intake (from foods and supplements) were modelled for healthy adults (n 215) living in Ireland and Northern Ireland (latitudes 51°N and 55°N) and the mean log-transformed 25(OH)D concentration was defined as a linear function of vitamin D intake. The slope of the relationship between total vitamin D intake and 25(OH)D concentration was 1·96 in the study population, and for the lowest vitamin D intake (0·01 µg), the 50th percentile 25(OH)D concentration was 34·5 nmol/l. For this study, we used this slope value of 1·96 and the value 34·5 nmol/l as vertical intercept to define our linear equation:
 $$c{\equals}1\hskip-1.5pt\cdot\hskip-1pt96{\times}i{\plus}34\hskip-1pt\cdot\hskip-1.pt5$$
where $i$
=vitamin D intake (µg/d) and
$i$
=vitamin D intake (µg/d) and $c$
=mean 25(OH)D concentration (nmol/l). This assumption was considered appropriate for our study. The median intake 17·3 and 2·81 µg/d in the autumn and spring, respectively, were obtained by converting the median concentrations(
Reference Hansen, Tjønneland and Køster
17
) with the linear equation. We assumed that the difference between the autumn and spring intake, 14·5 µg/d, is only due to sun exposure and not a change in food intake, and it was interpreted as the exposure to vitamin D due to UVB radiation in summer. We defined a summer scenario with this value and we also defined a winter scenario with an intake of 0 µg vitamin D/d due to sun exposure. A mid-season scenario with the average of the summer and the winter value, 7·25 µg/d, defined the baseline value. Daily values were multiplied with 7 d to obtain weekly values.
$c$
=mean 25(OH)D concentration (nmol/l). This assumption was considered appropriate for our study. The median intake 17·3 and 2·81 µg/d in the autumn and spring, respectively, were obtained by converting the median concentrations(
Reference Hansen, Tjønneland and Køster
17
) with the linear equation. We assumed that the difference between the autumn and spring intake, 14·5 µg/d, is only due to sun exposure and not a change in food intake, and it was interpreted as the exposure to vitamin D due to UVB radiation in summer. We defined a summer scenario with this value and we also defined a winter scenario with an intake of 0 µg vitamin D/d due to sun exposure. A mid-season scenario with the average of the summer and the winter value, 7·25 µg/d, defined the baseline value. Daily values were multiplied with 7 d to obtain weekly values.
Airborne dioxin
To estimate a value of the exposure to airborne dioxin, we defined the relationships:
 $$\openup -3pt\eqalign{\rm Total\,\,mean\,\,exposure{\equals}mean\,\,airborne\,\,exposure \,\,\,\,\cr {\plus}\rm mean\,\,exposure\,\,from\,\,food}$$
 $${\rm Mean\,\,exposure\,\,from\,\,food \, {\equals}} x\,\,{\rm \,\%\,{\times} \, total\,\,mean\,\,exposure}$$
From these relationships, we derived a formula for calculating the mean airborne exposure to dioxin:
 $$\scale96%{ {\rm Mean \ airborne \ expsoure{\equals}mean \ exposure \ from \ food \, {\times} }\left( {{{100} \over x}{\minus}{\rm }1} \right){\rm }$$
where x=percentage of total exposure from food, 0<x≤100. We calculated the mean airborne exposure for the study population, using the population mean (376 pg TEQ/week). As the baseline value, a conservative assumption, x=90%, was used. An alternative LD value corresponded to x=95%.


