


Statement of Research Significance
Research Questions(s) or Topic(s): This study analyzed the relationship between brain network activity and memory and cognitive skills in older adults across a range of cognitive aging and dementia. Main Findings: The study revealed that weaker cognitive abilities relate to stronger connections both between and within certain brain networks. Individuals with lower cognitive performance exhibited stronger connections among brain areas associated with attention, memory, and decision-making. This pattern became more pronounced in participants with more severe cognitive issues, such as Alzheimer’s disease, compared to those with milder forms of cognitive impairment. Study Contributions: These findings suggest that the brain may attempt to compensate for cognitive decline by strengthening connections between specific networks. This study supports the notion that resting-state brain scans could aid in detecting early signs of mild cognitive impairment and Alzheimer’s disease-related dementia, thereby making diagnosis easier and more accessible.
Introduction
The identification of biomarkers in mild cognitive impairment (MCI) and Alzheimer’s disease (AD) has the potential to advance the diagnosis, tracking, and treatment of these conditions. Although several biomarkers are available (e.g., β-amyloid plaque via positron emission tomography (PET), tau in cerebrospinal fluid via lumbar puncture, brain metabolism via fluoro-2-deoxyglucose PET imaging, and apolipoprotein ϵ4 carrier status and other plasma markers via blood draw), these diagnostic procedures can be expensive and/or invasive and expose potential participants to unnecessary risks (Chang et al., Reference Chang, Teng, Elashoff and Grill2017; Holland et al., Reference Holland, McEvoy, Desikan and Dale2012; Hua et al., Reference Hua, Ching, Mezher, Gutman, Hibar, Bhatt, Leow, Jack, Bernstein, Weiner and Thompson2016; Kennedy et al., Reference Kennedy, Cutter and Schneider2014; Lorenzi et al., Reference Lorenzi, Donohue, Paternico, Scarpazza, Ostrowitzki, Blin, Irving and Frisoni2010; Macklin et al., Reference Macklin, Blacker, Hyman and Betensky2013; Sevigny et al., Reference Sevigny, Suhy, Chiao, Chen, Klein, Purcell, Oh, Verma, Sampat and Barakos2016; Yu et al., Reference Yu, Sun, Wolz, Stephenson, Brewer, Fox, Cole, Jack, Hill and Schwarz2014).
Resting-state functional MRI (fMRI) utilizes naturally occurring fluctuations in low-frequency oscillations of blood oxygen level-dependent (BOLD) contrast between brain regions while the brain is not engaged in a particular cognitive task (i.e., at rest). Functional connectivity is a quantitative measure of synchronous brain activity used to identify large-scale resting-state functional networks (Biswal et al., Reference Biswal, Yetkin, Haughton and Hyde1995; Buckner et al., Reference Buckner, Krienen, Castellanos, Diaz and Yeo2011; Fox et al., Reference Fox, Corbetta, Snyder, Vincent and Raichle2006; Greicius et al., Reference Greicius, Krasnow, Reiss and Menon2003; Yeo et al., Reference Yeo, Krienen, Sepulcre, Sabuncu, Lashkari, Hollinshead, Roffman, Smoller, Zollei, Polimeni, Fischl, Liu and Buckner2011). This measure of brain activity is altered in patients with MCI and AD. Specifically, between- and within-network connectivity in multiple canonical networks (e.g., default, salience, central executive, limbic) seems particularly affected (Agosta et al., Reference Agosta, Pievani, Geroldi, Copetti, Frisoni and Filippi2012; Badhwar et al., Reference Badhwar, Tam, Dansereau, Orban, Hoffstaedter and Bellec2017; Bai et al., Reference Bai, Watson, Yu, Shi, Yuan and Zhang2009; Binnewijzend et al., Reference Binnewijzend, Schoonheim, Sanz-Arigita, Wink, van der Flier, Tolboom, Adriaanse, Damoiseaux, Scheltens, van Berckel and Barkhof2012; Brier et al., Reference Brier, Thomas, Snyder, Benzinger, Zhang, Raichle, Holtzman, Morris and Ances2012; Greicius et al., Reference Greicius, Srivastava, Reiss and Menon2004; Jalilianhasanpour et al., Reference Jalilianhasanpour, Beheshtian, Sherbaf, Sahraian and Sair2019; Koch et al., Reference Koch, Teipel, Mueller, Benninghoff, Wagner, Bokde, Hampel, Coates, Reiser and Meindl2012; Lehmann et al., Reference Lehmann, Madison, Ghosh, Miller, Greicius, Kramer, Coppola, Miller, Jagust, Gorno-Tempini, Seeley and Rabinovici2015; Lehmann et al., Reference Lehmann, Madison, Ghosh, Seeley, Mormino, Greicius, Gorno-Tempini, Kramer, Miller, Jagust and Rabinovici2013; Petrella et al., Reference Petrella, Sheldon, Prince, Calhoun and Doraiswamy2011; Ranasinghe et al., Reference Ranasinghe, Hinkley, Beagle, Mizuiri, Dowling, Honma, Finucane, Scherling, Miller, Nagarajan and Vossel2014; Sorg et al., Reference Sorg, Riedl, Muhlau, Calhoun, Eichele, Laer, Drzezga, Forstl, Kurz, Zimmer and Wohlschlager2007; Zhang et al., Reference Zhang, Wang, Liu, Ma, Yang, Zhang and Teng2010). However, across studies, poorer cognitive performance has been associated with both reduced (‘hypo-’) connectivity and increased (‘hyper-’) connectivity within and between large-scale networks (Badhwar et al., Reference Badhwar, Tam, Dansereau, Orban, Hoffstaedter and Bellec2017), leaving the directionality of functional connectivity findings in these groups uncertain. For resting-state functional connectivity to serve as a potential biomarker for identifying MCI and AD, it is essential to establish a relationship between functional connectivity and established markers of cognitive change.
The Repeatable Battery for the Assessment of Neuropsychological Status (RBANS) is a brief neuropsychological screening measure that assesses language, attention, visuospatial/constructional faculties, and immediate and delayed memory (Randolph et al., Reference Randolph, Tierney, Mohr and Chase1998). Considerable research has validated the RBANS in evaluating cognitive function in cognitively intact older individuals (Cooley et al., Reference Cooley, Heaps, Bolzenius, Salminen, Baker, Scott and Paul2015; Duff & Ramezani, Reference Duff and Ramezani2015; Phillips et al., Reference Phillips, Qi, Collinson, Ling, Feng, Cheung and Ng2015; Thaler et al., Reference Thaler, Hill, Duff, Mold and Scott2015), MCI (Clark et al., Reference Clark, Hobson and OBryant2010; Duff et al., Reference Duff, Hobson, Beglinger and OBryant2010; Hobson et al., Reference Hobson, Hall, Humphreys-Clark, Schrimsher and OBryant2010; Karantzoulis et al., Reference Karantzoulis, Novitski, Gold and Randolph2013; O’Mahar et al., Reference O’Mahar, Duff, Scott, Linck, Adams and Mold2012), and AD (Burton et al., Reference Burton, Enright, OConnell, Lanting and Morgan2015; Duff et al., Reference Duff, Humphreys Clark, OBryant, Mold, Schiffer and Sutker2008; Enright et al., Reference Enright, OConnell, MacKinnon and Morgan2015; Heyanka et al., Reference Heyanka, Scott and Adams2015; McDermott & DeFilippis, Reference McDermott and DeFilippis2010; Morgan et al., Reference Morgan, Linck, Scott, Adams and Mold2010; Schmitt et al., Reference Schmitt, Livingston, Smernoff, Reese, Hafer and Harris2010). Moreover, RBANS performance has been associated with existing MCI and AD brain biomarkers such as hippocampal atrophy (Duff et al., Reference Duff, Suhrie, Hammers, Dixon, King, Koppelmans and Hoffman2023; England et al., Reference England, Gillis and Hampstead2014; Euler et al., Reference Euler, Duff, King and Hoffman2023; Ottoy et al., Reference Ottoy, Niemantsverdriet, Verhaeghe, De Roeck, Struyfs, Somers, wyffels, Ceyssens, Van Mossevelde, Van den Bossche, Van Broeckhoven, Ribbens, Bjerke, Stroobants, Engelborghs and Staelens2019; Paul et al., Reference Paul, Lane, Tate, Heaps, Romo, Akbudak, Niehoff and Conturo2011; Suhrie et al., Reference Suhrie, Hammers, Porter, Dixon, King, Anderson, Duff and Hoffman2021), hypometabolism on fluoro-2-deoxyglucose (FDG) PET (Frings et al., Reference Frings, Spehl, Hull and Meyer2016; Jagust et al., Reference Jagust, Bandy, Chen, Foster, Landau, Mathis, Price, Reiman, Skovronsky, Koeppe and Alzheimer’s Disease Neuroimaging2010), cerebral β-amyloid deposition (Duff et al., Reference Duff, Foster, Dennett, Hammers, Zollinger, Christian, Butterfield, Beardmore, Wang, Morton and Hoffman2013; Euler et al., Reference Euler, Duff, King and Hoffman2023; Hammers et al., Reference Hammers, Atkinson, Dalley, Suhrie, Horn, Rasmussen, Beardmore, Burrell, Duff and Hoffman2017; Ottoy et al., Reference Ottoy, Niemantsverdriet, Verhaeghe, De Roeck, Struyfs, Somers, wyffels, Ceyssens, Van Mossevelde, Van den Bossche, Van Broeckhoven, Ribbens, Bjerke, Stroobants, Engelborghs and Staelens2019; Suhrie et al., Reference Suhrie, Hammers, Porter, Dixon, King, Anderson, Duff and Hoffman2021; Teng et al., Reference Teng, Ward, Manser, Sanabria-Bohorquez, Ray, Wildsmith, Baker, Kerchner and Weimer2019), and APOE ϵ4 carrier status (Duff et al., Reference Duff, Suhrie, Hammers, Dixon, King, Koppelmans and Hoffman2023; Suhrie et al., Reference Suhrie, Hammers, Porter, Dixon, King, Anderson, Duff and Hoffman2021).
A growing body of literature has demonstrated associations between resting-state functional connectivity between canonical networks and cognitive performance across various tasks and assessments (Contreras et al., Reference Contreras, Goni, Risacher, Amico, Yoder, Dzemidzic, West, McDonald, Farlow, Sporns and Saykin2017; Gour et al., Reference Gour, Felician, Didic, Koric, Gueriot, Chanoine, Confort-Gouny, Guye, Ceccaldi and Ranjeva2014; Li et al., Reference Li, Wang, Li, Sun, Sheng, Li, Li, Yu, Chen, Hu, Jing, Wang, Li, Jessen, Xia and Han2016; Lin et al., Reference Lin, Rosenberg, Yoo, Hsu, O’Connell and Chun2018), suggesting functional connectivity-based biomarkers may generalize across instruments that assess comparable domains. However, to our knowledge, no study has specifically explored whether patterns of resting-state functional connectivity are linked to performance on the RBANS and its index scores. Establishing RBANS-specific functional connectivity correlations in older adults remains important since this brief battery is well-tolerated by this population, has appropriate normative data, has alternate forms for tracking cognition over time, and has been validated in older adults who are cognitively unimpaired or have MCI or AD (Randolph et al., Reference Randolph, Tierney, Mohr and Chase1998). It is also widely used in clinical practice (Rabin et al., Reference Rabin, Paolillo and Barr2016) and clinical trials (Papp et al., Reference Papp, Rofael, Veroff, Donohue, Wang, Randolph, Grober, Brashear, Novak, Ernstrom, Raman, Aisen, Sperling, Romano and Henley2022). As such, understanding the associations of functional connectivity and performance on the RBANS appears to have practical applications.
The goal of the current study was to examine the relationship between the RBANS Index and Total scores and resting-state functional connectivity in participants identified as cognitively intact, MCI, or AD. Whole-brain resting-state functional connectivity of large-scale functional networks, including the visual, somatomotor, attention, salience, central executive, and default mode networks (Yeo et al., Reference Yeo, Krienen, Sepulcre, Sabuncu, Lashkari, Hollinshead, Roffman, Smoller, Zollei, Polimeni, Fischl, Liu and Buckner2011), was examined. Given the equivocal pattern of directional predictions for MCI and AD relative to cognitively intact older adults (hypo- versus hyper-connectivity), no such directional predictions were made. Instead, diagnostic status was conceptualized as a position along a dementia-spectrum continuum, and group membership was coded as an ordinal index of clinical severity. It was hypothesized that functional connectivity within and between networks of interest would demonstrate stronger associations with cognitive performance as dementia-spectrum status increased (ranging from cognitively intact to MCI to AD), reflecting progressive disruption of network organization as it relates to cognition.
Methods
Participants
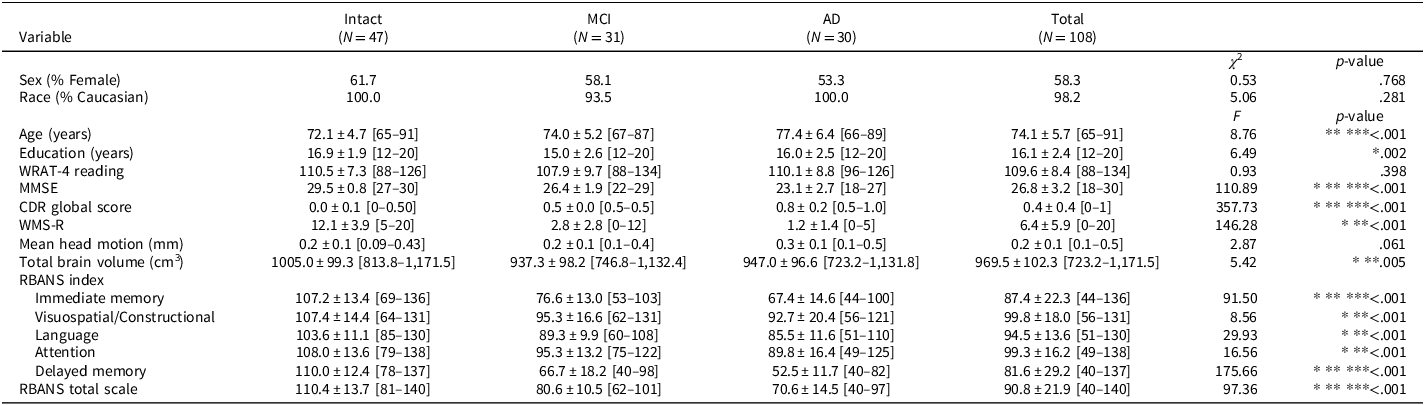
This study was approved by the Institutional Review Board at the University of Utah and conducted in compliance with the Helsinki Declaration. Participants were recruited from a cognitive disorders clinic or through the community and received remuneration for their voluntary participation. Data were collected between 2018 and 2022. All study participants provided written informed assent or consent prior to study participation. Participants were required to be 65 or older and have a knowledgeable collateral source available to speak to their cognitive and daily functioning. Their mean age was 74.1 ± 5.7 years, and mean education was 16.1 ± 2.5 years. Most were Caucasian (98.2%), and 58.3% were female. A total of 108 participants were included in the study, and using the classification battery described below, 47 participants were classified as cognitively intact, 31 as amnestic MCI (single or multidomain), and 30 as mild dementia due to probable AD. Detailed demographics of the participants are provided in Table 1.
Demographics and cognitive and imaging outcomes

Table 1 Long description
The table presents a comparison of demographics and cognitive and imaging outcomes for participants in a study on cognitive disorders. It includes data for three groups: Intact, MCI, and AD, with a total of 108 participants. The table has 18 rows and 6 columns, with headers for Variable, Intact (N = 47), MCI (N = 31), AD (N = 30), Total (N = 108), and p-value. Key variables include sex, race, age, education, WRA-T4 reading, MMSE, CDR global score, WMS-R, mean head motion, total brain volume, RBANS index, immediate memory, visuospatial/constructional, language, attention, delayed memory, and RBANS total scale. Notable trends include differences in age, education, cognitive scores, and brain volume among the groups. The p-values indicate statistical significance for various variables.
Data are presented as means ± standard deviations [min–max] unless otherwise noted. For cognitive test scores, MMSE and WMS-R are raw scores, and WRAT-4 and RBANS are standard scores (M = 100, SD = 15). Between-group differences in sex and race distributions were calculated using Pearson’s Chi-Square. Post hoc Bonferroni test (p < .05).
*Intact vs. MCI.
**Intact vs. AD.
***AD vs. MCI.
Intact = cognitively intact; AD = Alzheimer’s disease; CDR = Clinical Dementia Rating Scale; MCI = mild cognitive impairment; MMSE = Mini-Mental Status Examination; RBANS = Repeatable Battery for the Assessment of Neuropsychological Status; WMS-R = Wechsler Memory Scale-Revised Logical Memory II Paragraph A; WRAT-4 = Wide Range Achievement Test 4th edition.
Exclusion criteria included enrollment in a clinical drug trial related to anti-amyloid agents, medical comorbidities likely to affect cognition (e.g., neurological conditions, current severe depression, substance abuse, and major psychiatric conditions), or the inability to complete neuroimaging visits (MRI or PET). Additional exclusion criteria included elevated depression as indicated by a score of greater than 5 on the 15-item Geriatric Depression Scale (Yesavage et al., Reference Yesavage, Brink, Rose, Lum, Huang, Adey and Leirer1982) and moderate or severe dementia as indicated by a global Clinical Dementia Rating score of 2 or greater or a Mini-Mental Status Examination (Folstein et al., Reference Folstein, Folstein and McHugh1975) score of less than 20.
Group assignment and measures
Baseline testing was used to assign participants to a participant group (cognitively intact, MCI, or AD) according to the Alzheimer’s Disease Neuroimaging Initiative (ADNI2) classification battery, which included the Mini-Mental Status Examination (Folstein et al., Reference Folstein, Folstein and McHugh1975), the Clinical Dementia Rating Scale (Morris, Reference Morris1993), and the Wechsler Memory Scale-Revised (Wechsler, Reference Wechsler1987) Logical Memory II Paragraph A. The AD group consisted of individuals with mild dementia due to probable AD. Mean premorbid intellectual functioning was assessed using the Reading subtest of the Wide Range Achievement Test – version 4 (Wilkinson & Robertson, Reference Wilkinson and Robertson2006). Additional baseline neuropsychological testing included the RBANS, a concise neuropsychological screening tool utilized to evaluate various cognitive domains, including attention, language, visuospatial/constructional skills, as well as both immediate and delayed memory (Randolph et al., Reference Randolph, Tierney, Mohr and Chase1998). RBANS Index scores use age-adjusted normative comparisons to produce standard scores (M = 100, SD = 15), where higher scores reflect better cognition. All RBANS Index scores, as well as Total Scale scores, were included in the analysis.
Imaging data
Approximately 7 days (7.0 ± 0.8 days) after the baseline testing visit, imaging data were acquired at the Utah Center for Advanced Imaging Research using a Siemens Prisma 3 Tesla MRI scanner (80 mT/m gradients) with a 64-channel head coil. Structural images consisted of a MP2RAGE sequence (TR = 5000 ms; TE = 2.93 ms; flip angles = 4° and 5°, FOV = 256 mm, 176 sagittal slices, resolution = 1.0 mm isotropic; TI1 = 700 ms; TI2 = 2030 ms). Resting-state functional images were acquired using a multi-band EPI sequence (TR = 737 ms; TE = 33.2 ms; flip angle = 52°; FOV = 208 mm; 72 axial slices; resolution = 2.0 mm isotropic; multi-band acceleration factor = 8; partial Fourier = 6/8; bandwidth = 2004 Hz/Px). Two resting-state acquisitions of 1220 volumes (time series duration = 15 min 09 s each; one left-to-right and one right-to-left) were acquired along with pulse and respiration waveform data. Before resting-state scan acquisition, participants were instructed to rest but remain awake with their eyes open while letting their thoughts wander. No visual fixation stimuli were used.
Imaging analysis
Structural data were processed using FreeSurfer (v6.0.0), which is documented and freely available for download (http://surfer.nmr.mgh.harvard.edu/). For technical details related to FreeSurfer data analysis, see (Fischl & Dale, Reference Fischl and Dale2000; Fischl et al., Reference Fischl, Salat, Busa, Albert, Dieterich, Haselgrove, van der Kouwe, Killiany, Kennedy, Klaveness, Montillo, Makris, Rosen and Dale2002, Reference Fischl, van der Kouwe, Destrieux, Halgren, Segonne, Salat, Busa, Seidman, Goldstein, Kennedy, Caviness, Makris, Rosen and Dale2004). Gray matter atrophy can influence functional connectivity results, which is commonly observed in aging populations (Binnewijzend et al., Reference Binnewijzend, Schoonheim, Sanz-Arigita, Wink, van der Flier, Tolboom, Adriaanse, Damoiseaux, Scheltens, van Berckel and Barkhof2012; Damoiseaux et al., Reference Damoiseaux, Prater, Miller and Greicius2012; Hafkemeijer et al., Reference Hafkemeijer, Moller, Dopper, Jiskoot, Schouten, van Swieten, van der Flier, Vrenken, Pijnenburg, Barkhof, Scheltens, van der Grond and Rombouts2015; Passamonti et al., Reference Passamonti, Tsvetanov, Jones, Bevan-Jones, Arnold, Borchert, Mak, Su, OBrien and Rowe2019). As such, the FreeSurfer output variable, BrainSegNotVent, was extracted for each study participant as a measure of total brain volume and used as a covariate in functional connectivity analyses. Resting-state fMRI data were analyzed using SPM12 software (Wellcome Trust, London) for MATLAB (MathWorks, Natick MA). The processing pipeline involved motion correction of resting-state fMRI images (realignment), coregistration of the realigned functional images to the structural image (MP2RAGE), segmentation of the MP2RAGE, and normalization of the coregistered MP2RAGE and functional images to an MNI152 template. Motion parameters from the realignment step were stored for later volume censoring. All further analyses of resting-state were conducted in MNI space. Phase-shifted soft tissue correction (PSTCor) (Anderson et al., Reference Anderson, Druzgal, Lopez-Larson, Jeong, Desai and Yurgelun-Todd2011) was then used to regress six detrended participant motion parameters: soft tissues of the face and calvarium, degraded white matter, degraded cerebrospinal fluid, and physiological waveforms (Birn et al., Reference Birn, Smith, Jones and Bandettini2008). Volumes before and after root-mean-square head motion greater than 0.5 mm were censored using motion parameters provided by the processing pipeline (Power et al., Reference Power, Barnes, Snyder, Schlaggar and Petersen2012). There were no significant differences in mean head motion between groups (see Table 1). Resting-state analysis was conducted on 116 participants. Participants who had less than 50% of the original 1220 volumes (for each scan) remaining following motion censoring were removed. After the removal of eight participants due to motion censoring, 108 participants were included in the present analysis.
After preprocessing, resting-state functional MRI data were analyzed using a 17-network brain parcellation scheme (Yeo et al., Reference Yeo, Krienen, Sepulcre, Sabuncu, Lashkari, Hollinshead, Roffman, Smoller, Zollei, Polimeni, Fischl, Liu and Buckner2011), as previously described (King & Anderson, Reference King and Anderson2018). This parcellation includes visual, somatomotor, dorsal attention, salience, limbic, executive control, and default mode networks. This parcellation is a finer-grained parcellation of the more widely used 7-network parcellation (Yeo et al., Reference Yeo, Krienen, Sepulcre, Sabuncu, Lashkari, Hollinshead, Roffman, Smoller, Zollei, Polimeni, Fischl, Liu and Buckner2011). The 17-network parcellation includes subdivisions of the larger networks, allowing for within-network analyses in addition to between-network. In addition, the finer-grained parcellation minimizes the risk of averaging time courses across large, potentially heterogeneous regions. Time series data from each of the 17 distributed brain networks were extracted for analysis, with each network treated as a single region of interest (ROI). We quantified functional connectivity as the Pearson correlation between regional BOLD time series. This method is supported by extensive evidence showing that correlation-based functional connectivity captures key large-scale systems and task networks (Smith et al., Reference Smith, Fox, Miller, Glahn, Fox, Mackay, Filippini, Watkins, Toro, Laird and Beckmann2009), is reproducible and reliable with modern denoising techniques (Noble et al., Reference Noble, Scheinost and Constable2019), and enables robust prediction and individual identification (Finn et al., Reference Finn, Shen, Scheinost, Rosenberg, Huang, Chun, Papademetris and Constable2015). Additionally, at the macroscale, resting-state BOLD dynamics are well approximated by linear models, making linear association a logical and interpretable measure (Nozari et al., Reference Nozari, Bertolero, Stiso, Caciagli, Cornblath, He, Mahadevan, Pappas and Bassett2024). For each subject, a matrix consisting of Fisher-transformed Pearson correlation coefficients representing functional connectivity for 17 × 17 networks was created by averaging across both resting-state scans. Each matrix contains the 136 unique inter-network edges.
Statistical analysis
A one-way analysis of variance (ANOVA) was used to detect between-group differences for continuous measures with post hoc Bonferroni tests to correct for multiple comparisons. A χ 2 test was used to compare frequency distributions of sex and race across groups. Non-imaging-based statistical analyses were performed using SPSS (version 27.0; SPSS, Chicago, IL, USA).
The primary analysis evaluated RBANS Index (Attention, Language, Immediate Memory, Delayed Memory, Visuospatial/Constructional) and Total Scale scores and functional connectivity across the dementia spectrum (cognitively intact, MCI, and AD treated as ordinal variables). Analyses were conducted in MATLAB (MathWorks, Natick MA). For each cognitive measure and each of the 136 edges, partial correlation values were estimated between functional connectivity and cognition, controlling for mean head motion, age, sex, and total brain volume. These covariates are all well-established sources of variance in resting-state functional connectivity and cognition, which could otherwise confound the relationship between them. Aging changes large-scale network connections and is associated with cognitive decline (Andrews-Hanna et al., Reference Andrews-Hanna, Snyder, Vincent, Lustig, Head, Raichle and Buckner2007; Ferreira & Busatto, Reference Ferreira and Busatto2013; Geerligs et al., Reference Geerligs, Renken, Saliasi, Maurits and Lorist2014). Sex differences also influence functional connectivity patterns and cognition, and these are robust enough that functional connectivity alone can classify sex (Satterthwaite et al., Reference Satterthwaite, Wolf, Roalf, Ruparel, Erus, Vandekar, Gennatas, Elliott, Smith, Hakonarson, Verma, Davatzikos, Gur and Gur2014; Weis et al., Reference Weis, Patil, Hoffstaedter, Nostro, Yeo and Eickhoff2019; Zhang et al., Reference Zhang, Dougherty, Baum, White and Michael2018). Even submillimeter head motion biases functional connectivity estimates, typically inflating local correlations and decreasing long-range correlations, so motion must be modeled at the individual level even if group means do not differ (Ciric et al., Reference Ciric, Wolf, Power, Roalf, Baum, Ruparel, Shinohara, Elliott, Eickhoff, Davatzikos, Gur, Gur, Bassett and Satterthwaite2017; Power et al., Reference Power, Barnes, Snyder, Schlaggar and Petersen2012; Satterthwaite et al., Reference Satterthwaite, Elliott, Gerraty, Ruparel, Loughead, Calkins, Eickhoff, Hakonarson, Gur, Gur and Wolf2013; Van Dijk et al., Reference Van Dijk, Sabuncu and Buckner2012). Total brain volume was included to account for global atrophy effects that are closely linked to both cognitive impairment and AD stage. Structural MRI markers of neurodegeneration, including total brain and cortical volume loss, are key features of AD pathology and reflect clinical severity (Fox et al., Reference Fox, Scahill, Crum and Rossor1999; Jack et al., Reference Jack, Bennett, Blennow, Carrillo, Dunn, Haeberlein, Holtzman, Jagust, Jessen, Karlawish, Liu, Molinuevo, Montine, Phelps, Rankin, Rowe, Scheltens, Siemers, Snyder and Silverberg2018; Whitwell et al., Reference Whitwell, Przybelski, Weigand, Knopman, Boeve, Petersen and Jack2007). Resting-state studies in AD explicitly associate gray matter atrophy with functional connectivity, demonstrating that connectivity differences are not solely due to tissue loss (Binnewijzend et al., Reference Binnewijzend, Schoonheim, Sanz-Arigita, Wink, van der Flier, Tolboom, Adriaanse, Damoiseaux, Scheltens, van Berckel and Barkhof2012; Damoiseaux et al., Reference Damoiseaux, Prater, Miller and Greicius2012; Hafkemeijer et al., Reference Hafkemeijer, Moller, Dopper, Jiskoot, Schouten, van Swieten, van der Flier, Vrenken, Pijnenburg, Barkhof, Scheltens, van der Grond and Rombouts2015; Passamonti et al., Reference Passamonti, Tsvetanov, Jones, Bevan-Jones, Arnold, Borchert, Mak, Su, OBrien and Rowe2019). Notably, we did not include education in our model, despite significant group differences, because education can be viewed as a proxy of cognitive reserve, which may moderate how pathology translates into measured cognition (Bennett et al., Reference Bennett, Wilson, Schneider, Evans, Mendes de Leon, Arnold, Barnes and Bienias2003; Roe et al., Reference Roe, Mintun, D’Angelo, Xiong, Grant and Morris2008; Stern, Reference Stern2012). Furthermore, adjusting for this potential mediator can introduce overadjustment bias (Schisterman et al., Reference Schisterman, Cole and Platt2009). Partial correlations (r) were computed with Pearson correlation on residuals. Results include r as the effect size, the two-sided p-value, and a 95% confidence interval (CI) using Fisher’s z transformation with standard error ${\rm SE}=1/\sqrt{{n}-{k}-3}$
, where n is the complete-case sample size and k is the number of covariates (here, k = 4). Correction for multiple comparisons across the 136 edges was completed using the Benjamini-Hochberg procedure at q < .05. Uncorrected results (p < .05) are provided in the form of figures and tables in the Supplementary Material for all RBANS Index and Total Scale findings.
${\rm SE}=1/\sqrt{{n}-{k}-3}$
, where n is the complete-case sample size and k is the number of covariates (here, k = 4). Correction for multiple comparisons across the 136 edges was completed using the Benjamini-Hochberg procedure at q < .05. Uncorrected results (p < .05) are provided in the form of figures and tables in the Supplementary Material for all RBANS Index and Total Scale findings.
Group differences. To test functional connectivity differences between diagnostic groups, linear models for each edge were fit with functional connectivity as the dependent variable and group plus covariates (mean head motion, age, sex total brain volume) as predictors. Analyses included unique, unordered pairwise contrasts ordered by clinical severity (AD vs intact, AD vs MCI, and MCI vs intact), with the group factor re-levelled so the less severe level served as the reference. The t-statistic with degrees of freedom, two-sided p-value, FDR-adjusted q-value (within-contrast across 136 edges), and a standardized effect size,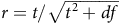 ${r}={t}/\sqrt{{t}^{2}+{df}}$
, with confidence intervals, are reported for each significant edge. Full results (p < .05, uncorrected) are provided in the Supplementary Material for all edges.
${r}={t}/\sqrt{{t}^{2}+{df}}$
, with confidence intervals, are reported for each significant edge. Full results (p < .05, uncorrected) are provided in the Supplementary Material for all edges.
Results
No differences in sex, race, mean head motion, or mean premorbid intellectual functioning were found between the three diagnostic groups (see Table 1 for details). The AD group was older than the intact and MCI groups, and the MCI group had less education than the intact group (see Table 1). All RBANS Index and Total Scale scores were significantly lower in AD and MCI participants compared to cognitively intact individuals. The AD group performed significantly worse than the MCI group on Immediate and Delayed Memory Indexes and Total Scale scores (see Table 1). Total brain volumes were significantly smaller in those with MCI and AD compared to the intact participants. No significant difference in brain volume was found between the MCI and AD groups.
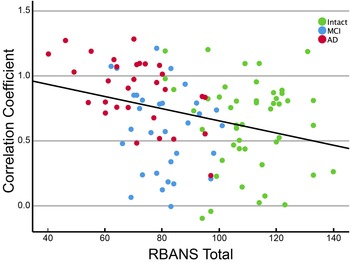
In the full study sample, RBANS Attention Index demonstrated a significant negative correlation with functional connectivity, suggesting that lower (worse) RBANS Index scores are associated with stronger functional connectivity between regions. This pattern of associations was found within subcomponents of the central executive network and between central executive and salience, default mode, and limbic subcomponent networks. Within the central executive network, RBANS Attention scores were negatively associated with functional connectivity between the lateral frontoparietal and medial superior parietal (r = −.35, [95% CI = −.51, −.17], p < .001, qFDR = .013) and medial frontoparietal (r = −.31, [95% CI = −.47, −.12], p = .002, qFDR = .046) regions. RBANS Attention scores were also negatively associated with functional connectivity between subcomponents of the salience and central executive networks (anterior ventral attention with lateral frontoparietal (r = −.35, [95% CI = −.51, −.17], p < .001, qFDR = .013) and medial superior parietal (r = −.30, [95% CI = −.47, −.12], p = .002, qFDR = .046). This pattern was also found between subcomponents of the central executive and default mode networks (lateral frontoparietal and dorsal default mode, r = −.37, [95% CI = −.52, −.19], p < .001, qFDR = .013), and between subcomponents of the central executive and orbitofrontal limbic networks (medial superior parietal and orbitofrontal limbic, r = −.30, [95% CI = −.46, −.11], p = .002, qFDR = .047) (see Figure 1A). RBANS Total Scale scores demonstrated a similar pattern between the central executive (lateral frontoparietal) and the dorsal default mode networks (r = −.38, [95% CI = −.53, −.20], p < .001, qFDR = .010; see Figures 1B and 2). Functional connectivity was not significantly correlated with any other RBANS index scores when correcting for multiple comparisons. However, uncorrected results demonstrated a similar pattern of primarily lower RBANS Index scores with increasing functional connectivity in central executive and default mode networks (see Supplementary Material Figures 1–6 and associated Tables).
Across diagnostic groups (Intact-MCI-AD), RBANS Attention Index (A) and Total (B) Scores were negatively associated with resting-state functional connectivity values across a 17-network parcellation (qFDR < .05). Data represent partial correlation coefficients controlling for the effects of age, sex, mean head motion, and total gray matter volume. RBANS = Repeatable Battery for the Assessment of Neuropsychological Status; Attn. = Attention; CEN = Central Executive Network; DMN = Default Mode Network; SN = Salience Network.

Figure 1 Long description
A heat map displays partial correlation coefficients between RBANS Attention Index and Total Scores and resting-state functional connectivity across a 17-network parcellation. The grid layout features rows and columns labeled with different brain networks. The color scale ranges from blue to red, indicating the magnitude of correlation coefficients, with blue representing lower values and red representing higher values. Notable clusters of blue and red cells indicate significant negative associations between RBANS scores and connectivity values. The data control for age, sex, mean head motion, and total gray matter volume. The heat map highlights specific brain networks such as the Default Mode Network, Central Executive Network, and Salience Network, showing varying degrees of correlation.
Simple scatter plot representing the relationship between RBANS Total Scores (x-axis) and functional connectivity Fisher-transformed correlation coefficient values between the lateral frontoparietal (central executive) and dorsal default mode networks (y-axis).

Figure 2 Long description
A scatter plot representing the relationship between RBANS Total Scores on the x-axis and functional connectivity Fisher-transformed correlation coefficient values on the y-axis. The plot includes dozens of data points, with values for RBANS Total Scores ranging from approximately 40 to 140 and correlation coefficients ranging from 0 to 1.5. Data points are color-coded: green for Intact, blue for MCI, and red for AD. A regression line is present, indicating a negative correlation between RBANS Total Scores and correlation coefficients. The data points show a spread with no distinct clusters, and the regression line suggests a general trend of decreasing correlation coefficients with increasing RBANS Total Scores. All values are approximated.
To assist in interpreting dimensional effects in relation to diagnostic categories, an exploratory post hoc analysis of between-group differences was conducted. For each network connection, a linear regression model was fitted, with diagnosis (cognitively intact, MCI, AD) as a categorical predictor and the same covariates as in the primary model. From these models, adjusted pairwise contrasts were derived (cognitively intact vs MCI, cognitively intact vs AD, and MCI vs AD). No significant differences were found between cognitively intact and MCI participants. A significant increase in connectivity was observed in the AD group compared to MCI between the default mode and central executive networks (dorsal default mode and lateral frontoparietal, t(101) = 4.38, p < .001, qFDR = .004, r = .40 [95% CI = .22, .55], and dorsal default mode and medial frontoparietal, t(101) = 3.36, p = .001, qFDR = .049, r = .32 [95% CI = .13, .48]) and between the central executive and salience networks (lateral frontoparietal and anterior ventral attention, t(101) = 4.03, p < .001, qFDR = .007, r = .37 [95% CI = .19, .53]). A similar pattern of increased functional connectivity between the central executive and default mode and salience networks emerged when comparing the AD group to cognitively intact individuals, but without involvement of the medial frontoparietal subcomponent (dorsal default mode and lateral frontoparietal, t(101) = 4.55, p < .001, qFDR = .002, r = .41 [95% CI = .25, .56]; lateral frontoparietal and anterior ventral attention, t(101) = 3.68, p < .001, qFDR = .026, r = .34 [95% CI = .16, .50]) (see Supplementary Material Figures 7–9 and associated Table).
Discussion
This study explored the relationship between cognitive functioning, as assessed with the RBANS, and resting-state functional connectivity across 17 large-scale intrinsic functional brain networks in older adults with intact cognitive function, amnestic MCI, and mild AD. Across the dementia spectrum, multilinear regression analyses revealed an association between lower (poorer) RBANS Attention Index scores with increased functional connectivity in default mode, central executive, limbic, and ventral attention (salience) networks. RBANS Total Scale scores were also negatively correlated with functional connectivity strength between the lateral frontoparietal (central executive) and the dorsal default mode networks. These functional brain networks are critical for numerous cognitive functions, including memory, attention, emotional processing, and cognitive control. Taken together, these findings suggest that disruptions in functional connectivity within and between these networks may be associated with cognitive decline in individuals along the dementia spectrum.
An exploratory analysis of between-group functional connectivity revealed no significant differences between cognitively intact and MCI participants. Such a null finding has also been reported in the literature, with several resting-state fMRI studies observing no significant differences in static functional connectivity between controls and individuals with amnestic MCI (Eyler et al., Reference Eyler, Elman, Hatton, Gough, Mischel, Hagler, Franz, Docherty, Fennema-Notestine, Gillespie, Gustavson, Lyons, Neale, Panizzon, Dale, Kremen and Perneczky2019; Malotaux et al., Reference Malotaux, Dricot, Quenon, Lhommel, Ivanoiu and Hanseeuw2022; Weiler et al., Reference Weiler, Teixeira, Nogueira, de Campos, Damasceno, Cendes and Balthazar2014). Our study also found a significant increase in connectivity in the AD group compared to MCI and cognitively intact participants between the default mode and central executive networks. Additionally, increased connectivity between the ventral attention (salience) and central executive networks was observed in AD compared to MCI. Atypical (hypo- or hyper-) functional connectivity in both the central executive and the default mode networks has been widely reported in individuals with AD (Binnewijzend et al., Reference Binnewijzend, Schoonheim, Sanz-Arigita, Wink, van der Flier, Tolboom, Adriaanse, Damoiseaux, Scheltens, van Berckel and Barkhof2012; Damoiseaux et al., Reference Damoiseaux, Prater, Miller and Greicius2012; Gour et al., Reference Gour, Felician, Didic, Koric, Gueriot, Chanoine, Confort-Gouny, Guye, Ceccaldi and Ranjeva2014; Greicius et al., Reference Greicius, Srivastava, Reiss and Menon2004; Grieder et al., Reference Grieder, Wang, Dierks, Wahlund and Jann2018; Jones et al., Reference Jones, Graff-Radford, Lowe, Wiste, Gunter, Senjem, Botha, Kantarci, Boeve, Knopman, Petersen and Jack2017; Jones et al., Reference Jones, Knopman, Gunter, Graff-Radford, Vemuri, Boeve, Petersen, Weiner and Jack2016; Wiepert et al., Reference Wiepert, Lowe, Knopman, Boeve, Graff-Radford, Petersen, Jack and Jones2017). In a longitudinal study, Damoiseaux and colleagues also reported increased functional connectivity in the anterior and ventral default mode networks and decreased connectivity in the posterior default mode network in AD compared to controls at baseline (Damoiseaux et al., Reference Damoiseaux, Prater, Miller and Greicius2012). At a follow-up scan 2–4 years later, all three default mode subnetworks demonstrated decreased functional connectivity in AD compared to controls, suggesting an initial compensatory mechanism in early AD. Gour and colleagues (Gour et al., Reference Gour, Felician, Didic, Koric, Gueriot, Chanoine, Confort-Gouny, Guye, Ceccaldi and Ranjeva2014) also found mixed directional functional connectivity in AD compared to controls: increased in the dorsolateral prefrontal cortex and in the left antero-medial temporal network but decreased in default mode and left and right attention networks. Like the present study, Damoiseaux and Gour also controlled for gray matter volume (Damoiseaux et al., Reference Damoiseaux, Prater, Miller and Greicius2012; Gour et al., Reference Gour, Felician, Didic, Koric, Gueriot, Chanoine, Confort-Gouny, Guye, Ceccaldi and Ranjeva2014).
In the early stages of cognitive decline, decreases in functional connectivity may represent an initial response to neuronal dysfunction or as the direct result of neuronal damage. Later increases in functional connectivity (late MCI or early AD) may indicate an attempted compensatory response intended to maintain cognitive functioning. For example, increased connectivity within the default mode network has been associated with semantic memory deficits in patients with MCI, suggesting that these increases may be maladaptive or compensatory (Gardini et al., Reference Gardini, Venneri, Sambataro, Cuetos, Fasano, Marchi, Crisi and Caffarra2015). However, this compensation may come at the expense of increased metabolic demand and inefficiency and may ultimately fail as dementia progresses to AD. Notably, aberrant hyperconnectivity within the default mode network is characteristic of AD, potentially signaling the propagation of amyloid pathology that undermines network integrity (Jones et al., Reference Jones, Graff-Radford, Lowe, Wiste, Gunter, Senjem, Botha, Kantarci, Boeve, Knopman, Petersen and Jack2017; Jones et al., Reference Jones, Knopman, Gunter, Graff-Radford, Vemuri, Boeve, Petersen, Weiner and Jack2016; Roemer-Cassiano et al., Reference Roemer-Cassiano, Wagner, Evangelista, Rauchmann, Dehsarvi, Steward, Dewenter, Biel, Zhu, Pescoller, Gross, Perneczky, Malpetti, Ewers, Schöll, Dichgans, Höglinger, Brendel, Jäkel and Franzmeier2025). The cascading network failure model of AD suggests a progressive systems-level breakdown of large-scale functional networks, rather than solely focal pathology. Using resting-state fMRI across the dementia spectrum, Jones and colleagues demonstrated that disruption starts within posterior default mode network subsystems, with early increases in connectivity within and between default mode network hubs and other control networks. This is interpreted as metabolically costly compensatory hyperconnectivity, followed by a progression to widespread hypoconnectivity and network disconnection as the functional networks further decompensate (Jones et al., Reference Jones, Knopman, Gunter, Graff-Radford, Vemuri, Boeve, Petersen, Weiner and Jack2016). Multimodal PET studies support this model by showing that functional network failure is closely linked to tau pathology, with amyloid serving as a partial mediator of the relationship between network failure and tau deposition along connected pathways (Jones et al., Reference Jones, Graff-Radford, Lowe, Wiste, Gunter, Senjem, Botha, Kantarci, Boeve, Knopman, Petersen and Jack2017).
These disturbances in healthy network connections likely impede efficient cognitive processing, which may influence RBANS scores. Attention deficits are particularly associated with disruptions in the ventral attention (salience) network, which helps switch between internally and externally focused tasks, and the central executive network, which supports working memory and decision-making (Menon, Reference Menon2011). Increased connectivity in these networks could indicate inefficiency in managing attention-demanding tasks. Moreover, the observed trend (Intact-MCI-AD) suggests that functional connectivity changes may progress simultaneously with cognitive and functional decline. This supports the notion that increased connectivity, initially compensatory, may become maladaptive as dementia develops.
The RBANS Attention Index score assesses basic attention processes and processing speed. Increased functional connectivity in default mode, central executive, limbic, and ventral attention (salience) networks correlated with lower RBANS Attention Index scores. The default mode, central executive, and ventral attention (salience) networks are all central to attention processes and processing speed (Hellyer et al., Reference Hellyer, Shanahan, Scott, Wise, Sharp and Leech2014; Menon, Reference Menon2011; Staffaroni et al., Reference Staffaroni, Brown, Casaletto, Elahi, Deng, Neuhaus, Cobigo, Mumford, Walters, Saloner, Karydas, Coppola, Rosen, Miller, Seeley and Kramer2018). Effective coordination between these networks, particularly salience-driven switching between default mode and executive control states, facilitates rapid detection, evaluation, and response to stimuli, supporting focused and flexible cognitive performance (Chand et al., Reference Chand, Wu, Hajjar and Qiu2017; Cole, Reference Cole2024; Seeley et al., Reference Seeley, Menon, Schatzberg, Keller, Glover, Kenna, Reiss and Greicius2007; Sridharan et al., Reference Sridharan, Levitin and Menon2008). While, to our knowledge, this is the first study to correlate resting-state fMRI functional connectivity within and between resting-state networks with RBANS scores across the cognitive aging spectrum, alternative measures assessing attention and cognitive abilities have been investigated in the literature. For example, in a sample of early- and late-onset AD participants, Gour and colleagues found positive associations between measures of executive function, including Rey’s Complex Figure Copy performance score and the Wechsler Memory Scale – Third Edition forward and backward visuospatial span score, and functional connectivity in the dorsolateral prefrontal network (Gour et al., Reference Gour, Felician, Didic, Koric, Gueriot, Chanoine, Confort-Gouny, Guye, Ceccaldi and Ranjeva2014). They also found a positive correlation between visual recognition memory, using delayed recognition performance scores from the Delayed Matching to Sample Task 48, and the antero-medial temporal network (Gour et al., Reference Gour, Felician, Didic, Koric, Gueriot, Chanoine, Confort-Gouny, Guye, Ceccaldi and Ranjeva2014). Contreras et al. found a significant positive relationship between verbal episodic memory and increased connectivity between the frontoparietal and default mode networks (Contreras et al., Reference Contreras, Goni, Risacher, Amico, Yoder, Dzemidzic, West, McDonald, Farlow, Sporns and Saykin2017) in a group of older adults. In another study that included older adults with MCI and AD, significant negative correlations were found between Mini-Mental Status Examination, Montreal Cognitive Assessment, and California Verbal Learning Test scores and functional connectivity strength between the left dorsal frontal (central executive) and right lateral temporal cortices (default mode network) (Li et al., Reference Li, Wang, Li, Sun, Sheng, Li, Li, Yu, Chen, Hu, Jing, Wang, Li, Jessen, Xia and Han2016). Finally, using the 11-item Alzheimer’s Disease Assessment Scale – Cognitive Subscale score as a measure of overall cognitive function, Lin et al. found that resting-state functional connectivity, measured using both Pearson’s r correlation and accordance/discordance measures, could significantly predict individual differences in a heterogeneous sample that included cognitively normal controls, individuals with MCI, and individuals with AD (Lin et al., Reference Lin, Rosenberg, Yoo, Hsu, O’Connell and Chun2018). Overall, these findings suggest that functional connectivity patterns in specific brain networks are linked to cognitive performance across aging and dementia; however, the directionality of these associations remains equivocal and uncertain.
Inconsistencies in directionality across studies often arise from whether functional connectivity is within- or between-network, whether global signal regression was performed (as it can invert or induce anticorrelations), and from motion-handling and other denoising choices that influence brain–behavior relationships (Ciric et al., Reference Ciric, Wolf, Power, Roalf, Baum, Ruparel, Shinohara, Elliott, Eickhoff, Davatzikos, Gur, Gur, Bassett and Satterthwaite2017; Murphy et al., Reference Murphy, Birn, Handwerker, Jones and Bandettini2009; Murphy & Fox, Reference Murphy and Fox2017; Saad et al., Reference Saad, Gotts, Murphy, Chen, Jo, Martin and Cox2012; Siegel et al., Reference Siegel, Mitra, Laumann, Seitzman, Raichle, Corbetta and Snyder2016; Smith et al., Reference Smith, Fox, Miller, Glahn, Fox, Mackay, Filippini, Watkins, Toro, Laird and Beckmann2009). These factors vary widely across studies, leading to different results regarding the directionality of connectivity findings even when examining similar constructs. Additionally, data acquisition parameters, like repetition time, phase encoding direction, and scan duration, may also impact connectivity outcomes. When interpreting conflicting results across studies, it is important to keep these various factors in mind. In the present study, networks were predefined and then evaluated to determine whether coupling among these systems relates to cognition across cognitively intact, MCI, and AD participants. The results indicated a consistent pattern: higher connectivity was associated with poorer cognitive performance. Although stronger coupling is often seen as “integration,” it can also indicate maladaptive synchronization, expanded co-activation of typically distinct systems, or over-recruitment of control circuits, which becomes inefficient as pathology progresses. In this context, “increased connectivity” represents a loss of functional specificity, or noisier, less selective communication, rather than a beneficial enhancement of information flow. The consistent direction of this association across different diagnostic groups suggests that it is unlikely to be a chance finding tied to a single disease stage.
There are limitations to the present study that deserve mention. First, the sample size per group was relatively small, and there were unequal sample sizes. Although correlations between RBANS scores and functional connectivity were not analyzed by group, the uneven distribution across groups could affect these factors. However, Figure 2 demonstrates that both connectivity values and RBANS span the entire distribution without gaps, suggesting that unequal group sampling has not negatively affected estimates across groups. Nevertheless, a larger sample size with matched subgroups should be obtained in future studies to reproduce these findings. Second, functional connectivity was defined using the Pearson correlation coefficient between and within canonical brain networks, which may not fully capture BOLD interdependencies, and alternate methods may have yielded different results (Mohanty et al., Reference Mohanty, Sethares, Nair and Prabhakaran2020). Third, gray matter atrophy may influence functional connectivity. While this study attempted to account for this variable by using gray matter volumes as a covariate in regression analyses, the relationship between gray matter atrophy and functional connectivity may be regionally specific. Future studies should employ more precise measures to control for regional atrophy. Fourth, as the parent study was focused on AD, recruitment purposefully focused on individuals presenting with memory concerns and who had amnestic cognitive profiles, both in the MCI and mild dementia states. Consistent with this, both the MCI and AD groups showed their greatest impairment on measures of episodic learning and delayed recall. However, compared to estimates of premorbid intellect (i.e., WRAT-4 Reading), they also averaged more than one standard deviation decrements in language, which would be consistent with AD. As such, the current findings do not necessarily capture the neuropsychology-connectivity associations in non-amnestic subtypes of MCI or non-AD dementias. Despite these limitations, the current study shows that an individual’s unique pattern of whole-brain functional connectivity contains essential information related to cognitive function associated with MCI and AD. These findings suggest that functional connectivity between intrinsic functional brain networks derived from resting-state fMRI may act as an emerging biomarker for AD that holds promise for early diagnosis and treatment monitoring.
Supplementary material
The supplementary material for this article can be found at https://doi.org/10.1017/S135561772610191X.
Acknowledgements
None.
Funding statement
Research reported in this publication was supported by the National Institute on Aging of the National Institutes of Health under Award Numbers K01AG075166 (King), K01AG073578 (Koppelmans), and R01AG055428 (Duff). The content is solely the responsibility of the authors and does not necessarily represent the official views of the National Institutes of Health.
Competing interests
There are no competing interests.



 Open access

