

Introduction
An attempt is made to explain the pattern of cirque glaciation in Wales and determine if it can be related to one set of climatic conditions with consistent climatic gradients. Most attempts to understand spatial distributions of glacial cirques in a given region start from the working assumption that their development was simultaneous, related to glaciers generated by a single climatic regime (Reference PorterPorter, 1964). But does the spatial variation of the snowline make sense in relation to one climate, probably repeated, or are successive climates with different patterns of glaciation required? If the hypothesis of simultaneous cirque development is rejected, a time-transgressive series of cirque glaciations with different snowlines is needed. This is clearly necessary for extensive areas such as northwestern North America or Western Europe. Wales is a small enough area for simultaneity to be possible, but varied enough that a time-transgressive hypothesis should also be considered.
An understanding of the distribution of cirques as former glacier sources is based on several working hypotheses about glacier mass balance in relation to topography and climate (Reference EvansEvans, 1990):
-
(1) Glaciers form on mountains that rise above a threshold altitude;
-
(2) The threshold altitude varies spatially with precipitation and temperature regimes;
-
(3) A lower altitude is required for glaciers on slopes with unfavourable aspects; and
-
(4) Glacier formation is also influenced by topographic details: it is less likely on mountains convex in plan and more likely in concavities, especially if they are downwind from smooth summit areas.
When glaciers occupy concavities, they often enhance them both in profile and plan, producing glacial cirques. This is believed to require warm-based ice with a surface gradient (and form) sufficient to encourage rotational flow (Reference Evans and StoddartEvans, 1997). Where ice builds up further, to form a mountain ice cap, surface gradients decline and, although some erosion may continue, the pattern of flow is unlikely to enhance cirque concavity; over-riding ice may bevel headwall crests. It seems likely that cirques are important source areas as glaciers spread and coalesce, but high plateaus and valley heads with or without cirques may also contribute to ice-sheet growth. Drastic changes in the spatial pattern of climate would be needed if cirque glaciers were not to grow while ice cover expanded greatly elsewhere.
What is expected under the two alternative hypotheses? Simultaneous cirque development implies that the spatial pattern of cirques should reflect climatic trends; cirque floors should be higher in areas that are drier or warmer and lower in those that are wetter or colder. Also, this pattern might resemble that of glaciers reconstructed for a given period in time.
The simplest hypothesis of time-transgressive cirque glaciation is: as higher mountains become covered by ice caps, and cirque development slows down because of reduced ice-surface gradients, previously unaffected lower mountains may undergo cirque glaciation. Thus, mountains of medium altitude could develop cirques if sufficiently isolated, but not if close to higher or snowier mountains. We would then expect the distribution of cirques to be spatially broader and less sensitive to altitude. Azimuthal distributions would be more complicated and the lower cirques would be in drier, warmer or more peripheral locations, away from areas of ice-cap buildup.
These ideas, arising from efforts to define glacial cirques and measure their form in a consistent way, are considered here in relation to Wales. A new dataset has been created for 228 landforms considered to be glacial cirques of various degrees of development or certainty. Attributes are recorded for cirque form and for factors such as position, geology and occupance by Late-glacial glaciers or snow beds.
Wales
Most of Wales consists of upland, with plateaus at various altitudes sometimes dissected into a rolling topography. Relief is mountainous in the interior of southern Wales and in the northwest quadrant of the country, except for the Lleyn Peninsula and the Isle of Anglesey. Thus, Wales (Fig. 1) does not fit a model of a mountain area rising to a central culmination. Cirques are eroded into rocks ranging in age from Cambrian to Carboniferous (Silesian).
Major summits in Wales, distinguishing those which support cirques from others. Altitude in metres; 50 km Ordnance Survey gridlines are indicated in the margins.

Wales, at present, has a wet and windy, mild oceanic climate (Reference Sumner, Wheeler and MayesSumner, 1997). Precipitation comes mainly from the southwest but is greatest (>2400 mm) on the mountains of northern Snowdonia, rising to > 3200 mm around Snowdon. It also reaches 2400 mm in the Rhondda (coalfield), the western Brecon Beacons and the highest mid-Wales summits. Precipitation is relatively low in the east and northeast. All but four cirques occur on mountains with precipitation > 1600 mm (1941-70 average), but this isohyet includes uplands in southwest Wales and plateaus in mid-Wales without cirques. Since the Cambrian upland is limited to roughly 190 km by 80 km, about 1.7° of latitude, mean annual temperature at a given altitude and slope should vary by no more than 0.5°C. Spatial variations in the former snowline and ELA in excess of 80 m are likely to have been controlled by precipitation, rather than temperature: the ELA would have been lower on windward ranges.
Cirque Definition
Cirques and cirque moraines provide the clearest and most widespread evidence of former local glaciation in Wales. An attempt has been made to define cirques consistently across the whole of Wales, using the criteria of Reference Evans and CoxEvans and Cox (1974), based on 1:10 000 maps with photogrammetric contours at 10 m intervals, fieldwork and previous literature. This provides definitions, variables and gradings (Fig. 2) directly comparable to those for the English Lake District (Reference Evans and CoxEvans and Cox, 1995). The best previous attempt to define cirques for the whole of Wales (and the rest of Britain) was by Reference SaleSale (1970), based on 1:63 360 maps with interpolated contours at 15.24 m intervals. Figure 2 confirms the concentration in Snowdonia, the Cadair Idris range and the Brecon Beacons, but shows that cirques are more widespread. The definition of glacial cirques will be assessed from northwest to southeast.
Distribution of cirques in Wales. Of five grades of cirque recognized, the better-developed grades (definite, well-defined and classic) are highlighted by circles: all cirques, including poor and marginal grades, are shown by crosses. 50 km Ordnance Survey gridlines are indicated in the margins.
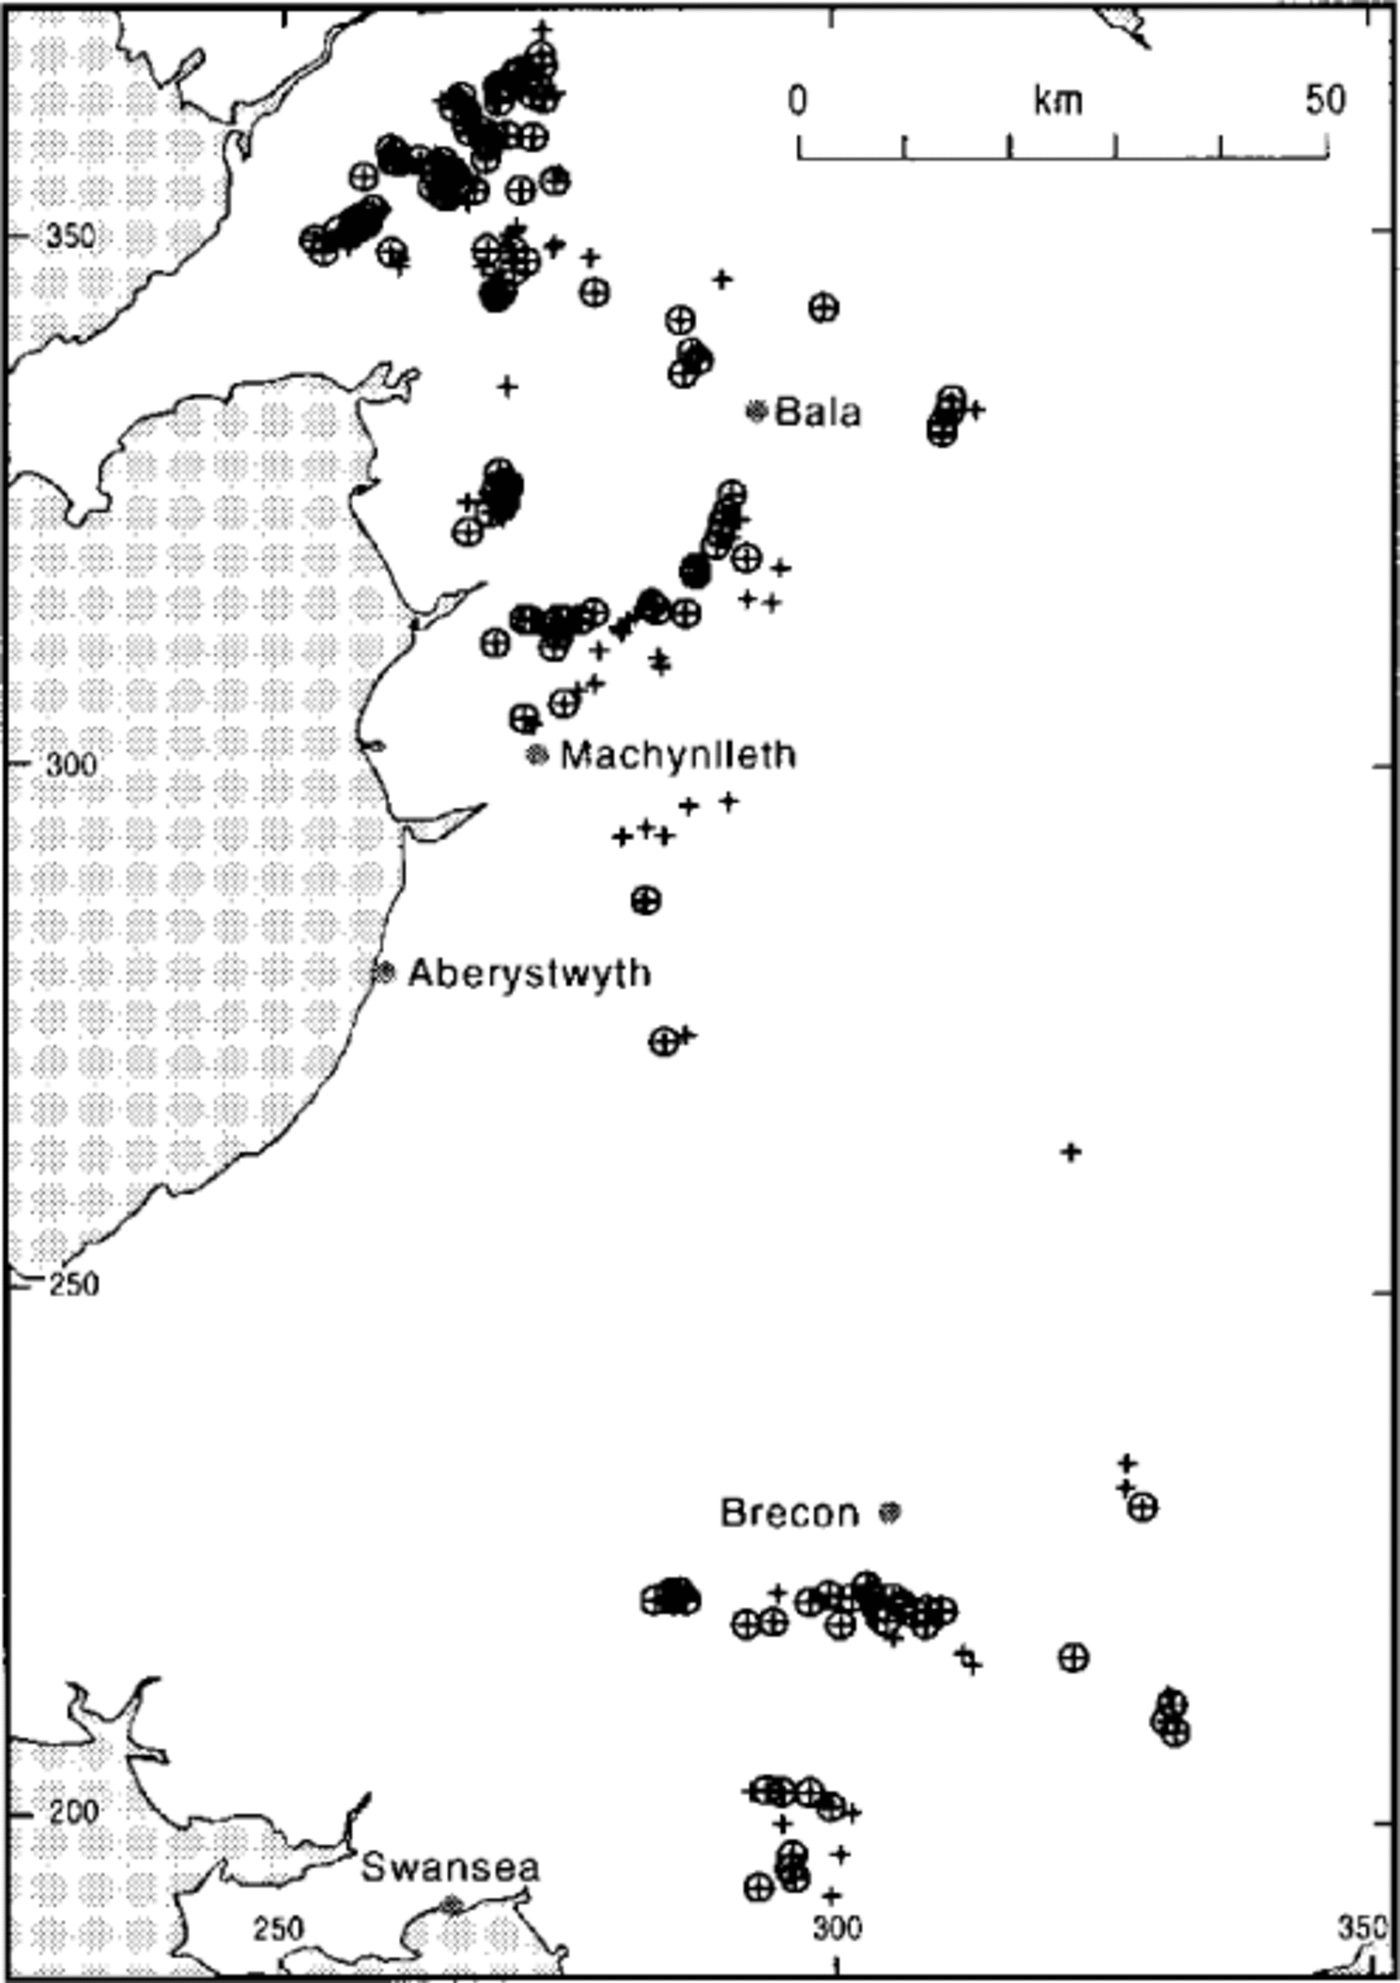
There is considerable agreement in the four ranges of northern Snowdonia, the site of most previous work on cirques and cirque moraines (Reference UnwinUnwin, 1973; Reference BennettBennett, 1990). South of Snowdon, the Moelwyn and Rhinog (Y Llethr, Fig. 1) ranges have rarely been considered: their cirques were over-ridden by the ice sheet, making definition quite difficult. Cirques northwest of Arenig Fawr and the very clear cirques south and east of Bala in the Aran and Berwyn ranges, together with those in the Black Mountains and Abergavenny areas of southeast Wales, are omitted from the maps compiled by Reference Bowen, Carter and GriffithsBowen (1982) and Reference Campbell and BowenCampbell and Bowen (1989).
By contrast, cirques farther south in mid-Wales are on mudstones and greywackes and lack the classic features of those on Ordovician volcanic rocks: they have often been overlooked or attributed to nivation. The plateau areas are lower than the classic glacial areas and cirques are scattered in the most favourable sites, rarely coalescing. Cirques varying from poor to well-defined are found north and southeast of Machynlleth (Fig. 2): some are at quite low altitudes, both in dissected terrain and at the heads of north-trending valleys on the edge of the High Plateau.
The weakness of these rocks and their production of fine debris meant that during the Late-glacial the landscape was smoothed by gelifluction; fluvial erosion has also been considerable, making cirque definition and delimitation more difficult. Reference Watson, Bowen, Carter and TaylorWatson (1968) played down the role of glaciation and saw this as a periglacial landscape, with little glacial cover in the Devensian. Reference Cave and HainsCave and Hains (1986) and Reference Campbell and BowenCampbell and Bowen (1989) have rejected this view. The features once considered nivation cirques contain local glacial till (Reference Watson, Watson and WatsonWatson and Watson, 1977) and are regarded here as poor to definite glacial cirques. Although their moraines have been modified by gelifluction and other processes, R. A. Shakesby (personal communication, 1998) regards them as very probably due to small glaciers (up to 70 m thick) during the Younger Dryas. Less distinct features are found on the north slope of the Mynydd Eppynt escarpment, at a rather low altitude, but these could be trough heads developed under an ice cap.
Cirques are well developed and easily defined on the Old Red Sandstone of the Brecon Beacons, as illustrated by Reference Shakesby and StephensShakesby (1990). At lower altitude, classic or well-defined cirques have long been recognized in the central part of the South Wales Coalfield, in the Rhondda valley and on the northern escarpment at Craig-y-Llyn (Reference Woodland and EvansWoodland and Evans, 1964; Reference Bowen and LewisBowen, 1970): these are in flat-bedded Carboniferous shales and sandstones, and may be compared with cirques in the plateau basalts of Iceland.
Evidence to test the above hypotheses will now be considered in terms of glaciation level, floor altitude, aspect distributions and Late-glacial occupation.
Glaciation Level
Initially, we may try to make sense of the pattern of Welsh cirques in relation to altitude and broad position within the massif. The glaciation level is the “critical minimum summit altitude which is necessary for a mountain to obtain (or maintain) a glacier” (Reference Østrem, Haakensen and ErikssonØstrem and others, 1981) and is applied here according to Reference EvansEvans (1990). Its application to cirques relies on each cirque having been a glacier source: this is part of the definition of a glacial cirque (Reference Evans and CoxEvans and Cox, 1974). A former (palaeo) glaciation level related to the most extensive phase of cirque glaciation can thus be defined in the same way as modern glaciation levels. For regional climatic implications, the advantage over cirque floor and ELA analyses is that further evidence is employed: absence is considered, as well as presence.
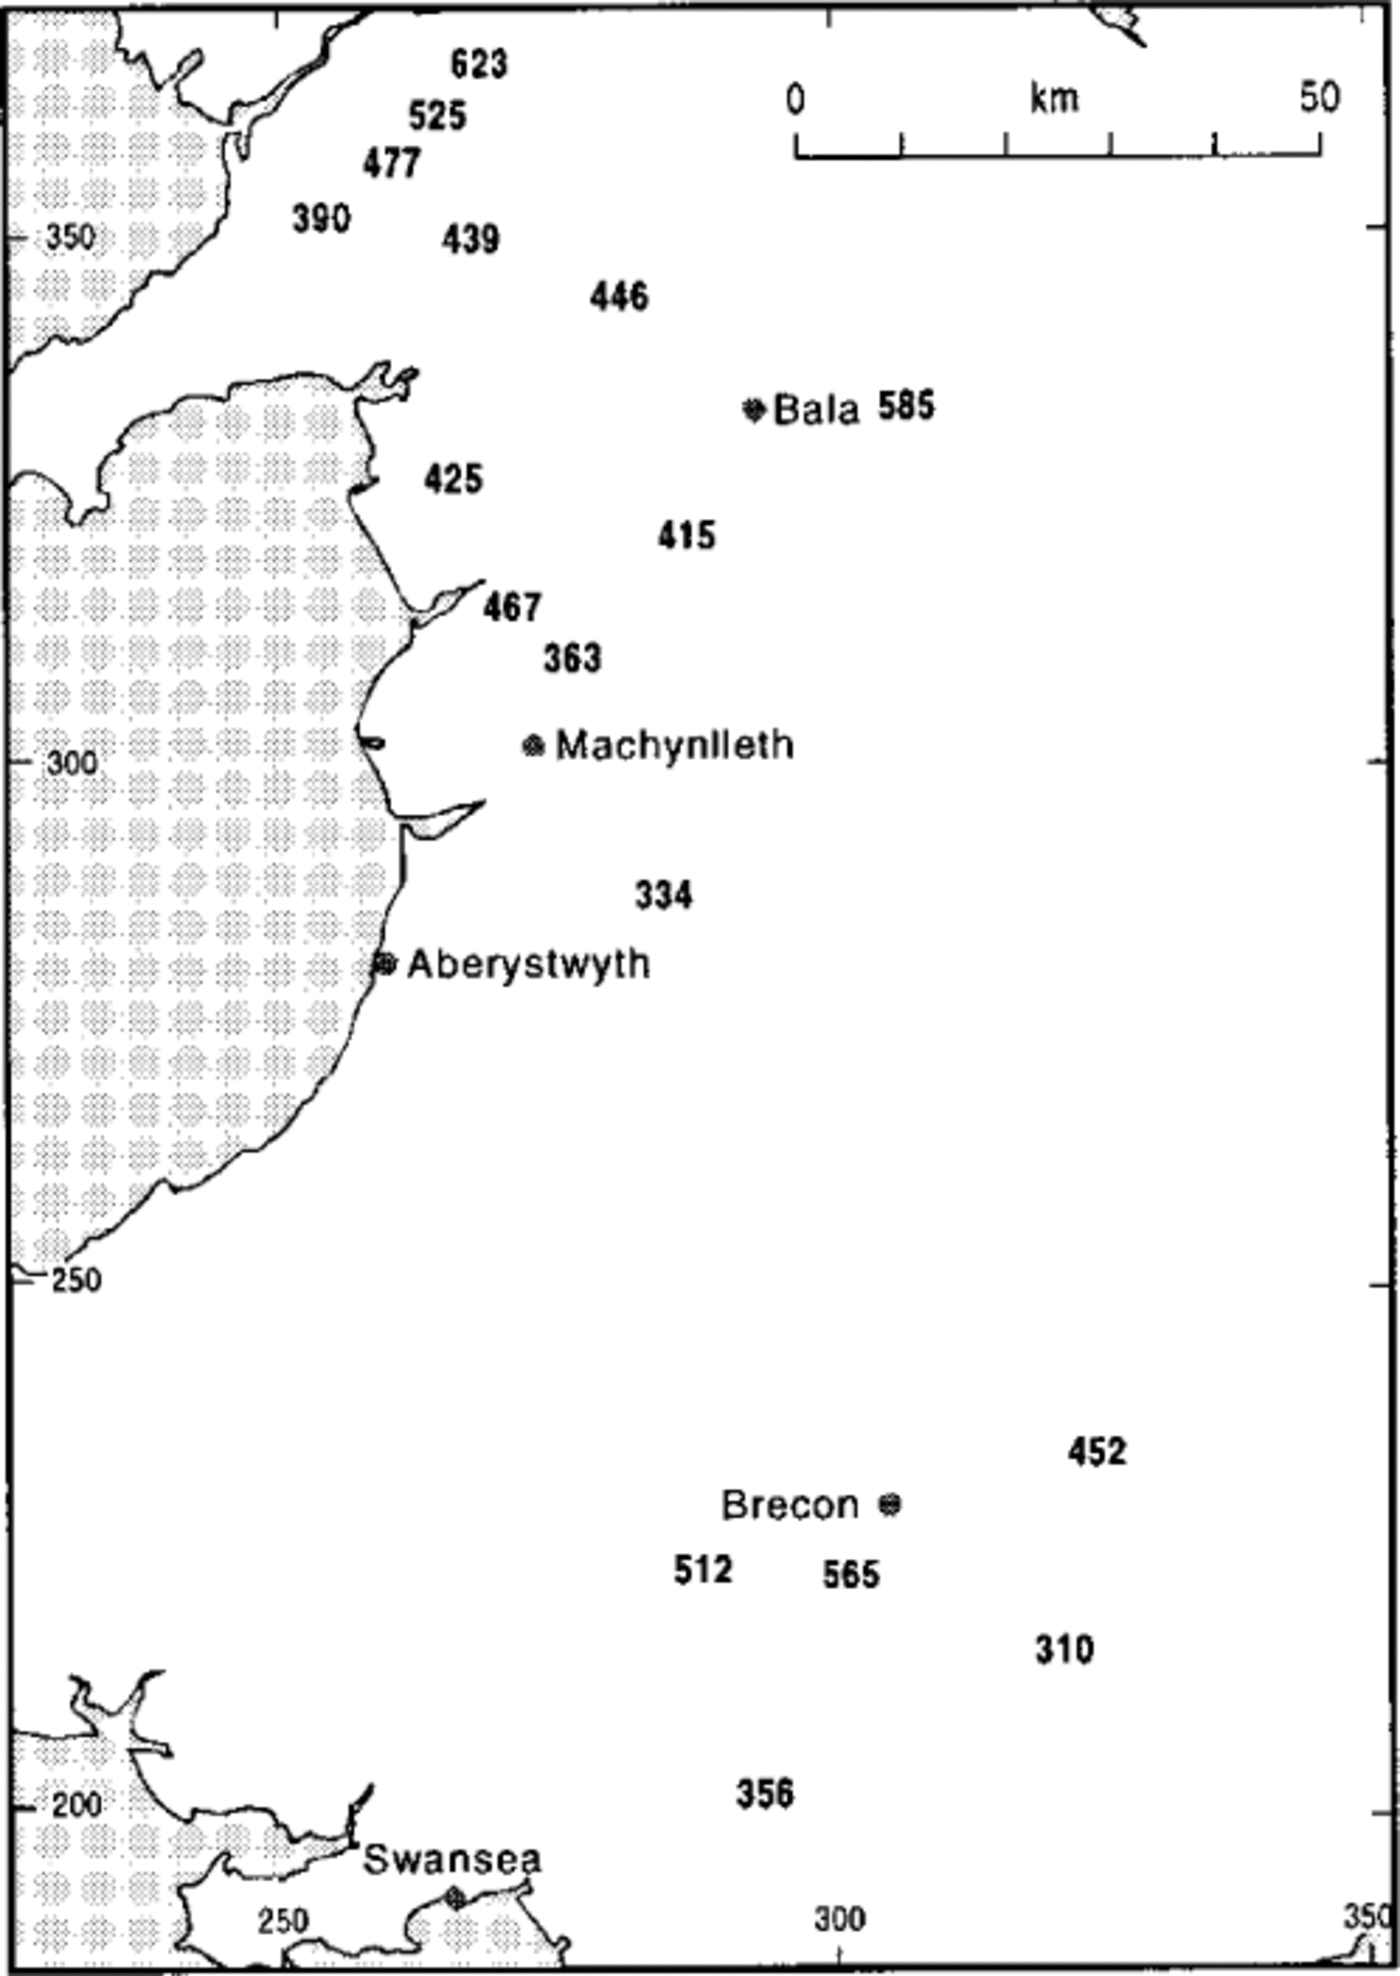
The palaeoglaciation level (PGL) implied by cirques is mapped for Wales in Figure 3. PGL definition depends on the existence of summits or crests both above and below the critical altitude to support glacial cirques: it involves detailed interpretation of topographic maps, considering where cirque development might have been feasible topographically and whether summits some 2 km distant might have contributed wind-blown snow to a cirque. Determination is thus more precise in well-dissected areas of varied altitude, but there are problems in areas of rounded, connected summits (as in northernmost Snowdonia) and plateaus (as in mid-Wales). The absence of cirques on Rhobell Fawr (734 m a.s.l., southwest of Bala) is attributed to its completely convex contours.
Palaeoglaciation level implied by cirques, in metres. Results should be regarded as more precise than ±20 m; c implies a broader error margin, perhaps 40 m.

As a simple example, Radnor Forest (Fig. 1) has two summits, at 660 and 650 m: since only the higher one has a cirque, the PGL is set at 655 m. South of Machynlleth near the edge of the high plateau, the PGL is well defined at 520 m by summits at 526, 564, 582 and 529 m with cirques, and by summits at 447, 468, 475, 487, 520, and 521 m without. In northeast Wales, the PGL exceeds 550 m. In the Berwyn Range all summits above 740 m bear cirques, but those at 690, 666, 661 and 630 m do not: the PGL is approximately 710 m.
In southern Wales, the PGL is 500 m in the Rhondda and near the eastern edge of the coalfield, but is higher in between. At the western edge of the Brecon Beacons, just inside Carmarthenshire, the PGL is 630–670 m, whereas in the centre it is 600 m. Combined with the absence of cirques from Mynydd Prescelly (536 m) in the west, this pattern suggests snow-bearing winds from the south rather than the west, if these cirques developed simultaneously. The critical evidence here is the absence of cirques from 635, 616 and 602 m mountains, despite the availability of suitable sites.
The expected northeastern PGL rise is most apparent in the ranges from Cadair Idris and Machynlleth to the Berwyns and in the high, but poorly determined, level in northernmost Snowdonia. In mid-Wales, the PGL is higher east of Plyn-limon than west, and in the South Wales Coalfield and Brecon Beacons it rises northward. The PGL could be said to be lower around the southern and western peripheries of the Welsh massif. The absence of cirques is difficult to explain in two areas: the east slope of Plynlimon (Pumlumon) and the western part of the Black Mountains.
Given the great local variations in cirque floors and reconstructed ELAs, the PGL provides useful information to confirm trends across Wales, even though low relief and massive topography (plateaus, rounded summits) make the glaciation-level technique more difficult to apply than in well-dissected, high-relief areas.
Reference EvansEvans (1990) also considered the idea of an all-sided PGL, the threshold above which cirques would occur even on those aspects least favourable to glacier balance. Taking headwall aspect, only 14 out of 228 cirques in Wales face the southern quadrant. All are on mountains above 600 m a.s.l. Almost all are in Snowdonia, on the highest mountains (above 800 m) in the north, but there are several on mountains over 680 m west and southeast of Snowdon. Only Snowdon, however, supports cirques on all aspects. West-facing cirques are a little more widespread, with five near Y Llethr, but again none in southern Wales. The all-sided PGL is about the height of Cadair Idris (893 m), but above Aran Fawddwy (902 m) and a little above Pen y Fan (896 m). From these few major summits, it is about 300 m above the PGL.
Cirque Floor Altitudes
A more conventional method of extracting palaeoclimatic information from cirques is to map generalized cirque floor levels to give a “composite Pleistocene snow line” (Reference PorterPorter, 1964). It may be necessary to reduce the considerable local variation by focusing on a particular cirque type or aspect: Porter took north-facing cirques. The present dataset includes lowest, most-frequent (modal) and highest floor altitude: these show very similar patterns. Modal floor altitude, the central and most broadly based of the three floor altitudes, is illustrated in Figure 4, which maps average floor altitude for 17 groups of cirques.
Average cirque floor altitudes in metres for cirque groups (mountain ranges). The three easternmost results are based on a small numbers of cirques (6 in Berwyns, 3 in Black Mountains and 7 near Abergavenny).
Linear trends for all cirques in Wales are very weak, suggesting a need to subdivide the dataset by cirque grade, type or aspect; even so, R2 values remain below 0.15. When different regions are considered separately (Table 1), both R2 and rms error values show improved fits. Statements about the southwest to northeast rise in former snowlines across Wales (e.g. in Reference Campbell and BowenCampbell and Bowen, 1989) seem to be based solely on northern Snowdonia (Reference UnwinUnwin, 1973). That region has a clear trend but is very limited, only 30 km along the trend (033°) from southwest-northeast (390–623 m in Fig. 4).
Regression equations for floor-altitude linear trends across sectors of Wales. Grid references east (E) and north (N) of origin of Ordnance Survey national grid in km (coefficients of E and Nare in m km— 1 altitude in m).
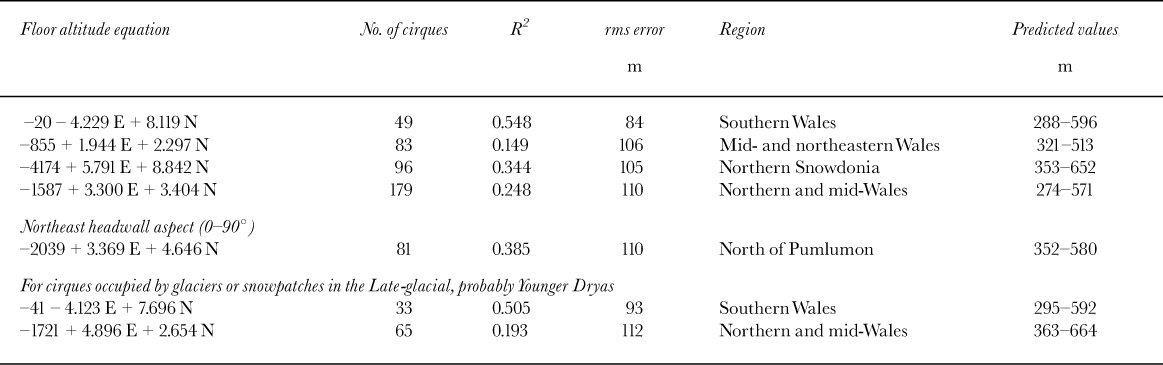
Among the three initial spatial divisions in (Table 1), the strongest trend is in southern Wales with higher floors to the north-northwest (334°). Cirque floors in the central Brecon Beacons (565 m in Fig. 4) are more than 200 m higher than in the coalfield. In mid- and northeast Wales, the largest division in area, the rise is to the northeast (040°) as in Snowdonia, but the fit is much poorer. It seems best to combine these latter divisions, giving the compromise linear trend for “north and mid-Wales”. A slightly more restricted region gives a stronger trend, especially for north- to east-facing cirques (Table 1, fifth equation).
The trends in Table 1 are consistent with those of the PGL noted above. Similar trends and contrasts are found if poor and marginal cirques (Fig. 2) are excluded. It is clear that, because of the different trend in the south, an overall linear trend is not a good model for Wales.
Cirque Aspects
Cirque headwall aspect has a vector mean of 047° for Wales, and axial aspect averages 049°. Headwall aspect is more northward in southern Wales (037°) than elsewhere (051°): this is due mainly to the Brecon Beacons and relates to their east— west extent, as well as to southerly winds. Dividing cirques into 17 groups, as in Figure 4, shows that areas where snowdrifting is expected to be more important have more easterly means than their neighbours. Differences between groups, and between southern Wales and the rest, are significant at the 0.001 level. The degree of asymmetry is high except in northern Wales between Snowdon and Dolgellau, where vector strength falls below 50%. This asymmetry is as expected from cirque distribution and is not inconsistent with simultaneous cirque glaciation.
Younger Dryas Glaciers
The spatial pattern of cirques may be compared with that of glaciers assigned to theYounger Dryas (YD) Loch Lomond Stadial (Fig. 5), which is as close to a simultaneous pattern of glaciation as will be available. In northern Snowdonia, Reference SeddonSeddon (1957) showed the effects of aspect and position on such glaciers; Reference GrayGray (1982) reconstructed the YD ELA and found a linear trend rising to the northeast, from 460–710 m. This is higher and slightly gentler than Reference UnwinUnwin’s (1973) trend for cirque threshold altitudes, but otherwise comparable.
Distribution of cirques in Wales. Those with moraines and protalus ramparts of possible Late-glacial age are highlighted by circles. The data are poor outside Snowdonia and the Brecon Beacons.
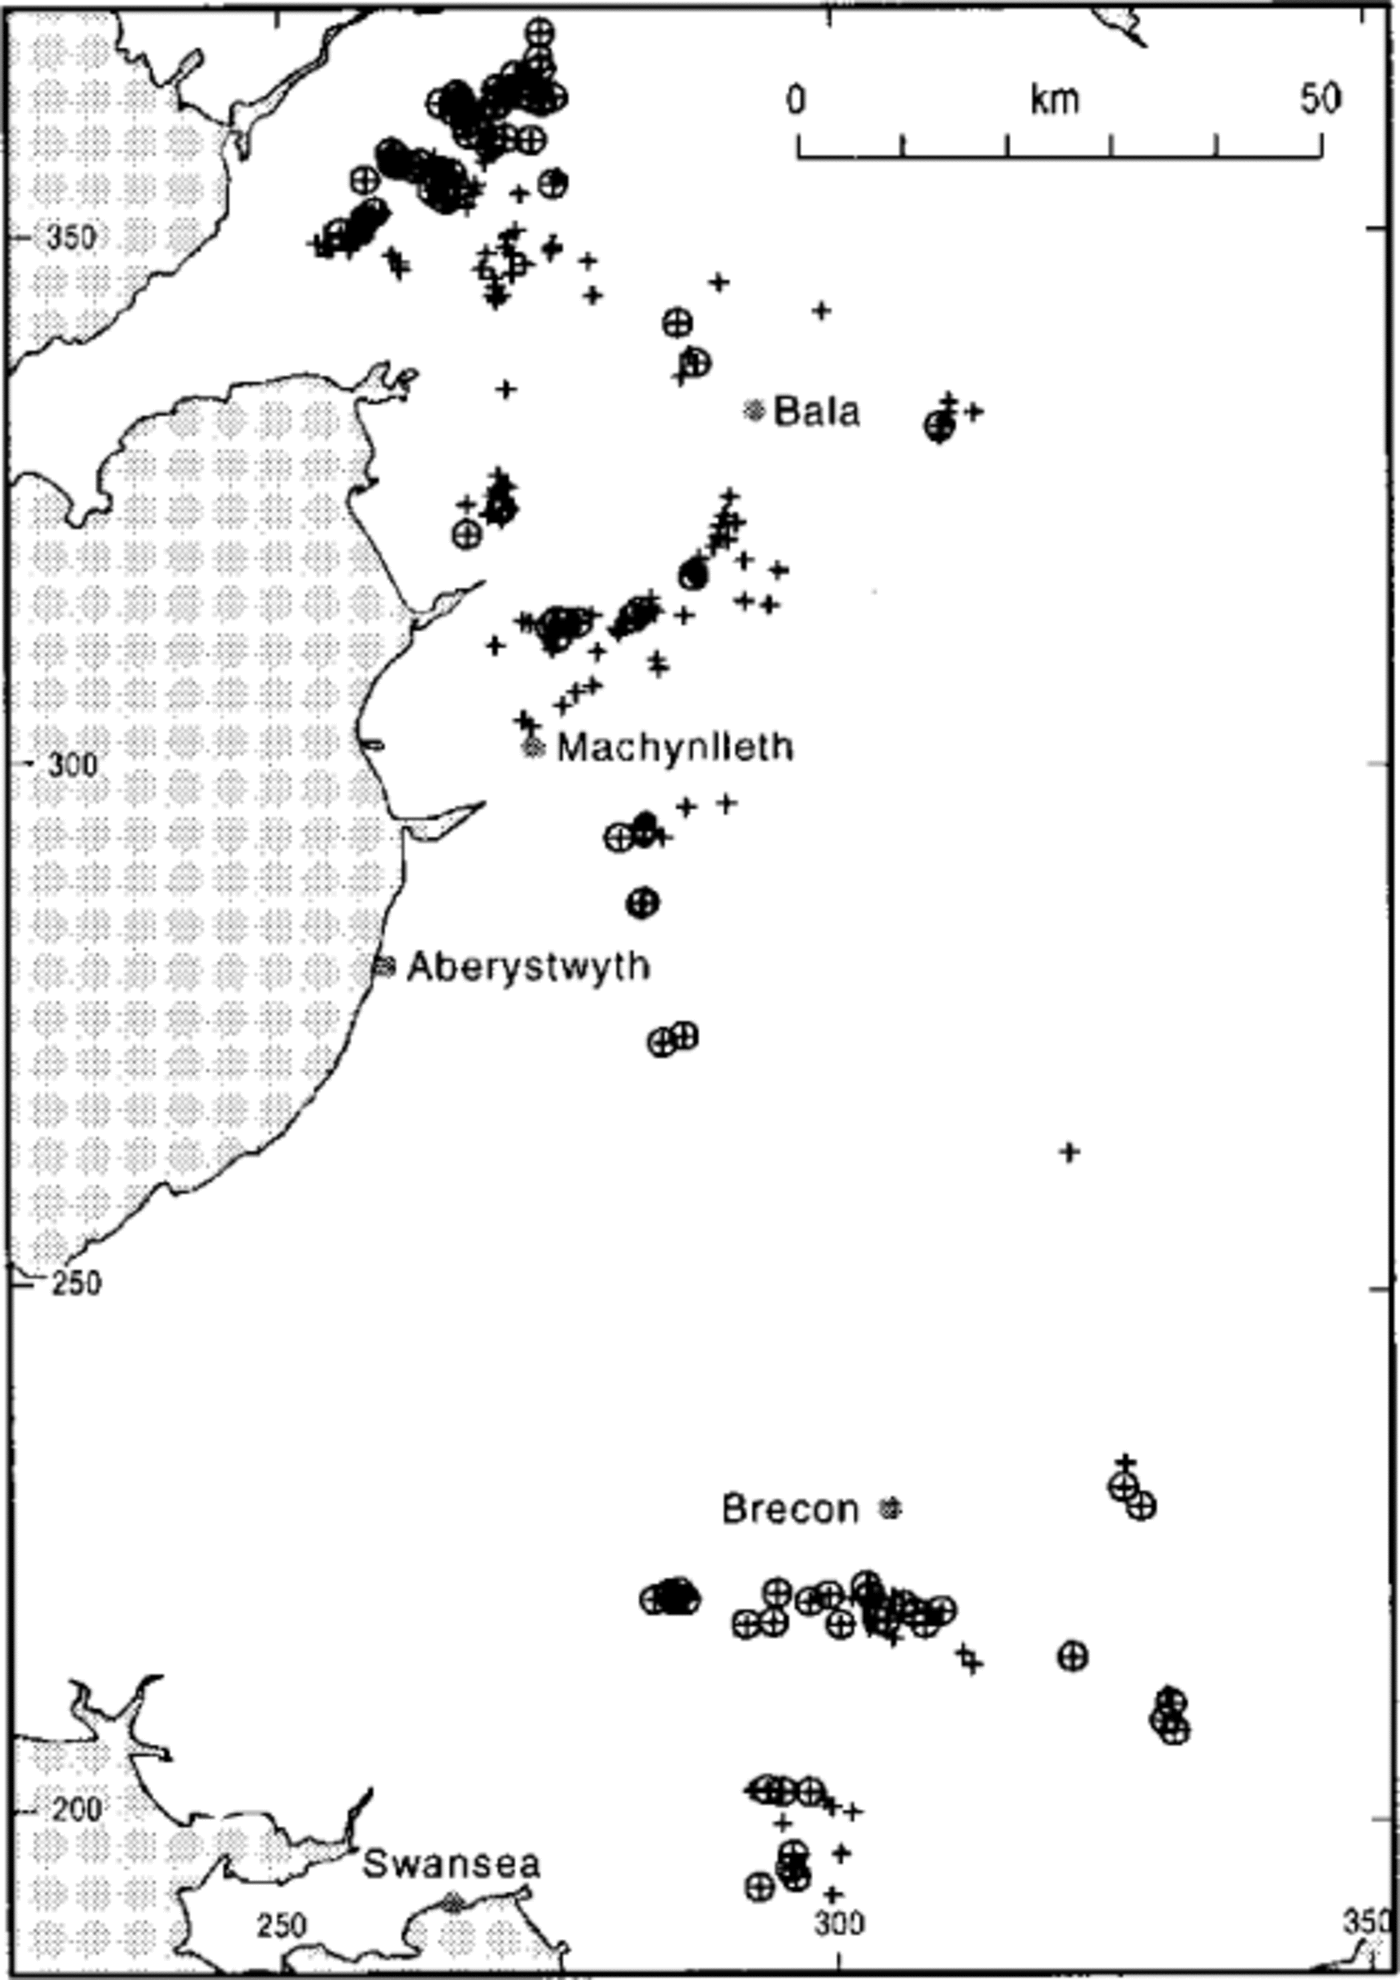
In mid-Wales, there are numerous cirque moraines, but little direct dating: further detailed work is needed. Reference Cave and HainsCave and Hains (1986) illustrated moraines, which they described as Late-glacial, in the low cirques south of Machynlleth. In southeast Wales, Reference BarclayBarclay (1989) stated that three of the low cirques near Abergavenny contain Late-glacial moraines and lake sites. The cirque moraines of the Brecon Beacons, mapped by Reference LewisLewis (1970) and Reference Ellis-GruffyddEllis-Gruffydd (1977), are well established as Late-glacial (YD) (Reference WalkerWalker, 1980; Reference Shakesby and MatthewsShakesby and Matthews, 1996). Reference RobertsonRobertson (1988) found that a cirque in the Black Mountains was occupied in the YD. He suggested that drifting snow from the southwest and south was important in explaining the low altitude of this and of Brecon Beacons’ YD glaciers.
For the 104 cirques with such moraines or protalus ramparts, variation in floor altitude is similar to that for all cirques: there is hardly any linear trend over Wales as a whole, but trends rise to the north-northwest in southern Wales and to the northeast in the rest of Wales (Table 1). The range of values predicted (for these cirques) is similar to that for unoccupied cirques in southern Wales, but some 90 m higher elsewhere. Overall, the actual floor altitudes of occupied cirques average 68 m higher than unoccupied or unknown cirques. Crest altitudes are 90 m higher and occupied cirques are larger, better developed, and closer to the overall mean aspect of northeast. Their vector strength is 64%, compared with 49% for unoccupied cirques, and their mean is slightly more northward.
Discussion
The original working hypotheses have been justified and the methods of analysis have proved useful in finding pattern in the distribution and altitude of cirques. The hypothesis of time-transgressive cirque glaciation implies development of cirques on mountains about 500 m a.s.l. in northeast and southwest Wales, and in the Lleyn peninsula of northwest Wales: these are not observed. The hypothesis does not help explain the relatively low cirques around Machynlleth and southeast of Snowdon, because these areas would be affected early by ice-cap buildup. Cirques are higher toward the interior and the northeast of Wales, as would be expected from present precipitation variations.
Renewed glaciation inevitably starts in cirques which trap snow and provide shelter, but if wind regimes varied different subsets of cirques would nourish glaciers. Altitudinal trends in the patterns of YD glaciers and of cirques are very similar and both show considerable local variations. Thus, cirques could have developed under a glaciation slightly more extensive than that of the YD, with a rather lower ELA. Although major northeast-facing cirques may then have produced short valley glaciers, these were steep enough to permit continued cirque development. This slowed down as ice caps developed and surface gradients declined. It is unlikely that the Welsh cirques developed at the Last Glacial Maximum (LGM), when they were either buried under the ice sheet (Arenig and Y Llethr areas) or formed ice sources; for example the Rhondda and Berwyn areas produced long glaciers with gradients <2°. Application of this model to the cirques above Abergavenny, near the periphery of that ice sheet, is less certain, but their altitudes are close to those of the Rhondda and Machynlleth areas which fed or were overwhelmed by the ice sheet.
Since permafrost was extensive in Britain during the YD, much of that glaciation may have been cold-based and erosionally ineffective. Conditions for cirque erosion should have been warmer and snowier than theYD, yet with similar wind patterns, from the south as well as the southwest.
None of this supports the hypothesis of time-transgressive cirque glaciation. The development of Welsh cirques can be related to climatic conditions with snow from the south in southern Wales and from the southwest elsewhere. The Brecon Beacons prevented winds from the south affecting the rest of Wales. Southeasterly winds cannot have been important or more cirques would be seen in the Welsh borderland. Channelling of southwest air streams along major valleys led to lower cirques around Machynlleth and north of Bala, but not at the heads of the Twyi and Teifi Rivers near Drygarn Fawr (Fig. 1). The well-established mountainmass factor caused lower snowfall and a higher PGL in the mountain interiors.
Ice caps built up along the mountain axis from east of Snowdon, through the Arenig and Aran mountains, to the Brecon Beacons and Rhondda. The one on the extensive plateau area around Drygarn Fawr built up without a cirque glaciation phase. The implication in Wales, and elsewhere in Britain, is that ice caps built up rapidly once the snowline fell below that producing cirque glaciation, and they merged to form the ice sheet.
The glaciation of southern Wales during both cirque development and the YD was more extensive than expected from present topography and climate. ELAs, cirque floors and glaciation levels are lower than in northern Wales, despite the currently lower precipitation and the slightly higher temperature for a given altitude and exposure. Winds were important in both regions and it is difficult to avoid the conclusion that snowfall increased more in southern than in northern Wales. This could reflect icy conditions and/or lower sea level in the Irish Sea and Cardigan Bay. The importance of winds from the south may also have increased.
Comparisons with England, Ireland and Scotland
Palaeoclimatic inferences should be checked for compatibility with adjacent areas. Within Wales, we have noted a PGL of 470–710 m, and generalized cirque floor altitudes of 288–652 m (Table 1; 310–623 m for group averages, Fig. 4). ELAs lay slightly above the floor altitudes and roughly 100 m below the PGL. Across the Bristol Channel, there appears to be just one cirque on Exmoor and none on Dartmoor. On Exmoor, the Punchbowl on Winsford Hill (426 m) in west Somerset is a unique landform within southwest England, beyond the limits of any ice sheets. It is a little smaller than its namesake near Abergavenny and has a gentler, lower headwall, but is otherwise similar and at a similar altitude (floor 300 m). Its snowdrift areas are some 100 m lower than those of the Abergavenny and Rhondda cirques. Its last occupation is undated, possibly Devensian or Anglian (Reference Harrison, Anderson and PassmoreHarrison and others, 1998).
In southern Ireland, the PGL is around 600 m in County Waterford, falling to around 500 m on coastal mountains in Cork and Kerry. As in Wales and Cumbria, many cirques seem to have been occupied by local glaciers during the YD. In the Lake District of northwest England, only 50 km across, there is no linear trend in either the PGL or ELA. The PGL rises from 550 m near the fringes to > 700 m in the central and eastern core areas. Floor altitudes average 495 m, but the 10 and 90 percentiles are 305 and 660 (Reference Evans and CoxEvans and Cox, 1995). These compare with 456 m and 300-630 m in Wales.
YD glacier ELAs range from 426-703 m in the Brecon Beacons (Reference RobertsonRobertson, 1988), from 410–815 m in northern Snowdonia (Reference GrayGray, 1982), and from 284–785 m in the Lake District. Averages are 568, 601 and 540 m a.s.l. respectively, compared with 495 m for the western Southern Uplands of Scotland. In the Scottish Highlands, the averaged YD ELA rose from 300 m in the west to 1000 m in the Cairngorms: altitudes of protalus ramparts confirm the trend from glacier reconstructions (Reference Ballantyne and HarrisBallantyne and Harris, 1994). Thus, the northward fall in ELA related to temperature is considerably less than the variations related to precipitation.
Conclusions: Spatial and Temporal Pattern of Glaciation
-
(1) Cirques are numerous in northern mid-Wales and the South Wales Coalfield, as well as in better-studied areas.
-
(2) The distribution and altitude of cirques and moraines shows a greater change from present-day conditions in southern Wales than in the north. The increase of snowfall was greater in the south.
-
(3) Younger Dryas glaciers or snowpatches occupied about half the cirques. Occupation was more likely for higher, larger and better-developed cirques. Thus, cirques probably developed with a glaciation a little more extensive than in the Younger Dryas.
-
(4) Both cirques and Younger Dryas (Loch Lomond) glaciers rise from southwest-northeast across north and mid-Wales but from south-southeast-north-northwest across southern Wales. The high PGL west of the Brecon Beacons, and the low cirques and moraines of Abergavenny and the Rhondda, strongly suggest that southern winds were more important than southwesterly winds for snow accumulation in southern Wales.
-
(5) Glacial cirques are absent from mountains of moderate altitude remote from centres of ice-sheet buildup, in southwest and northeast Wales and in Lleyn.
-
(6) Points 3, 4 and 5 are consistent with Welsh cirques developing simultaneously, under conditions of local glaciation before the LGM and earlier glacial maxima. It is possible that this simultaneity extends to cirques in northern England, Ireland and southern Scotland. Cirques may have developed time-transgressively, but no evidence to date requires this.
Acknowledgements
I am grateful to N. Cox for considerable help and comments on drafts, to J. Warburton, C. Clark and the referees for pertinent comments, to C. Orton and D. Hume for drawing the maps, and to all the students who have shared in the study of cirques in Wales. The Air Photographs Unit of the Welsh Office provided access to the air photos, and the University of Durham provided maps and other support.


