


The ongoing worldwide epidemic of obesity and its associated co-morbidities are serious threats to human health(Reference Swinburn, Kraak and Allender1,Reference Zhang, Proenca and Maffei2) . The cloning of the ob gene in mutant ob/ob mice and identification of its product leptin have provided a framework for studying the pathogenesis of obesity and have helped to advance our understanding of the neural mechanisms that control feeding and increased expectations for the treatment of obesity(Reference Zhang, Proenca and Maffei2). Leptin is mainly an adipocyte-secreted hormone that inhibits food intake and stimulates energy expenditure through a variety of neural and endocrine mechanisms that maintain homoeostatic control of adipose tissue mass and body weight(Reference Friedman3,Reference Engin4) . However, most obesity in humans does not result from a single genetic lesion but rather appears to be the expression of an imbalance in the energy equilibrium caused by a sedentary lifestyle and unbalanced eating patterns. Most rodents with diet-induced obesity (DIO) and humans with obesity exhibit elevated gene expression of leptin and its circulating concentrations, with the absence of regulatory effects on body weight, indicating leptin resistance(Reference Friedman3,Reference Engin4) . The mechanisms that sustain leptin resistance are considered to be attributable to several pathways (e.g. hyperleptinaemia, failure of central transport of the hormone, endoplasmic reticulum stress and receptor signalling impairment)(Reference Sáinz, Barrenetxe and Moreno-Aliaga5,Reference Pan and Myers6) , but they are still unclear and need to be clarified. Thus, identifying the factors associated with the development and consequences of leptin resistance may lead to a better understanding of how leptin influences the metabolic and pathophysiological state of obesity.
During the past decade, a rapidly expanding area of research that is focused on gut microbiota and obesity has offered fresh and interesting insights and potential avenues for intervention, although some debate still exists(Reference Sonnenburg and Bäckhed7,Reference Mokkala, Houttu and Cansev8) . It has been reported that germ-free (GF) mice are resistant to DIO when fed a Western-style diet with high levels of sucrose and lard(Reference Bäckhed, Manchester and Semenkovich9,Reference Rabot, Membrez and Bruneau10) , and the consecutively emerging data suggest that there is a reduction in gut microbiome richness in obese subjects, and this reduction presents more pronounced dys-metabolism and low-grade inflammation(Reference Vallianou, Stratigou and Christodoulatos11,Reference Cotillard, Kennedy and Kong12) . In contrast, GF mice that are fed a high-fat diet (HFD) with less or no sucrose are not protected against obesity(Reference Caesar, Tremaroli and Kovatcheva-Datchary13,Reference Fleissner, Huebel and Abd El-Bary14) . Therefore, diet modulates the composition and function of the microbe community, and diet–microbiota interactions moderate metabolism in humans and other mammals(Reference Sonnenburg and Bäckhed7,Reference Mokkala, Houttu and Cansev8,Reference Cotillard, Kennedy and Kong12,Reference Bellenger, Bellenger and Escoula15) .
Mechanisms linking the gut microbiota with obesity are complex and could be attributed to alterations in the absorption, metabolism and storage of nutrients and energy content, as well as systemic inflammation, microbial metabolites (e.g. bile acids and SCFA) and gut hormones (e.g. peptide YY and glucagon-like peptide-1), which act on brain and peripheral organs through specific receptors or epigenetic modifications(Reference Sonnenburg and Bäckhed7,Reference Mokkala, Houttu and Cansev8,Reference Vallianou, Stratigou and Christodoulatos11,Reference Cotillard, Kennedy and Kong12) . For example, SCFA bind and activate orphan G-protein-coupled receptors, such as GPR43 and GPR41, which are widely expressed in the small intestine and colon, as well as tissues and organs beyond the gut(Reference Ang and Ding16). Additionally, they play beneficial roles in appetite regulation and lipid and glucose metabolism by epigenetically regulating related genes(Reference Byrne, Chambers and Morrison17,Reference Chambers, Morrison and Frost18) . Regarding the molecular mechanisms underlying the increased leptin expression in obesity, epigenetic modifications could be involved(Reference Crujeiras, Carreira and Cabia19). Therefore, we hypothesised that the dysbiosis of gut microbiota may contribute to the high leptin level by epigenetically modulating its expression in obesity. In this study, using GF mice and conventional (CV) mice, we determined whether the absence of gut microbiota may be associated with increased leptin expression and its promoter methylation and further examined the effects of gut microbiota on body weight by exogenous leptin administration under two different feeding styles (the HFD and the normal-fat diet (NFD)).
Materials and methods
Experimental animals
Twenty-four GF male C57BL/6 J mice were reared from GF breeding pairs in GF isolators at the Institute of Laboratory Animal Sciences, Chinese Academy of Medical Sciences and Peking Union Medical College. In parallel, forty CV male C56BL/6 J mice were purchased from Beijing Huafukang Bioscience Co. Inc. and reared in CV isolators. These two types of mice were housed at the same animal facilities under a 12 h light–12 h dark cycle with cycles of air ventilation and control of temperature and humidity, with free access to water and food. At 4 to 5 weeks of age, both GF and CV mice were divided into two groups and fed for 16 weeks with a HFD (34·9 % fat by wt., 60 % energy) (no. H10060) and a NFD (4·3 % fat by wt., 10 % energy) (no. H10010) (Beijing Huafukang Bioscience Co. Inc.) with the same formulas as the original HFD for DIO mice (D12492) and the paired control diet (D12450B) (Research Diets). The diets were sterilised with γ-irradiation 25 kGy and stored at −20°C until use. All experimental protocols were approved by the Committee on the Ethics of Institute of Laboratory Animal Sciences, Chinese Academy of Medical Sciences and Peking Union Medical College (number bch-2017-1) and in accordance with the Animals (Scientific Procedures) Act, 1986 (UK) (amended 2013) as well as the Guide for the Care and Use of Laboratory Animals of National Administration Regulations on Laboratory Animals of China. All sections of this report adhere to the ARRIVE Guidelines for reporting animal research (www.nc3rs.org.uk). A completed ARRIVE Guidelines checklist is included in Checklist S1.
Animal preparation
Mouse body weight was measured weekly, and food consumption was detected at 4, 8, 12 and 16 weeks after feeding with seven consecutive days of records. Then, the averaged energy intake was calculated and expressed as kcal/d per mouse based on food intake at the four time points. The fresh stool samples were collected at 8 and 16 weeks and stored at −80°C for later analysis of microbiota and SCFA. In order to examine leptin sensitivity, after 15 weeks of feeding intervention, six mice from each GF group and eight mice from each CV group were intraperitoneally injected with exogenous leptin (L3772; Sigma-Aldrich) (2 mg/kg per d)(Reference Rodríguez, Moreno and Balaguer20,Reference Burnett, Skowronski and Rausch21) in the morning for 7 d based on the initial body weight at 15 weeks, with food intake records every 2 d. During housing, animals were monitored twice daily for health status. After feeding and leptin administration, the 12-h fasted mice were anaesthetised by intraperitoneal injection of Avertin (125 mg/kg of 2,2,2-tribromoethanol, T-4840-2; Sigma-Aldrich Chemie GmbH) to obtain blood samples by heart puncture and then euthanised by injection of an overdose of Avertin (500 mg/kg) and decapitation to minimise suffering. After euthanisation, the epididymal fat and the liver were immediately dissected free of the surrounding tissue, removed, wrapped in an Al foil and frozen in liquid N2 and then were transferred to −80°C until use. Considering the resistance to obesity in a small part when establishing obese model, HFD-fed mice were excluded from further analyses if they did not gain more than 15 % weight during the 16 weeks of high-fat feeding, compared with NFD-fed mice. Thus, we included eight in each group of HFD-fed CV mice and six in each group of HFD-fed GF mice and eight in each group based on randomly selection as control in CV mice fed NFD. The profiles of body weight were closely similar to those if all the mice included, as shown in online Supplementary Fig. S1. To verify GF in mice, the gut microbiota genome DNA was extracted from faeces and no DNA band was shown on the gel with GF mice (online Supplementary Fig. S2). Furthermore, the quantitative PCR for genome DNA extract was conducted with the universal primer (forward (F): 5′-ACTCCTACGGGAGGCAGCAG-3′; reverse (R): 5′-ATTACCGCGGCTGCTGG-3′), and no products were found in the GF mice (online Supplementary Fig. S3).
Measurement of biochemical parameters
SCFA in faeces and plasma were examined using GC according to our previously described method(Reference Lu, Fan and Li22) on an Agilent 6890 N GC system equipped with a flame ionisation detector and a high-resolution GC column of 30 m × 0·25 mm internal diameter coated with 1·40 μm film thickness (DB-624UI; J&W Scientific, Agilent Technologies Inc.). Mouse plasma leptin concentrations were examined by the Mouse/Rat Leptin Quantikine ELISA Kit (R&D).
Analysis of gene mRNA expression
Total RNA was extracted from approximately 80 mg of the epididymal fat or hepatic tissue using the Trizol reagent (Invitrogen) and then reverse-transcribed to cDNA using the Quant Script RT Kit (Tiangen Biotech). The mRNA expression levels of genes were measured by real-time quantitative reverse transcription-PCR (CFX-96; Bio-Rad). The expression of targeted genes including leptin, leptin receptor (Lep-R), lipoprotein lipase, adipose TAG lipase (Atgl), sterol regulatory element-binding protein (Srebp)-1c, Ppar-α, PPAR-γ coactivator 1a (Pgc-1α) and two isoforms of DNA methyltransferases (Dnmt3a and Dnmt3b) in the adipose tissue, the expression of Lep-R, acetyl-CoA carboxylase 1 (Acc1), fatty acid synthase (Fas) and carnitine palmitoyltransferases (Cpts) (Cpt1a, Cpt1c and Cpt2), acetyl-CoA synthetase 2 (Acss2) and acetoacetyl-CoA synthetase (Aacs) in the hepatic tissue, and the expression of Lep-R, neuropeptide Y (Npy), pro-opiomelanocortin (Pomc) and suppressor of cytokine signalling-3 (Socs3) in the hypothalamus were determined with β-actin as the invariant internal control. The expression of Lep-R, Npy, Pomc and Socs3 in the hypothalamus was determined with glyceraldehyde-3-phosphate dehydrogenase (Gapdh) as the invariant internal control in experiments with leptin injection. The results were normalised to the internal standard mRNA levels using the 2–ΔCT method. The oligonucleotide primers for the targeted genes were designed by Primer-Blast (http://www.ncbi.nlm.nih.gov/tools/primer%20blast/) and are shown in online Supplementary Table S1.
Bisulphite conversion and sequencing
The examined leptin promoter region includes nucleotides (nts) 29009221-29010220 and spans 16 CpGs within nts −321 to −1 (positions are given relative to the transcription start site), containing a TATA box and binding sites for the transcriptional factors C/EBP, Sp1 and Lp1. Bisulphite sequencing was used to analyse the methylation of the leptin promoter according to our previous study(Reference Shen, Wang and Xia23). The genomic DNA was isolated and purified from the epididymal fat using a TIANamp Genomice DNA Kit (Tiangen Biotech) and then treated with bisulphate using the MethylampTM DNA Modification Kit (catalogue no. P-1001; Epigentek Group Inc.). The bisulphate-converted DNA was amplified by nested PCR using Taq DNA Polymerase Master Mix (catalogue no. KT201; Tiangen Biotech Inc.) with specific primers for the leptin promoter: outer F, 59-GAGTAGTTAGGTTAGGTATGTAAAGAG-39; inner F, 59-AGTTTTTTGTAGTTTTTTGTTTTTTG-39 and R, 59-TAATAACTACCCCAATACCACTTAC-39. The products were sequenced, and the methylation fraction was calculated(Reference Lewin, Schmitt and Adorján24).
Statistical analysis
Statistical analysis was performed with SPSS software (version 17.0 for Windows). Differences between groups were analysed by one-way ANOVA when the data were normally distributed. The data with a non-normal distribution were assessed using the Mann–Whitney U test and Wilcoxon signed-rank test. Then, the Student–Newman–Keuls test was used to determine where the differences existed among the groups. P < 0·05 was considered to be statistically significant.
Results
Differences in body weight change between germ-free and conventional mice fed the normal- or high-fat diet
As shown in Fig. 1(a), after feeding with NFD for 16 weeks, GF mice increased body weight gain by 18·7 % compared with those of CV mice (P < 0·05), whereas with HFD feeding, no differences were found in body weight gain between GF and CV mice (P > 0·05). Food intake was changed with time after feeding intervention, being increased at 4 and 8 weeks and decreased at 16 weeks under NFD feeding, and decreased at 4, 8 and 16 weeks under HFD feeding in GF mice, compared with CV mice (P < 0·05) (Fig. 1(a)).
Differences in body weight change and food intake between germ-free (GF) and conventional (CV) mice. Male C57 BL/6 J GF and CV mice (4–5 weeks old) were fed either a normal-fat diet (NFD) or a high-fat diet (HFD) for 16 weeks. Mouse body weight (a) was measured weekly, and energy intake (b) was examined at 4, 8, 12 and 16 weeks. Six in each GF group, and eight in each CV group. Data are mean values with their standard errors.* Compared with NFD with the same mouse type (P < 0·05). † Compared with CV mice with the same diet feeding (P < 0·05). (a) ![]() , CV-NFD;
, CV-NFD; ![]() , CV-HFD;
, CV-HFD; ![]() , GF-NFD;
, GF-NFD; ![]() , GF-HFD. (b)
, GF-HFD. (b) ![]() , CV;
, CV; ![]() , GF. ‡ To convert kcal to kJ, multiply by 4·184.
, GF. ‡ To convert kcal to kJ, multiply by 4·184.

Differences in SCFA and associated metabolic genes between germ-free and conventional mice fed the normal- or high-fat diet
As shown in Table 1, in GF mice, faecal concentrations of propionic acid, butyric acid, isobutyric acid, valeric acid and isovaleric acid under NFD feeding and valeric acid under HFD feeding were increased compared with those of CV mice (P < 0·05). The plasma acetic acid concentration in GF mice was higher than that in CV mice fed a HFD (P < 0·05). Analysis of genes associated with SCFA metabolism indicated that in GF mice, expression of Acss2 and Aacs with NFD feeding and Aacs expression with HFD feeding were down-regulated, compared with expression in CV mice (P < 0·05) (Fig. 2(b)).
SCFA in faeces and plasma and plasma leptin in germ-free (GF) and conventional (CV) mice fed the normal-fat diet (NFD) or high-fat diet (HFD) (Mean values and standard deviations; n 6–8 in each group)
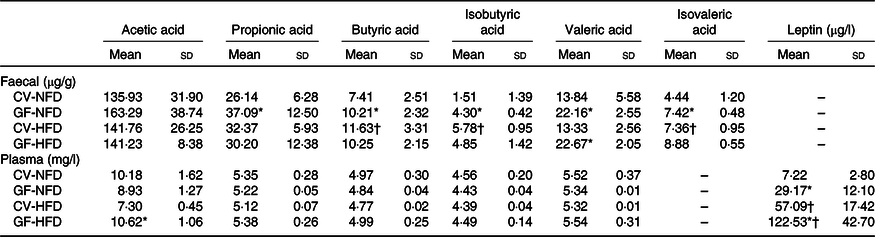
* Compared with CV mice fed the same diet (P < 0·05).
† Compared with NFD with the same mouse type (P < 0·05).
Differences in the expression of leptin, Lep-R and associated genes between germ-free (GF) and conventional (CV) mice. The mouse experimental procedure was the same as in Fig. 1. The mRNA expression of associated genes in the epididymal fat (a), liver (b) and hypothalamus (c) was examined by reverse transcription-PCR. Six in each GF group, and eight in each CV group. Data are the mean values with their standard errors. * Compared with CV mice with the same diet feeding (P < 0·05). † Compared with normal-fat diet (NFD) with the same mouse type (P < 0·05). HFD, high-fat diet. ![]() , CV;
, CV; ![]() , GF. Lep-R, leptin receptor; Atgl, adipose TAG lipase; Srebp-1c, sterol regulatory element-binding protein-1c; Pgc-1α, PPAR-γ coactivator 1a; Dnmt, DNA methyltransferase; Acc1, acetyl-CoA carboxylase 1; Fas, fatty acid synthase; Cpt, carnitine palmitoyltransferase; Acss2, acetyl-CoA synthetase 2; Aacs, acetoacetyl-CoA synthetase; Npy, neuropeptide Y; Pomc, pro-opiomelanocortin; Socs3, suppressor of cytokine signalling-3.
, GF. Lep-R, leptin receptor; Atgl, adipose TAG lipase; Srebp-1c, sterol regulatory element-binding protein-1c; Pgc-1α, PPAR-γ coactivator 1a; Dnmt, DNA methyltransferase; Acc1, acetyl-CoA carboxylase 1; Fas, fatty acid synthase; Cpt, carnitine palmitoyltransferase; Acss2, acetyl-CoA synthetase 2; Aacs, acetoacetyl-CoA synthetase; Npy, neuropeptide Y; Pomc, pro-opiomelanocortin; Socs3, suppressor of cytokine signalling-3.

Differences in the expression of leptin, Lep-R and associated genes between germ-free and conventional mice fed the normal- or high-fat diet
In the adipose tissue, with NFD feeding, mRNA expression of the leptin gene was increased and expression of Atgl, Srebp-1c, Ppar-α and Pgc-1α was decreased in GF mice compared with levels in CV mice (P < 0·05). However, no differences were observed in the mRNA expression of these genes either in GF or CV mice fed a HFD (P > 0·05) (Fig. 2(a)). In the liver, the mRNA expression levels of the Lep-R, Acc1, Fas and Cpt1c with NFD feeding and Cpt1a, Cpt1c and Cpt2 with HFD feeding were all reduced in GF mice compared with levels in CV mice (P < 0·05) (Fig. 2(b)). In the hypothalamus, the mRNA expression levels of the Pomc and Socs3 were higher in GF mice than those in CV mice, with either NFD or HFD feeding (P < 0·05), whereas no differences were indicated in the expression of the Lep-R and Npy between the two groups (P > 0·05) (Fig. 2(c)). Plasma leptin concentrations in GF mice were higher than those in CV mice fed NFD or HFD (P < 0·05), with 4·04-fold and 2·14-fold increases, respectively (Table 1).
Differences in DNA methylation of the leptin promoter between germ-free and conventional mice fed the normal- or high-fat diet
The averaged fractions of methylation at the leptin promoter in GF mice showed increasing trends compared with CV mice fed both diets. Specifically, the methylated fractions in four and two of the sixteen CpG sites at the leptin promoter, under NFD and HFD feeding, respectively, were higher by approximately 6 to 16 % in GF mice compared with those in CV mice (P < 0·05) (Table 2). In keeping with this, the mRNA expression of Dnmt3a and Dnmt3b in GF mice was increased compared with that in CV mice (P < 0·05), to a greater extent with NFD feeding.
Quantitative methylation analysis of the leptin promoter in germ-free (GF) and conventional (CV) mice*
(Mean values and standard deviations)

NFD, normal-fat diet; HFD, high-fat diet; Cpg, cytosines followed by guanine residues.
* Beginning at age 4–5 weeks, C57BL/6 J male CV and GF mice were fed a NFD and a HFD for 16 weeks. Genomic DNA isolated from epididymal fat was analysed for the methylation of sixteen CpG sites (a, b, … p) at the indicated positions in the leptin gene promoter spanning nucleotides −321 to −1 relative to the transcription start site. The methylation fraction was calculated from the amplitude of cytosine and thymine within each CpG dinucleotide, C/(C + T). The result for each CpG site is represented as the mean values and standard deviations determined from six to eight mice in each group.
† Compared with CV mice fed the same diet (P < 0·05).
‡ Compared with NFD with the same mouse type (P < 0·05).
Effects of exogenous leptin administration on mouse body weight and food intake
The profiles of body weight in CV and GF mice with and without exogenous leptin injection are shown in Fig. 3(a) and (b). After 7 d of exogenous leptin administration, GF mice had a reduction in body weight of 3·12 %, which was <6·66 % of reduction in CV mice, under NFD feeding (P < 0·05). However, when fed HFD, GF and CV, mice had similar reductions in body weight at 2·90 and 2·34 %, respectively (P > 0·05) (Fig. 3(c) and (d)). Food intake was reduced by leptin injection in CV mice either with NFD or HFD (P < 0·05) (Fig. 3(e)).
Different effects of leptin injection on body weight change between germ-free (GF) and conventional (CV) mice. Male C57 BL/6 J GF and CV mice (aged 4–5 weeks) were fed either a normal-fat diet (NFD) or a high-fat diet (HFD) for 15 weeks. Then, half of the mice from each group were administered with exogenous leptin (2 mg/kg per d) for 7 d by an intraperitoneal injection to examine leptin sensitivity. The profiles of body weight in CV and GF mice in each group before leptin injection at 15 weeks are shown in (a) and (b), respectively. Changes in body weight are represented as grams (c) and percentage change (d) from pre-injection of leptin, and food intake (e) was compared with that from mice with no leptin injection. Six in each GF group, and eight in each CV group. Data are mean values with their standard errors. * Compared with CV mice with the same diet feeding (P < 0·05). † Compared with NFD with the same mouse type (P < 0·05). ‡ Compared with mice with no leptin treatment under the same diet feeding and the same mouse type (P < 0·05). (a) ![]() , CV-NFD-Lep;
, CV-NFD-Lep; ![]() , CV-HFD-Lep;
, CV-HFD-Lep; ![]() , CV-NFD;
, CV-NFD; ![]() , CV-HFD. (b)
, CV-HFD. (b) ![]() , GF-NFD-Lep;
, GF-NFD-Lep; ![]() , GF-HFD-Lep;
, GF-HFD-Lep; ![]() , GF-NFD;
, GF-NFD; ![]() , GF-HFD. (c)
, GF-HFD. (c) ![]() , CV-Lep;
, CV-Lep; ![]() , GF-Lep. (d)
, GF-Lep. (d) ![]() , CV-Lep;
, CV-Lep; ![]() , GF-Lep. (e)
, GF-Lep. (e) ![]() , CV;
, CV; ![]() , CV-Lep;
, CV-Lep; ![]() , GF;
, GF; ![]() , GF-Lep. § To convert kcal to kJ, multiply by 4·184.
, GF-Lep. § To convert kcal to kJ, multiply by 4·184.

Effects of exogenous leptin administration on the expression of leptin, Lep-R and associated genes
In adipose tissue, Lep-R expression was up-regulated by exogenous leptin administration in both GF and CV mice fed either NFD or HFD. However, increased expression of Atgl, hormone-sensitive lipase (Hsl), Ppar-α, Pgc-1α and Cpt1c was observed in CV mice instead of GF mice. No changes were found in leptin expression in either GF or CV mice (P > 0·05) (Fig. 4(a)). In the liver, except for down-regulation of Fas expression in CV mice fed NFD, exogenous leptin administration did not change the expression of Lep-R, Acc1, Cpt1a, Cpt1c and Cpt2 in either GF or CV mice fed either NFD or HFD (P > 0·05) (Fig. 4(b)). In the hypothalamus, the mRNA expression levels of Socs3 were decreased and those of Lep-R and Pomc were not changed by exogenous leptin injection in either GF or CV mice (Fig. 4(c)).
Effects of exogenous leptin administration on the expression of leptin, Lep-R and associated genes. The mouse experimental procedure was the same as in Fig. 1. The mRNA expression of associated genes in the epididymal fat (a), liver (b) and hypothalamus (c) was examined by reverse transcription-PCR. Six in each germ-free (GF) group, and eight in each conventional (CV) group. Data are means with their standard errors. * Compared with mice with no leptin treatment under the same diet feeding and the same mouse type (P < 0·05). ![]() , CV;
, CV; ![]() , CV-Lep;
, CV-Lep; ![]() , GF;
, GF; ![]() , GF-Lep. Lep-R, leptin receptor; Atgl, adipose TAG lipase; Hsl, hormone sensitive lipase; Pgc-1α, PPAR-γ coactivator 1a; Cpt, carnitine palmitoyltransferase; Acc1, acetyl-CoA carboxylase 1; Fas, fatty acid synthase; Pomc, pro-opiomelanocortin; Socs3, suppressor of cytokine signalling-3.
, GF-Lep. Lep-R, leptin receptor; Atgl, adipose TAG lipase; Hsl, hormone sensitive lipase; Pgc-1α, PPAR-γ coactivator 1a; Cpt, carnitine palmitoyltransferase; Acc1, acetyl-CoA carboxylase 1; Fas, fatty acid synthase; Pomc, pro-opiomelanocortin; Socs3, suppressor of cytokine signalling-3.

Discussion
In this study, we found that the absence of gut microbiota triggered body weight gain in mice with NFD instead of HFD feeding, accompanied by increased plasma leptin concentrations and up-regulation of adipose leptin expression and decreased expression of genes associated with fatty acid synthesis (Acc1, Fas and Srebp-1c), lipolysis and oxidation (Atgl, Cpt1a, Cpt1c, Ppar-α and Pgc-1α) in the fat or liver with more changes under NFD feeding. Exogenous leptin administration reduced body weight not only in CV mice but also in GF mice, independent of diet composition, but had a greater effect on CV mice fed NFD. Meanwhile, under both types of feeding, increased expression of adipose genes involved in fat hydrolysis and fatty acid oxidation (Atgl, Hsl, Cpt1a, Cpt1c, Ppar-α and Pgc-1α) in CV mice, and no changes in the expression of these genes in GF mice occurred when exogenous leptin was administered. Thus, the effects of gut microbiota on leptin expression and sensitivity vary with diet composition, and depletion of gut microbiota may increase leptin expression and body weight gain, implying increased risks of leptin resistance.
The outcomes of HFD-induced obesity in GF mice depend on the type of diet, quantity and composition of fat or sugar, as well as other factors (e.g. different mouse strains and the breeding environment)(Reference Sonnenburg and Bäckhed7). It has been reported that GF mice are protected from DIO when fed a Western-style diet with high levels of sucrose and lard(Reference Bäckhed, Manchester and Semenkovich9,Reference Rabot, Membrez and Bruneau10) , whereas those fed a HFD with low or no sucrose(Reference Caesar, Tremaroli and Kovatcheva-Datchary13,Reference Fleissner, Huebel and Abd El-Bary14) are not protected against obesity. The unexpected results from GF animals can be explained by the limitations of rodents raised in a GF environment or the anatomical and physiological features of GF animals themselves that differ from those of specific-pathogen-free and wild-type animals. As far as gut microbiota, health and liver disease are concerned, too much is harmful and nothing at all is not helpful either(Reference Al-Asmakh and Zadjali25). Additionally, recent evidence shows that the contribution of microbiota to obesity is very limited. The HFD drives obesity regardless of the composition of gut microbiota in mice(Reference Rabot, Membrez and Blancher26), and a GF status during gestation and lactation does not alter the metabolic response to a Western-type diet in adulthood(Reference Lohuis, Werkman and Harmsen27). Similarly, in the present study, the body weight of GF mice was not reduced under HFD feeding and increased under NFD feeding compared with CV mice fed the same diet. This confirmed that the absence of gut microbiota is not beneficial to obesity, and the effects of gut microbiota on body weight and leptin expression are overridden by HFD.
Adipose leptin expression and resulting hyperleptinaemia, which is positively associated with the quantity of body fat, might be an adaptative mechanism to overcome increased body weight and obesity(Reference Han, Joe and Seo28,Reference Ziotopoulou, Mantzoros and Hileman29) . This could explain the increased expression of adipose leptin and increased plasma leptin concentrations in GF mice with NFD, as well as mice fed HFD in our study. It has been reported that leptin resistance is induced by hyperleptinaemia itself through down-regulating the cellular response to leptin because dietary fats alone are insufficient to block the response to leptin(Reference Knight, Hannan and Greenberg30), and the development of central leptin resistance requires exposure to a HFD for a long time (e.g. 20 weeks in mice)(Reference Lin, Thomas and Storlien31). Regarding the effects of gut microbiota on leptin sensitivity and resistance concerned, it has been reported that the gut microbiota reduces leptin sensitivity and the expression of obesity-suppressing neuropeptides in the central nervous system. The authors found that GF mice had lower plasma leptin concentrations with decreased expression of Pomc and Socs3 and increased Npy expression in the hypothalamus with age at 12 to 14 weeks compared with those of CV mice, and no differences were shown with age at 6 weeks between the two types of mice(Reference Schéle, Grahnemo and Anesten32). Inconsistently, we found higher plasma leptin concentrations in GF mice with both NFD and HFD feeding for 16 weeks, with increased expression of Pomc and Socs3. The reasons underlying the discrepancy are not known but probably arise from the differences in age, physiology, nutrition, animal facilities, etc. Herein, the increased expression of the hypothalamus Pomc in GF mice might be more reactive to defend against body weight gain and obesity(Reference Han, Joe and Seo28), and the higher expression of Socs3 might play a pathophysiological role in obesity-associated neuronal leptin resistance(Reference Olofsson, Unger and Cheung33,Reference Gamber, Huo and Ha34) . Additionally, we found that GF mice had reduced adipose or hepatic expression of genes responsible for fatty acid synthesis and oxidation particularly with NFD feeding, indicating a decreased BMR(Reference Al-Asmakh and Zadjali25). Therefore, the greater changes in the expression of the above-mentioned genes reflected over reactions to body weight gain in GF mice, thus leading to less sensitivity over a long period of time.
It is well accepted that DNA methylation occurring on CpG islands is usually associated with gene silencing, whereas DNA demethylation increases gene expression(Reference Feng, Jacobsen and Reik35). Several studies have demonstrated that methylation of the CpG island in the leptin promoter affects leptin expression during pre-adipocyte differentiation(Reference Melzner, Scott and Dorsch36,Reference Stoger37) and may be involved in obesity-related leptin up-regulation; however, these results have been inconsistent(Reference Lewin, Schmitt and Adorján24,Reference Milagro, Campión and García-Díaz38,Reference Okada, Sakaue and Nagare39) . In this study, a contradiction existed between the changeable profile of leptin expression and the findings that more CpG sites in the leptin promoter were highly methylated (relative to those in CV mice) in GF mice fed NFD and more sites were hypermethylated in GF and CV mice fed HFD. This result is consistent with our previous study showing that important epigenetic changes occur in the leptin promoter of DIO mice by either directly inhibiting enzymes that catalyse DNA methylation and histone modifications or altering the availability of substrates necessary for these enzymatic reactions(Reference Lewin, Schmitt and Adorján24). All these data suggest that epigenetic modifications of the leptin promoter may serve a feedback role to maintain leptin concentrations within a normal range(Reference Lewin, Schmitt and Adorján24).
Recent research has indicated that the gut microbiota and gut microbial metabolites might be important mediators of diet–epigenome interactions(Reference Sonnenburg and Bäckhed7). A few microbial metabolites, including folate, phenolic acids, S-(−)equol, urolithins, isothiocyanates and SCFA, have been tested with respect to their potential to influence epigenetic mechanisms, and the results are inconsistent(Reference Mischke and Plosch40,Reference Qin and Wade41) . It has been demonstrated that the lower mRNA levels of adiponectin and resistin in obese mice can be reversed to the normal range by dietary supplementation of SCFA, and these effects may be involved in the epigenetic modification by directly reducing the expression of DNA methylation transferases and suppressing the binding of these enzymes to the promoters of adiponectin and resistin(Reference Lu, Fan and Liang42). In this study, the increased concentrations of propionate, butyrate, valerate and isovalerate under NFD feeding and those of valerate and isovalerate under HFD feeding in GF mice, together with the up-regulated Dnmt expression, might be involved in highly methylated CpG sites of the leptin promoter. Notably, changes in other bioactive compounds, such as less production of B-vitamins, in the gut of GF mice may contribute to epigenetic methylations(Reference Høverstad and Midtvedt43,Reference Hasegawa, Ikeda and Yamasaki44) , including leptin promoter methylation. However, whether this happens could not be answered and needs to be clarified further.
Theoretically, faecal SCFA in GF mice are not produced because of no fibre or starch is fermented by gut microbiota. However, GF animals have low, but measurable, concentrations of SCFA in the intestinal content compared with CV animals, and most of them probably originate mainly from the diet(Reference Huang, Zhang and Plec45). In this study, the non-reduction but even increase in faecal and plasma SCFA in GF mice might be primarily attributable to the down-regulated expression of the hepatic enzymes Acss2 and Aacs, which function to convert acetate to acetyl-CoA, and acetoacetate to acetoacetyl-CoA in the cytosol, thus leading to the accumulation of SCFA(Reference Hasegawa, Ikeda and Yamasaki44,Reference Huang, Zhang and Plec45) . Nonetheless, the underlying mechanisms need to be investigated.
Leptin resistance is defined by the inability of obese individuals (humans or animals) to respond to an elevated level of endogenous or exogenous leptin. The lack of response to leptin due to the development of resistance to the hormone may blunt the central and peripheral actions of leptin(Reference Sáinz, Barrenetxe and Moreno-Aliaga5). However, recent data show that DIO mice may conserve a cellular and physiological response to endogenous leptin, highlighting the need to redefine the concept of ‘leptin resistance’(Reference Balland and Cowley46). For example, it has been reported that DIO causes severe but reversible leptin resistance in arcuate melanocortin neurons(Reference Enriori, Evans and Sinnayah47). In another study, the DIO mice that received a leptin receptor antagonist showed an increase in food intake and body weight to a similar extent observed in lean mice receiving the same treatment, indicating that DIO mice retain endogenous leptin action(Reference Ottaway, Mahbod and Rivero48). Similarly, in our study, we found that exogenous leptin administration reduced body weight both in lean and DIO mice, with up-regulated expression of adipose Lep-R and down-regulated expression of hypothalamic Socs3, indicating that leptin sensitivity at its receptor or downstream pathways still exists. Furthermore, adipose expression of genes involved in fat hydrolysis and fatty acid oxidation was up-regulated by exogenous leptin administration in CV instead of GF mice, even if the change in body weight reduction was less in mice fed HFD than NFD. This is in keeping with others’ findings that in vivo administration of leptin leads to a suppression of lipogenesis, an increase in TAG hydrolysis and an increase in fatty acid and glucose oxidation through pathways of Lep-R and sympathetic innervation(Reference Harris49). Thus, given that almost no changes were shown in the expression of associated genes in the liver and hypothalamus after treatment with exogenous leptin, it is concluded that GF mice had a lower sensitivity to exogenous leptin in the adipose tissue.
Conclusion
In summary, the leptin expression was increased in GF mice with modification of DNA methylation at its promoter, which was probably induced by increased hepatic SCFA production, indicating increased risks of leptin resistance in GF mice. However, the effects of the gut microbiota on obesity and leptin expression were overridden to some extent by HFD feeding.
Acknowledgements
This work was supported by the National Natural Science Foundation of China (to K. Q. no. 81670775), the Beijing Natural Science Foundation (no. 7184209 to T. T.) and the Research Funds of Profession Quota Budget from Beijing Municipal Science and Technology Commission (2018-bjsekyjs to K. Q.).
The authors’ contributions are as follows: H. Y. and K. Q. designed the research. H. Y. carried out the animal study and performed the experiment. H. Y., X. F., Y. W. and T. T. examined mRNA expressions of associated genes. C. F. analysed DNA methylation. R. W. analysed SCFA concentrations in faeces and plasma. H. Y. and K. Q. prepared the manuscript. All authors read and approved the final manuscript.
The authors declare that there are no conflicts of interest.
Supplementary material
For supplementary material referred to in this article, please visit https://doi.org/10.1017/S0007114520001117


