


The prevalence of obesity has nearly tripled worldwide in the past 50 years, reaching pandemic levels(1). Excess energy intake has been associated with increased fat accumulation or adiposity, which partially explain the enlargement of white adipose tissue during prolonged positive energy balance conditions(Reference Longo, Zatterale and Naderi2). In these conditions, adipocytes expand their cell number and size to compensate the need for increased lipid storage. The increased cell number, namely hyperplasia, is mainly orchestrated by the adipogenic factor PPARγ (Reference Okuno, Tamemoto and Tobe3).
However, adipocytes inevitably reach a limit at which additional anabolic pressure cannot be accommodated, due to cell and tissue expansion limitations(Reference Reilly and Saltiel4). Then, cell size increases, a process called hypertrophy. As mentioned, energy surplus requires adipose tissue expansion and this allows the storage of TAG in the fat droplet of adipocytes. The latter process is named lipogenesis. Conversely, the mobilisation of TAG as fatty acids, when energy is needed, is called lipolysis. Both are regulated by insulin and epinephrine, hormones that control the activity of lipogenic and lipolytic enzymes(Reference Page-Penuelas, Jimenez and Moreno5). Examples of lipogenic enzymes include phosphoenolpyruvate carboxykinase (PEPCK) and stearoyl-CoA-desaturase 1 (SCD-1). Under fasting conditions, when high levels of epinephrine exist, lipolysis is activated by the G-protein-coupled receptor and beta-adrenergic receptor (βADR), promoting the phosphorylation of hormone-sensitive lipase (HSL)(Reference Lafontan, Barbe and Galitzky6). Activated HSL generates monoglycerides from TAG, and further beta-oxidation of fatty acids can take place(Reference Schlaepfer and Joshi7).
On the other hand, it is well known that nutrients such as dietary fatty acids have influence over body composition and metabolic health. Recently, trans-palmitoleic acid (TP), a sixteen-carbon, trans-MUFA (trans-C16 : 1, n-7), has been investigated. TP is considered a biomarker of dairy consumption(Reference Mozaffarian, Cao and King8,Reference Mozaffarian, de Oliveira Otto and Lemaitre9), and it is found in the lipid fraction of whole milk and yogurt and to a significantly lesser extent, in hydrogenated oils(Reference Frigolet and Gutierrez-Aguilar10). Clinical studies have demonstrated that increased serum TP is related to lower risk of diabetes and lower insulin resistance in individuals with multiethnic origin(Reference Mozaffarian, Cao and King8,Reference Mozaffarian, Cao and King11,Reference Imamura, Fretts and Marklund12). Importantly, BMI and waist circumference, known factors associated with adiposity, have been inversely correlated with serum TP concentration(Reference Mozaffarian, Cao and King8). However, to our knowledge, no studies regarding TP supplementation in diet-induced obesity (DIO) animal models have been designed to explore lipid metabolism and adiposity. Thus, we hypothesise that TP reduces adiposity through increased adipose tissue lipolysis. Therefore, the aim of the present study was to evaluate the effect of TP over adiposity and lipid metabolism-related gene expression in a rodent model of DIO.
Methods
Animals
Male C57BL/6 mice (8 weeks old) weighing an average of 20 g were fed experimental diets ad libitum and housed individually in a 12 h light–12 h dark cycle and controlled environment (Easy Flow, Techniplast) during 11 weeks. Also, animals had free access to filtered water, high-quality bedding and nesting environmental enrichment. All animal protocols were approved by the Ethical and Research Committees (HIM 2016/079), Hospital Infantil de México Federico Gómez, and carried out in accordance with the ARRIVE guidelines. For this study, we used two cohorts and confirmed reproducibility, since results were always comparable between cohorts. Each cohort consisted of 7–8 animals per group, and therefore, a total of fifteen animals per group per diet was included to report results. Four experimental diets were administered: control (Control: 15·9 kJ/g, 11 % energy from lipids), control plus TP (Control TP: 15·9 kJ/g, 11 % energy from lipids, TP: 3 g/kg of diet), high-fat diet (High fat: 19·7 kJ/g, 44 % energy from lipids) or high-fat diet plus TP (High-fat TP: High fat: 19·7 kJ/g, 44 % energy from lipids, TP: 3 g/kg of diet). The composition of these diets is summarised in Table 1. At the beginning of each experiment, animals were randomised in order to achieve similar initial body weight average. Body weight and food intake were monitored every week. By week 11, animals were fasted for 12 h and euthanised by cervical dislocation. Immediately, epididymal and mesenteric adipose tissues as well as liver were weighed and frozen in liquid N2 and stored at −80°C.
Diet composition
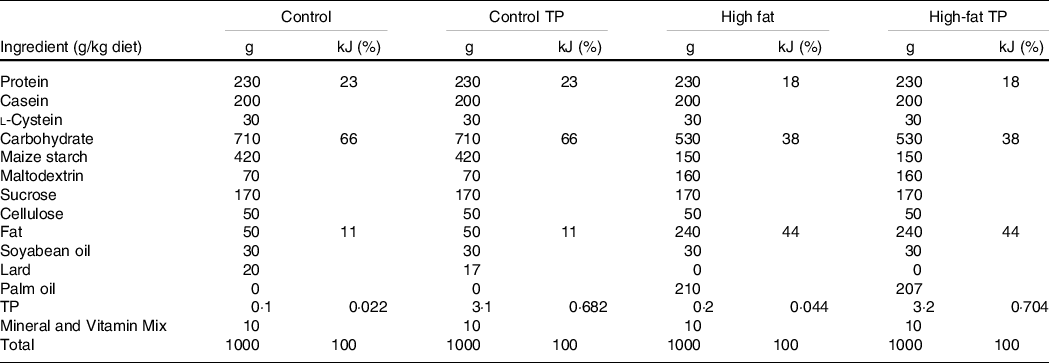
TP, Trans-palmitoleic acid.
Biochemical parameters
Blood sampling was performed in 12-h fasted animals. Serum was obtained by blood centrifugation and used to determine TP, glycerol and leptin concentrations.
The extraction of TP was carried out according to the Bligh–Dyer protocol with slight modifications. A serum sample was mixed with methanol:chloroform (1:1), vortexed and centrifuged. The organic phase was recovered and concentrated using a Speedvac (Thermo Scientific) and resuspended in acetyl chloride:methanol (1:9) and hexane. This solution was transferred to a reaction vial and heated at 100°C during 1 h for acidic methylation reaction. After cooling to room temperature, potassium carbonate (0·44 m) was added and the mixture was vortexed and centrifuged for 4000 rpm for 5 min. The upper phase (hexane) was recovered and concentrated in a Speedvac. The precipitate obtained was dissolved in methanol and injected in a GC/MS system (Agilent 5977A/7890B) with an automatic autosampler (G4513A), following the next specifications: split 1/30, column flow 1 ml/min, inlet temperature 200°C, EI (electronic impact) source temperature 200°C, interface temperature 250°C. In this method, we utilised a DB-225 MS column (30 m × 250 µm × 0·25 µm-Agilent) and helium 99·9999 % was used as a mobile phase. The running method consisted of two steps: 80–140°C (heating rate 3°C/min) and 140–153°C (heating rate 0·5°C/min). TP (Nu-chek, U-41A-O12) was used as a pure standard to determine the retention time (43·8 min) and to perform external standard quantification using the ions 55, 69, 83, 97 and 111 (r 2 > 0·98, % relative SD 2·55, limit of detection 1·4 ng/µl, limit of quantification 4·6 ng/µl). Data were obtained and processed with Mass Hunter Analysis (Agilent).
Glycerol (Sigma, Saint Louis, MAK117-1KT) and leptin (Abcam, ab100718) concentrations were estimated in serum by using the relevant colorimetric or ELISA kits, respectively, according to the manufacturers’ instructions.
Histology
Adipose tissue segments (epidydimal and mesenteric) were fixed in formalin (10 %). Segments were paraffin-embedded and cut into 6 μm slices and fixed on slides. The slides obtained were subjected to haematoxylin–eosin staining and scanned in Aperio CS2 (Leica Biosystems). Cell number was determined in three different sections of each sample. Adipocyte area was measured using ten random cells in three different sections of each sample. Both cell number and adipocyte area were determined with ScanScope Software (Leica Biosystems).
Liver TAG quantification
Livers remained stored at −80°C until sectioned. A fragment of approximately 25 mg was used to extract hepatic lipids using a Lipid Extraction kit (Chloroform-Free; Abcam). The segments were disrupted with Tissue Ruptor (Qiagen) in extraction buffer and centrifuged at 10 000 g during 5 min. The organic phase was recovered and desiccated in a SpeedVac (Thermo Scientific) until a thin layer of lipids was obtained. The lipid extract was resuspended, and TAG were quantified with an Infinity™ Triglycerides Liquid Stable Reagent (Thermo Scientific) in spectrophotometer Multiskan Go (Thermo Scientific) at 500 nm.
Real-time quantitative PCR
Total RNA was extracted from epididymal and mesenteric adipose tissues with the RNeasy mini kit (Qiagen). Quality and integrity of RNA were confirmed by the ratio of absorbance at 260/280 nm and by inspection of the 28S and 18S rRNA bands in agarose gels. RNA was quantified and stored at −80°C. cDNA was generated by reverse transcriptase reactions using Script cDNA Synthesis Kit (Jena Bioscience) reagents. The PCR primers were obtained from Applied Biosystems. Primers to examine the expression of lipogenesis-related genes were PPARγ, Mm00440940_m1; SCD-1, Mm00772290_m1 and PEPCK, Mm01247058_m1. Lipolysis-related gene expression was investigated using the primers as follows: FABP4, Mm00445878_m1; β-ADR, Mm02601819_g1; HSL, Mm00495359_m1 and CPT1α, Mm01231183_m1. Real-time quantitative PCR analysis was performed in ninety-six-well plates using UNG-Master Mix in 10 ul reaction mixtures with a Stratagene Mx3005P (Agilent Technologies) as described by ABI Prism User Bulletin #2, with the following settings: 50°C for 2 min, 95°C for 10 min, 50 cycles of 95°C for 15 s and 60°C for 1 min. Samples were performed in triplicate. Results were normalised to RPL32, Mm02528467_g1 and analysed with Agilent Aria software version 1.7 by using the relative quantification method (ΔΔCT).
Statistical analysis
In order to estimate the sample size, we used our previous values of weight gain in our model. With an effect size of 0·73, an α error of 0·05, and a statistical power of 0·95, the G*Power software calculated a total sample size (including our two cohorts) of sixty for the four experimental groups. The results are presented as means with their standard errors. One- or two-way ANOVA, followed by Tukey’s significant difference test, was used for analysis (GraphPad Prism, version 7.0). Differences were deemed to be significant at P < 0·05 and were indicated by the letters in the figures, where ‘a’ was the highest value (a, b, c, d).
Results
Trans-palmitoleic acid prevents increased weight gain induced by high fat
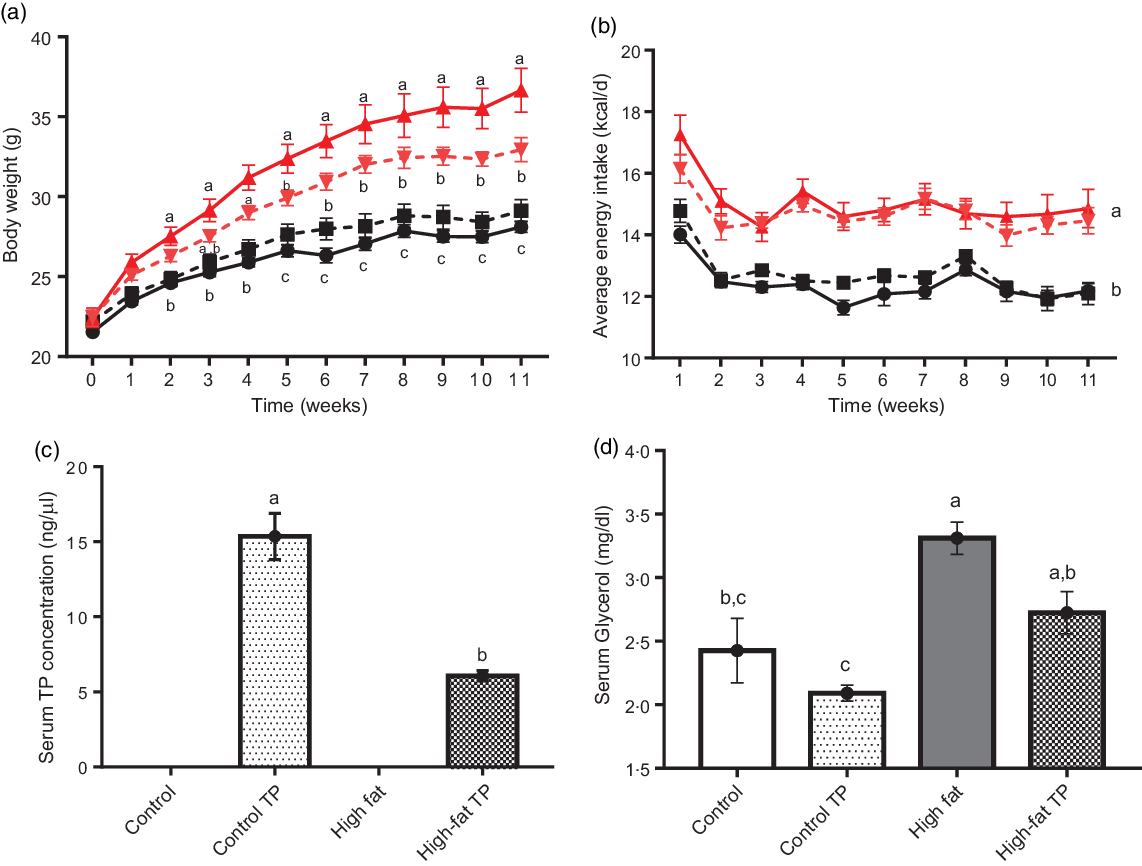
First, we show that body weight was increased in the high-fat groups in comparison with the control groups. Moreover, TP added to the diet was able to prevent weight gain induced by high-fat consumption (Fig. 1(a)). Body weight difference between the High-fat and High-Fat TP groups in the final week was −3·72 g (95 % CI −6·8, −0·64, P = 0·02), representing a percentage difference of −10·15 %. Total energy intake was increased in animals with high-fat diets in comparison with control diets, as expected, but no effect of TP over energy intake was observed (Fig. 1(b)). Next, we verified TP concentration in serum after consumption of TP-containing diets and found undetectable levels in the Control and the High-fat group, but increased TP in the serum of TP-fed mice (Fig. 1(c)). Moreover, higher glycerol concentrations were found in the High fat compared with the Control animals, as previously demonstrated in DIO models(Reference Morigny, Houssier and Mouisel13). However, a trend for lowering glycerol by TP is noted (Fig. 1(d), Control v. High Fat, P = 0·0044; High Fat v. High-Fat TP, P = 0·0746).
Administration of trans-palmitoleic acid (TP) in a High-fat diet reduces weight gain in C57BL/6 mice. Mice were divided into four groups and fed experimental diets (Control ![]() , Control TP
, Control TP ![]() , High fat
, High fat ![]() and High-fat TP
and High-fat TP ![]() ). (a) Body weight (P < 0·05; n 14–18) and (b) energy intake (P < 0·01; n 14–18) were measured weekly during the feeding period. At the end of this period, (c) serum TP concentration was determined by GC/MS (P < 0·0001; n 11–12, Control and High-fat groups are reported as ‘not detected’) and (d) serum glycerol (P < 0·05; n 8–9) was quantified by colorimetric assay. Body weight, energy intake and serum glycerol data sets were analysed by one- or two-way ANOVA and post hoc Tukey’s test. Serum TP data were analysed by Student’s t test. Statistical differences are indicated with a, b and c. Values are presented as means with their standard errors.
). (a) Body weight (P < 0·05; n 14–18) and (b) energy intake (P < 0·01; n 14–18) were measured weekly during the feeding period. At the end of this period, (c) serum TP concentration was determined by GC/MS (P < 0·0001; n 11–12, Control and High-fat groups are reported as ‘not detected’) and (d) serum glycerol (P < 0·05; n 8–9) was quantified by colorimetric assay. Body weight, energy intake and serum glycerol data sets were analysed by one- or two-way ANOVA and post hoc Tukey’s test. Serum TP data were analysed by Student’s t test. Statistical differences are indicated with a, b and c. Values are presented as means with their standard errors.
Trans-palmitoleic acid decreased visceral adipose tissues weight and leptin serum concentration
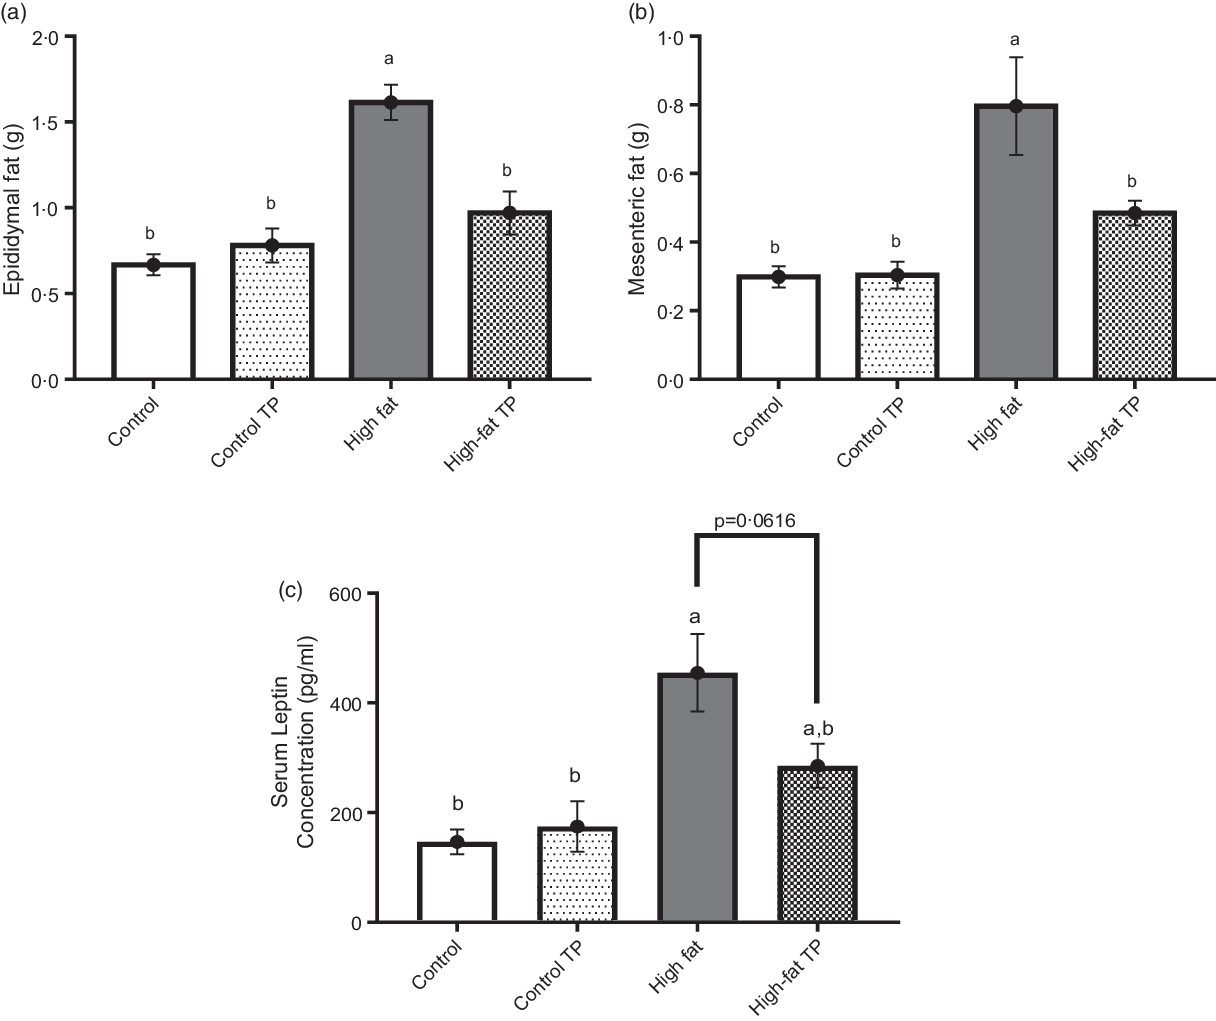
Since body weight gain was prevented by TP consumption, we explored visceral fat pads weight from experimental animals. Both epididymal and mesenteric adipose depots were reduced in the High-fat TP v. the High-fat group (Fig. 2(a) and 2(b)). Consistently, serum leptin was significantly augmented by high fat and slightly decreased (P = 0·062) by the addition of TP (Fig. 2(c)). In summary, these results suggest that TP in the diet promotes lower adiposity in animals fed with high-fat diet.
Feeding a High-fat diet supplemented with trans-palmitoleic acid (TP) reduces adipose tissues weight. After the feeding period, (a) epididymal (P < 0·005; n 8–9) and (b) mesenteric (P < 0·05; n 8–9) adipose tissues were obtained and weight. (c) Serum leptin concentration (P < 0·05; n 5–13) was determined by ELISA. The results of the two-way ANOVA and post hoc Tukey’s test are indicated with a and b. Values are presented as means with their standard errors.
Trans-palmitoleic acid has influence over adipocyte size and cell number in epididymal and mesenteric adipose tissues
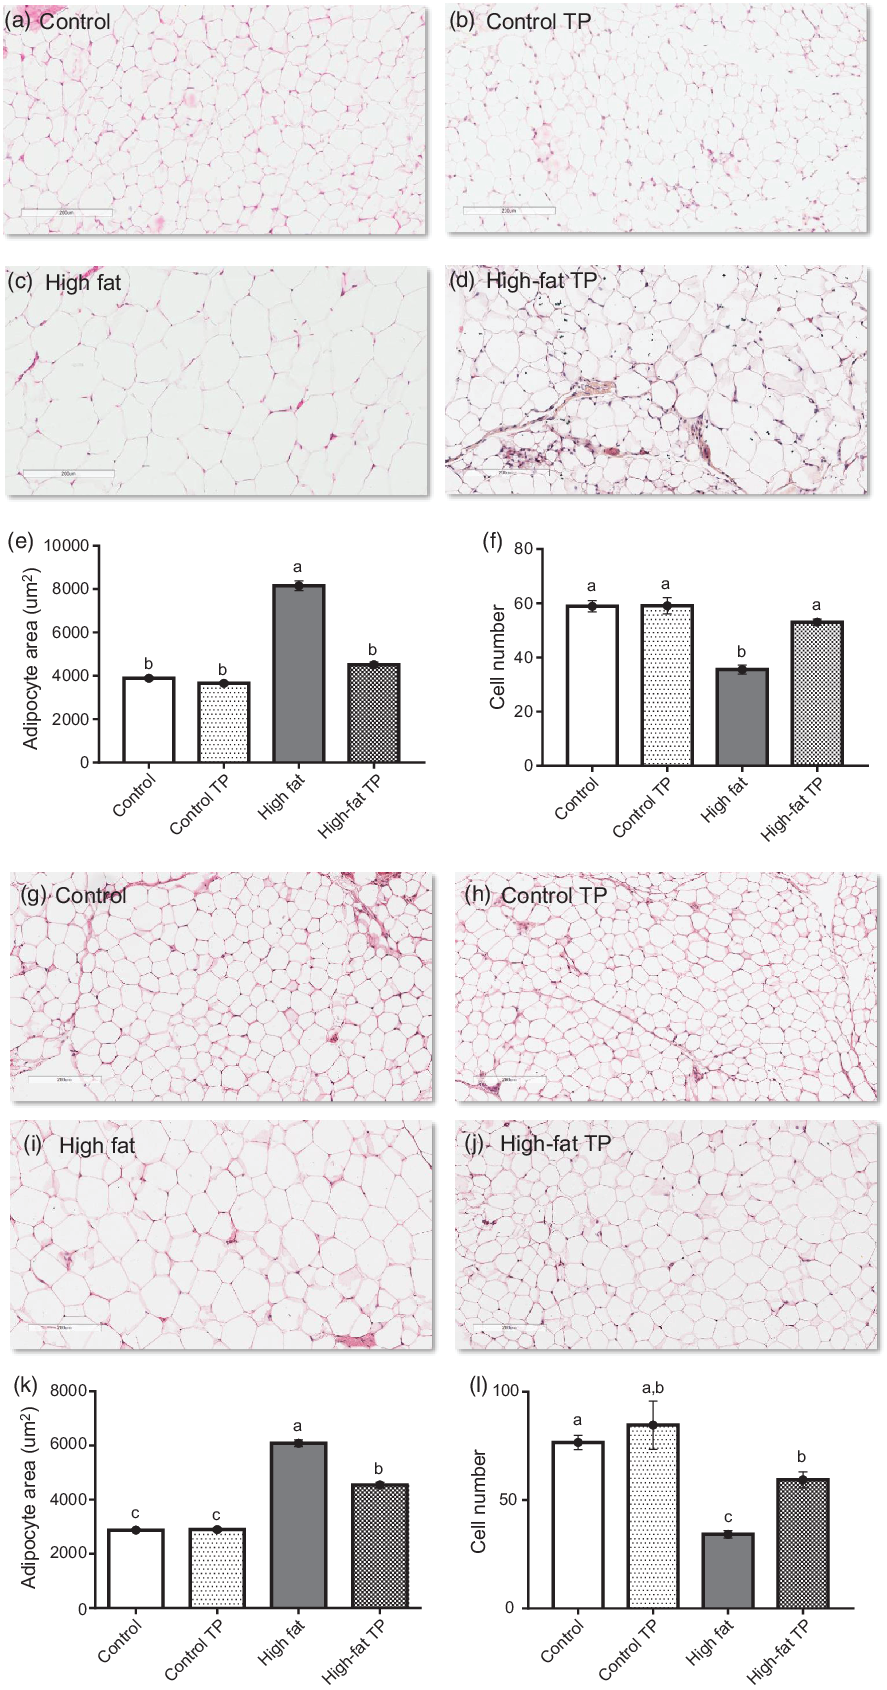
We performed histological analysis of visceral adipose tissue segments stained with haematoxylin–eosin. Representative images of epididymal (Fig. 3(a)–(d)) and mesenteric (Fig. 3(g)–(j)) adipose depots showed distinct adipose cell size throughout groups. Adipocyte size is decreased, while cell number is increased by TP in epididymal (Fig. 3(e) and 3(f)) and mesenteric (Fig. 3(k) and 3(l)) fat depots of animals fed a high-fat diet.
Adipocyte size in epididymal and mesenteric fat pads was smaller in mice fed a high-fat diet with trans-palmitoleic acid (TP). Sections from epididymal adipose tissues (a)–(d) from all groups were obtained and stained with haematoxylin–eosin. Using the software ImageScope (Aperio), (e) adipocyte area (P < 0·01; n 5–6) and (f) cell number (P < 0·0001; n 5–6) from epidydimal fat were determined. The sections from mesenteric adipose tissues (g)–(j) from all groups were analysed and (k) adipocyte area (P < 0·0001; n 5–6) and (l) cell number (P < 0·05; n 5–6) were determined. Representative images were obtained at 10× magnification. All data sets were analysed by two-way ANOVA and Tukey’s test as post hoc. Statistical differences are indicated with a, b and c. Values are presented as means with their standard errors.
Trans-palmitoleic acid modifies gene expression of lipolytic enzymes in epididymal adipose tissue
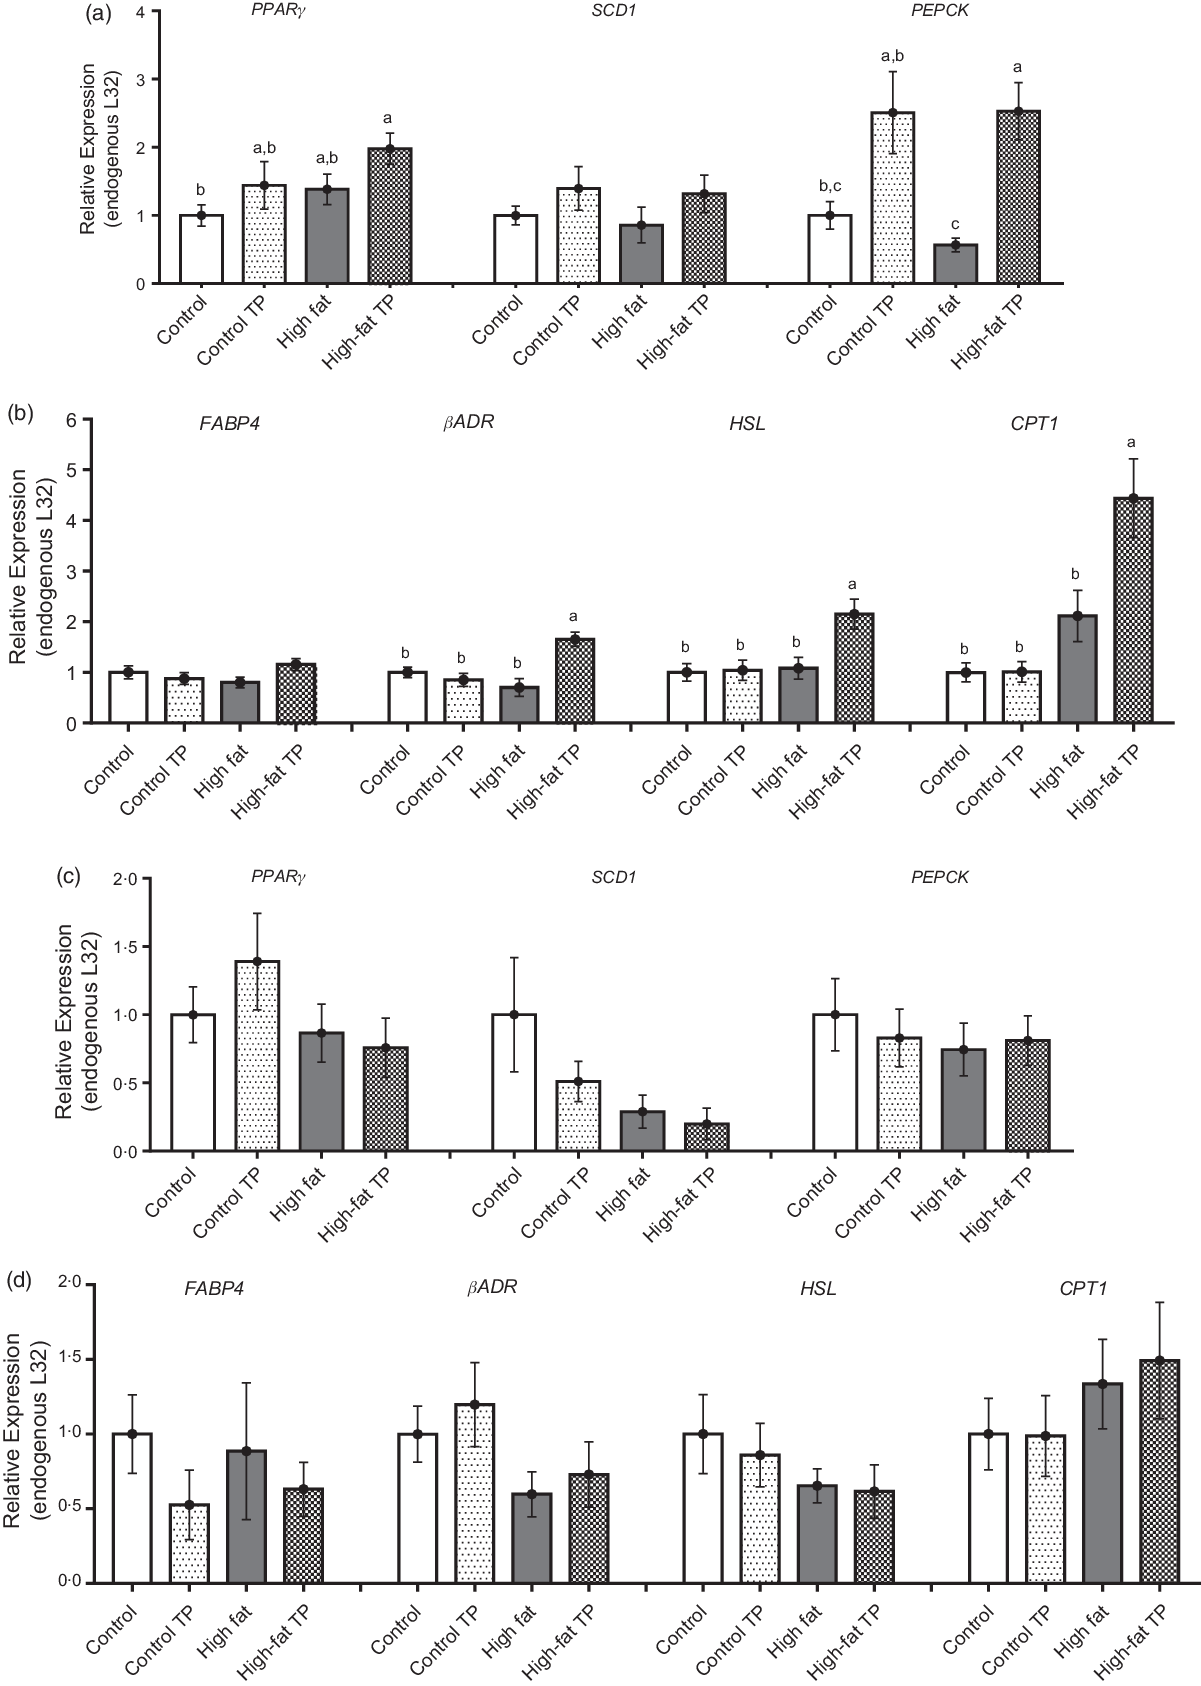
Adipocyte size is the result of lipid storage or utilisation from the lipid droplet, and therefore, we investigated the expression of enzymes involved in such processes, that is, lipogenesis and lipolysis. In the epididymal depot, TP tended to augment PPARγ, although this difference was not statistically significant, but increased PEPCK expression significantly under high-fat conditions (Fig. 4(a)). In addition, in epididymal adipose tissue, the expression of lipolytic factors as βADR, HSL and CPT1 was up-regulated in the High-fat TP group in comparison with the High-fat group (Fig. 4(b)). In contrast to the epididymal adipose tissue, TP had neutral influence over lipid metabolism-related gene expression in the mesenteric depot (Fig. 4(c) and 4(d)). This means that the lower fat pad weight and reduced adipocyte size could be explained by the higher expression of lipolysis-related factors, at least, in the epididymal adipose tissue.
Relative expression of lipogenesis and lipolysis-related genes was modified by trans-palmitoleic acid (TP) in epididymal adipose tissues. (a) Lipogenesis in epididymal fat was evaluated through the relative expression of PPARγ (P < 0·05; n 9–13), SDC1 (n 10–12) and phosphoenolpyruvate carboxykinase (PEPCK) (P < 0·05; n 8–13). (b) Lipolysis-related gene expression in epididymal fat was assessed through FABP4 (n 10–13), beta-adrenergic receptor (βADR) (P < 0·01; n 8–12), hormone-sensitive lipase (HSL) (P < 0·05; n 10–13) and CPT1 (P < 0·05; n 9–12). For mesenteric adipose tissue, (c) lipogenesis was evaluated through the relative expression of PPARγ (n 9–14), SDC1 (n 9–13) and PEPCK (n 4–5). (d) Lipolysis was evaluated through the relative expression of FABP4 (n 9–13), βADR (n 9–12), HSL (n 8–14) and CPT1 (n 4–5). All data sets were analysed by two-way ANOVA and Tukey’s test as post hoc. Statistical differences are indicated with a, b and c. Values are presented as means with their standard errors.
Discussion
Obesity and its metabolic consequences have become a world health problem. Dietary strategies to avoid adiposity and metabolic abnormalities include modifications in carbohydrate and lipid type as well as their concentrations(Reference Abete, Astrup and Martinez14). For instance, the effects of diverse fatty acids on metabolism have been extensively studied. Yet, TP, which is derived from dairy fat, a major component of many traditional diets, has been understudied for its health effects. Classically, trans-fatty acids consumption has been associated with cardiovascular risk, but epidemiological data have shown neutral effects of TP on dyslipidaemia and CVD(Reference de Oliveira Otto, Nettleton and Lemaitre15), stroke(Reference Yakoob, Shi and Hu16) and blood pressure(Reference Mozaffarian, Cao and King8). Moreover, naturally occurring TP concentrations have been inversely related to sudden cardiac death in a cohort of hospitalised German patients(Reference Kleber, Delgado and Lorkowski17). A meta-analysis which combined sixteen cohorts (seven from the USA, seven from Europe, one from Australia, one from Taiwan) from twelve countries evaluated sixty-three, 682 participants without baseline type 2 diabetes, among whom 15 158 developed incident type 2 diabetes over up to 20 years of follow-up. This investigation concluded that individuals with higher circulating and tissue TP concentrations maintain lower risk of developing type 2 diabetes independently of age, sex, race/ethnicity, socio-economical status, physical activity and obesity(Reference Imamura, Fretts and Marklund12).
Regarding adiposity, in the Cardiovascular Health Study cohort, circulating TP was associated with slightly lower BMI and waist circumference(Reference Mozaffarian, Cao and King8). However, to our knowledge, no TP supplementation experiments in animal models of DIO have confirmed less weight gain, nor reduced adiposity.
In this paper, we aimed to discover if the consumption of TP reduced adiposity in a rodent model of DIO. First, obesity was generated by the administration of 45 % energy as fat in the high-fat groups. As judged by body weight, our results showed that TP supplementation was able to avoid higher weight gain by high-fat concentration in the diet, which could be related to obesity prevention. However, in animals fed control diets, TP supplementation did not modify weight gain. Second, TP concentration in the diets was 3 mg/g diet, which can be compared with the total amount of TP in two cups of cow milk(18). Therefore, the TP concentration in the diet designed for our study is expected to be achievable in a regular human diet. Also, to verify that TP supplementation was associated with increased serum concentrations, we measured TP by GC/MS. We found that TP was undetectable in animals fed with Control or High-Fat diet. However, the concentrations of TP were detected in the TP groups, as expected, being higher in the Control TP v. the High-Fat TP group. We speculate that TP was possibly incorporated more efficiently into phospholipids and TAG of fat cells from the High-Fat TP group. Thus, if the serum presence of free TP is decreased in the High-Fat TP group, then it may be present in adipose tissue lipids, where it exerts its effects. Previous studies with dietary trans-oleic acid (18 : 1, n-9 or elaidic acid) and conjugated linoleic acid have demonstrated that these can be effectively incorporated into adipose tissue of mammals(Reference Schrock and Connor19,Reference Tischendorf, Mockel and Schone20). A recent human TP supplementation dosing study reports that sea buckthorn oil enriched in TP increases TP serum concentrations, while sea buckthorn oil without TP does not(Reference Huang, Matthan and Galluccio21). Future experiments should be performed to confirm if TP supplementation leads to incorporation of these fatty acids into adipose tissue or other organs’ lipids.
As expected, our results showed that DIO caused increased body weight, adiposity and leptin serum concentrations. Interestingly, the addition of TP in the diet was able to decrease weight gain, visceral adipose depots weight and revealed a trend to decrease serum leptin concentrations in high-fat-fed animals. The fact that TP lowered adiposity and tended to decrease serum leptin is in agreement with other investigations that have consistently concluded that leptin reflects body fat mass(Reference Friedman22) and that prevention of adipose tissue growth is related to decreased circulating leptin.
The expansion of adipose tissue during obesity is accompanied by adipocyte morphology modifications, which include changes in size (hypertrophy) and changes in cell number (hyperplasia)(Reference Wang, Tao and Gupta23). After we observed that TP induced lower body weight and adiposity, we wanted to know if adipocyte morphology was modified by TP in this DIO model. Indeed, the consumption of TP induced decreased cell size and increased number of adipocytes in both epididymal and mesenteric fat pads. Adipocyte size and number are features of adipocyte functionality and reveal lipid metabolism in adipose tissues. The presence of smaller and more numerous adipocytes is accepted to correlate with healthy adipose tissue expansion, preventing the development of hypertrophic obesity, which is associated with lipotoxicity and metabolic diseases(Reference Gustafson, Hammarstedt and Hedjazifar24). Therefore, supplementation with TP prevents adipose tissue growth by increased fat cell volume and increases the number of adipocytes, possibly avoiding its detrimental metabolic consequences.
In addition, the increased number and decreased cell size of adipocytes driven by TP could be responding to modifications in the adipogenic, lipogenic and lipolytic pathways. Hence, we measured the expression of the key genes involved in such processes. Only a trend to be increased in the epididymal depot of High-Fat TP mice was found for the adipogenic molecule PPARγ. However, a marked increase in the expression of lipolytic factors is shown in the epididymal fat pad. First, the expression of βADR and HSL is higher in High-Fat TP animals v. the High-Fat group. As mentioned, βADR induces HSL activation in order to hydrolyse TAG into fatty acids. In fact, it has been shown that both βADR and HSL are up-regulated by leptin via sympathetic activation. In this respect, adipose βADR mRNA is increased after leptin administration in ob/ob mice(Reference Breslow, An and Berkowitz25). Moreover, leptin stimulates HSL activity via β-adrenergic activity rising sympathetic inputs in white adipose tissue(Reference Zeng, Pirzgalska and Pereira26). Our data suggest that TP induces lipolysis in epididymal adipose tissue under high-fat feeding conditions, while maintaining leptin concentrations in serum, which could reveal adequate leptin action or absence of leptin resistance. Thus, TP could be augmenting lipolysis via sympathetic activation explaining decreased adiposity and adipocyte size.
Interestingly, apart from lipolytic genes, CPT1 is also up-regulated by TP supplementation in the epididymal adipose tissue of mice fed a high-fat diet. CPT1 is a rate-limiting enzyme involved in fatty acid utilisation responsible for transferring fatty acids into the mitochondria for oxidation(Reference Warfel, Vandanmagsar and Dubuisson27). It has been demonstrated that overexpression of a permanently active mutant form of CPT1α in adipocytes enhances fatty acid oxidation, decreasing TAG accumulation(Reference Malandrino, Fucho and Weber28). Since TP promotes CPT1α expression, its influence probably leads to fatty acid oxidation and reduction of TAG content, which is consistent with decreased adipocyte size. On the other hand, because lipolysis and fatty acid oxidation-related genes are induced by TP, it would be expected that glycerol is released into circulation. However, a trend to significance in serum glycerol concentrations was observed. In fact, increased PEPCK expression, which is related to glyceroneogenesis(Reference Franckhauser, Munoz and Pujol29), is shown in the TP-fed groups. Glyceroneogenesis is critical for the recycling of NEFA to TAG after lipolysis is induced(Reference Hanson and Reshef30) in mammals. This could mean that not only lipolysis but also efficient TAG storage occurs in adipose tissue of mice that consumed TP, preventing lipid overload in non-adipose tissues. The latter is coherent with the trend in reduced liver TAG content in mice that consumed TP and high fat.
Our results demonstrate that decreased adiposity and adipocyte size are associated with increased expression of lipolysis-related molecules in epididymal fat of mice that were supplemented with TP in the DIO model. Although we found that adipocytes from mesenteric adipose tissue were also more numerous and smaller, we could not associate this fact with modifications in lipolysis, as there was no difference in the expression lipolytic genes. Some studies have suggested inverse lipolysis regulation in gonadal v. mesenteric adipose tissues of DIO mice(Reference Wueest, Yang and Liu31). Therefore, the mechanisms by which TP maintains adipocytes size in the mesenteric depot remain unknown, and other key lipogenic and adipogenic factors could be explored in the future.
In summary, we show for the first time that TP supplementation prevents weight gain, decreases adiposity and adipocyte size, which was associated with increased lipolysis-related gene expression in epididymal fat of a DIO rodent model. Moreover, TP displayed such effects in the High-Fat groups, suggesting that its consumption could compensate the metabolic abnormalities that obesity conveys.
Acknowledgements
We thank Guillermina Baay and Francisco Arenas for providing equipment, and Daniel Hernández for preparing slides in the course of the histology analysis.
Funding was received from National Science and Technology Council (SEP-Conacyt 281824), Danone Institute in Mexico, Mexican Federal Funds HIM 2016/079/SSA1359, Facultad de Medicina (UNAM) and IBM Community Grant. Funders had no role in the design, analysis or writing of this article.
L. I. C. O. participated in animal care, biochemical parameters determination, performed qPCR and data analysis. B. D. T. and M. R. H. contributed to animal care and histology analysis. R. G-A. contributed substantially to analysis, interpretation, discussion of the data and manuscript revision. M. E. F. planned the project, found financial support, analysed the data and wrote the manuscript.
There are no conflicts of interest.
Supplementary material
For supplementary material referred to in this article, please visit https://doi.org/10.1017/S0007114521001501


