





1 Introduction
New high-intensity laser facilities around the world[Reference Danson, Hillier, Hopps and Neely1–Reference Rus, Bakule, Kramer, Naylon, Thoma, Green, Antipenkov, Fibrich, Novak, Batysta, Mazanec, Drouin, Kasl, Base, Peceli, Koubikova, Trojek, Boge, Lagron, Vyhlidka, Weiss, Cupal, Hrebicek, Hribek, Durak, Polan, Koselja, Korn, Horacek, Horacek, Himmel, Havlicek, Honsa, Korouš, Laub, Haefner, Bayramian, Spinka, Marshall, Johnson, Telford, Horner, Deri, Metzger, Schultze, Mason, Ertel, Lintern, Greenhalgh, Edwards, Hernandez-Gomez, Collier, Ditmire, Gaul, Martinez, Frederickson, Hammond, Malato, White and Houzvicka4] based on chirped pulse amplification (CPA)[Reference Strickland and Mourou5] have revolutionized both our understanding and use of plasma physics. Recent advancements in laser technology have stimulated the development of petawatt (PW) systems up to 3.3 Hz[Reference Wang, Wang, Rockwood, Luther, Hollinger, Curtis, Calvi, Menoni and Rocca6]. The ‘ELI-Beamlines facility’[Reference Mourou, Korn, Sandner and Collier7, 8] in Dolní Břežany, close to Prague in the Czech Republic, is based on the European Strategy Forum on Research Infrastructures (ESFRI) process[9]. The project is executed in close partnership with Lawrence Livermore National Laboratory and a European–US consortium from Ekspla (Lithuania) and National Energetics. The international user facility will provide access to laser technology that is beyond the current state of the art. The 1 PW at a repetition rate of 10 Hz of HAPLS (High-repetition-rate Advanced Petawatt Laser System) and the 10 PW at 1.5 kJ in 150 fs at a shot rate of one pulse per minute will allow the generation of ultra-high focused laser intensities approaching the ultra-relativistic regime ( ${10}^{23}\kern0.3em \mathrm{W}/{\mathrm{cm}}^2$) for fundamental physics research including vacuum interactions. The Plasma Physics Platform (P3) installation of ELI-Beamlines will be a unique platform for research on any topic related to high-energy-density physics[Reference Jourdain, Chaulagain, Havlik, Kramer, Kumar, Majerova, Tikhonchuk, Korn and Weber10, 11] and ultra-high-intensity interaction[Reference Weber, Bechet, Borneis, Brabec, Bucka, Chacon-Golcher, Ciappina, DeMarco, Fajstavr, Falk, Garcia, Grosz, Gu, Hernandez, Holec, Janecka, Jantac, Jirka, Kadlecova, Khikhlukha, Klimo, Korn, Kramer, Kumar, Lastovicka, Lutoslawski, Morejon, Olsovcova, Rajdl, Renner, Rus, Singh, Smid, Sokol, Versaci, Vrana, Vranic, Vyskocil, Wolf, Yu and Radiat12]. Applications are foreseen for high-brightness X-ray sources and particle acceleration at multi-PW peak powers and operation at repetition rates of up to 10 Hz (in the case of HAPLS)[Reference Prencipe, Fuchs, Pascarelli, Schumacher, Stephens, Alexander, Briggs, Buscher, Cernainu, Choukourov, Marco, Erbe, Fassbender, Fiquet, Fitzsimmons, Gheorghiu, Hund, Huang, Harmand, Hartley, Irman, Kluge, Konopkova, Kraft, Kraus, Leca, Margarone, Metzkes, Nagai, Nazarov, Lutoslawski, Papp, Passoni, Pelka, Perin, Schulz, Smid, Spindloe, Steinke, Torchio, Vass, Wiste, Zaffino, Zeil, Tschentscher, Schramm and Cowan13], which will open the path to fundamental physics research[Reference Mourou, Tajima and Bulanov14–Reference DiPiazza, Müller, Hatsagortsyan and Keitel16], laboratory astrophysics[Reference Remington, Arnett, Drake and Takabe17] and societal applications based on new secondary sources.
This paper focuses on the beam transport (BT) system of the HAPLS to P3 only as it is the first, which became fully operational in the E3 experimental hall at the end of 2019. The branch to the E3 hall with the P3 experimental infrastructure serves as a testbed for qualifying the engineering approach. The HAPLS laser BT system of ELI-Beamlines will guide in the future the 30 J, 30 fs compressed pulses under vacuum also to the other three experimental halls E2, E4 and E5 over distances of up to 100 m and via three switchyards. The commissioning was performed with a maximum pulse energy of 110 mJ.
First light from the HAPLS in P3 was obtained in December 2019. Figure 1 shows the evolution of the experimental hall E3 over less than 2 years. By November 2019, E3 had been operational and ready to receive the HAPLS beam. The P3 chamber was a pure in-house project. The design was initiated in summer 2014 and the chamber was delivered and installed in December 2018.
Left: The state of the experimental hall E3 in January 2018. Note that the P3 chamber is not yet fully assembled. Right: The same location in November 2019 with a fully functional BT system and experimental chamber.

Major upgrades over the following years will include the optical switchyard chamber (MOB) as well as the L4f (10 PW, 1.5 kJ, 150 fs), L4p (sub-aperture L4f beam with adjustable pulse length up to the picosecond regime) and L4n (1.9 kJ in a few nanoseconds) BT systems. By the end of 2022, the experimental hall is planned to look as displayed in Figure 2.
Layout of the experimental hall by the end of 2022. With respect to the present state, the BT for L4f and L4n is missing, as is the MOB chamber.

The remainder of the paper is organized as follows. Section 2 presents an overview of the entire BT system from the compressor to the experimental chamber. The support structures and the most important optomechanical subsystems are described in Sections 3 and 4. The subsequent section, Section 5, discusses the wavefront and damage threshold of the transport mirrors. All aspects related to the cleanliness requirements are addressed in Sections 6. The alignment system and procedure are presented in Section 7, followed by the free-space laser beam propagation in Section 8. Section 9 presents the results of the beam diagnostic. The experimental chamber P3 is presented in Section 10. Section 11 presents the results of a proof-of-principle experiment generating X-rays. Finally, in Section 12, a conclusion and an outlook are given.
2 Overview of the HAPLS BT system
Figure 3 shows a bird’s eye view of the HAPLS vacuum BT, which guides the  $210 \text{ mm} \times 210$ mm 20th-order super-Gaussian compressed beam (30 fs) at ${10}^{-6}$ mbar from the lower periscope mirror of the injector to all target chambers of the experimental halls E2, E3, E4 and E5. Whereas the propagation distance to P3 is 54 m, the beam travels 103 m to E5. The beam pointing stability required for the Laser Undulator X-Ray Source (LUIS) in E5 poses the most demanding engineering challenge for the HAPLS BT. To accelerate electrons in a few 100 μm diameter capillary discharge and to pass them through focusing magnets sufficiently well centred to the entrance of an undulator requires a root-mean-square (RMS) beam pointing stability better than $\le 2\ \mu$rad. Advanced focusing concepts with ellipsoidal plasma mirrors in the P3 target chamber in the plasma physics hall E3 will require similar high pointing stability for the flagship experiments. Based on the experience of other large-scale laser facilities[Reference Burkhart, Bliss, DiNicola, Kalantar, Lowe-Webb, McCarville, Nelson, Salmon, Schindler, Villanueva and Wilhelmsen18] the error budget for the BT pointing stability was set to $1\ \mu$rad RMS to keep the engineering effort reasonable and to be able to complete all designs within 3 years. In addition, the goal was to realize the first BT branch to P3 in less than 4 years. Figure 4 shows a 3D CAD of the HAPLS BT from the injector chamber to the P3 target chamber. Given the large number of mirrors required for the electron acceleration experiments, ELBA, in E5 (up to 12 mirrors), the above pointing specification translates into a pointing requirement per turn point of 200 nrad RMS optical (i.e., in reflection), i.e., 100 nrad RMS mechanical pointing. This requirement was defined assuming as a best-case scenario statistical addition of all pointing RMS values and to have some margin. From experience, it was expected that vibrations of turn points would couple. The most important design guidelines for achieving this stringent stability requirement were as follows.
Top view of the HAPLS vacuum BT system located in the basement of the laser building below the laser floor. The P3 is located in the experimental hall E3.

3D CAD visualization of the HAPLS BT from the injector chamber to the P3 chamber. This figure shows the actual installation in E3.

1. Highest spngness of all supports, breadboards and mounts to minimize the vibration response. This included using granite blocks with monolithic mortar connections and pre-loaded chemical anchor connections to the monolithic floor for all turn points installed close to the floor level; see Figure 4.
2. Highest eigenfrequencies to avoid resonance phenomena caused by vacuum pumps, cleanroom airflow, thermal movement and ambient building vibrations.
3. Rigid fixations of all supports to the monolithic building, which has a measured low vibration level. All anchor connections are via mortar and chemical anchoring for achieving a monolithic connection.
4. Supports for vacuum chambers and mirror mounts/ breadboards, without direct mechanical contact other than via the spng chamber base plate. Edge welded bellows seal the vacuum between the chamber and the base plate to allow mounting of the breadboard feet onto the base plate without touching the chamber.
5. Prototyping of mounts and breadboards to benchmark all finite element analysis (FEA) model predictions against measurements. The latter requires an as complete full system installation as possible because the coupling of high-eigenfrequency ( $>$80 Hz) optomechanics with its support structures may not be neglected.

3 Optimized dynamic design of the mirror towers and breadboards
The main components in the BT system are the  $45{}^{\circ}$ angle of incidence (AOI) transport mirrors, mirror mounts, vacuum chambers for mirror mounts, vacuum BT pipes, mirror tower superstructures and their foundations. A foundation is the spng connection of the mirror tower base to the approximately 1 m thick monolithic concrete floor of an experimental hall. In addition, all towers are monolithically connected to the walls, which have a similar measured vibration level to the floor, when supplies are switched off. The stability design considerations of the BT system depend critically on the vibration stability and spngness of the building, the ambient noise of all infrastructure, including the airflow of the cleanroom air conditioning (AC) as well as thermal movements of all mechanical/vacuum components in the $\pm 0.5{}^{\circ}$C temperature stabilized halls. To establish a baseline design of the BT superstructures and mounts, the vibrations of the building floor, the wall and the ceiling were measured. Figure 5[Reference Heiland21] shows a typical random vibration power spectral density (PSD) plot of the floor of an experimental hall for vibrations in the horizontal direction at the time when no supplies were installed and running. In addition, the dynamic asymptotic spngness of the floor was determined from the response function measured with a calibrated impact hammer and highly sensitive geophones to be ${k}_{\mathrm{assy}}=910$ N/m. These data were the first input for an iterative dynamic impact FEA optimization model. Subsequently the vibration response for different static (5 N constant force acting on a chamber, a worst case based on the measured acceleration of the turbo pumps) and dynamic load cases (measured floor vibrations with different traffic) was modelled, which were considered to be representative for the vibration levels during the final operational phase of the facility. This FEA model was used to optimize the designs of the towers, the optical breadboards and the entire vacuum system, including its massive pipe supports that are designed to damp the measured turbo pump vibrations.
Typical random vibration PSD plot for vibrations in the horizontal direction measured in the experimental halls with no supplies running[Reference Heiland19]. Note that NIF limits the PSD to a maximum of  $1\times {10}^{-10}\kern0.1em {\mathrm{g}}^2/\mathrm{Hz}$ at higher vibration frequencies[Reference Trummer, Foley and Shaw20].

The FEA model predictions of the first four eigenfrequencies of the second tower in E3, L3-E3-F020 (see Figure 4) and its mode shapes are shown in Figure 6. The mode shapes were optimized for the lowest angular/rotational movements, which should be according to the model  $\le 10$ nrad RMS for all towers. Figure 7 shows the measured vibration response and the eigenfrequencies of tower L3-E3-F020 with the PSD input depicted in Figure 8. These eigenfrequencies are in very good agreement with the model predictions in Figure 6[Reference Heiland21].
Model predictions of the L3-E3-F020 tower’s first four eigenfrequencies and mode shapes. The next four eigenfrequencies are at 121.9, 128.5, 136.9 and 148.2 Hz[Reference Heiland21].

Measured PSD spectrum with eigenfrequencies of tower L3-E3-F020.

Measured acceleration PSD of granite block L3-E3-F040 and the tower L3-E3-F020. The PSD on the granite is 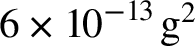 $6\times {10}^{-13}\kern0.1em \textrm{g}^2$/Hz and on the tower $4\times {10}^{-11}\kern0.1em \textrm{g}^2$/Hz for the frequency band from 50 to 300 Hz. The PSD of the granite for frequencies between 1 and 50 Hz is 10–100 times lower than that of the tower.

The optical breadboards, which are used for connecting the mounted BT turn mirrors via the aluminium chamber base plate (see Figures 9 and 10) and the stainless-steel tower top plate, were vibration optimized together with the towers. The 100 mm thick aluminium breadboard with its four monolithic stainless steel support legs is depicted in Figure 9. The calculated first eigenfrequency of the breadboard is 146.5 Hz.
Photo of the 100 mm thick aluminium breadboard with its four monolithic stainless-steel legs.

Mounted HAPLS BT mirror installed in its vacuum chamber and both, chamber and breadboard legs/feet bolted onto the aluminium chamber base plate in ISO 5 class cleanroom.

It is important to note that the vacuum chamber is mounted onto the chamber base plate without a direct spng connection to the breadboard and its legs to minimize the coupling of chamber vibrations and movements to the breadboard and, subsequently, the mounting mirror (see Figure 10). This ‘decoupling’ concept is well established in the high-power laser community.
4 Design and performance of the ultra-stable mirror mounts and switchyards
To achieve an optical pointing stability of 200 nrad for a measured input vibration PSD of  $6\times {10}^{-13}\ \textrm{g}^2$/Hz between 90 and 290 Hz (shown in Figure 8), a first eigenfrequency of at least 75 Hz is required. To have some margin and for the usage of the mount also in the higher PSD vibration input ‘non-decoupled’ P3 target chamber (the breadboard supports are mounted directly onto the P3 chamber floor), the mounts were designed to have a first eigenfrequency above 100 Hz. This requires also a spng glass-to-metal interface for the mirror, which needs to be optimized for negligible wavefront distortions of the mirrors. This includes for the periscope geometry the minimization of the gravity sag due to the own weight of the mirrors. The HAPLS BT mirrors have a $290 \text{ mm} \times 440 \text{ mm} \times 75$ mm size and a mass of 21 kg. The mounted mirror is shown in Figure 10 inside of the ‘decoupled’ vacuum chamber. The total weight of the mount assembly is 175 kg owing to the required high spngness of the mount.
Figure 11 shows a typical response of the mounted mirror to the excitation with a step function (impact hammer) in the frequency domain with a first eigenfrequency at 109 Hz. For this measurement with an Attocube IDS 3010 sensor, the mirror mount was clamped onto its breadboard, which was mounted onto the chamber base plate bolted onto the granite block L3-E3-F040 (see Figures 4 and 12). The IDS 3010 was mounted directly onto the wall of the E3 hall and detected with 10 MHz acquisition rate the vibration-induced distance changes of a 1 inch diameter retroreflecting metal mirror glued onto the top left corner of the mounted aluminium mirror dummy (Figure 12). The IDS 3010 can measure 1 m distance with a relative resolution of  ${10}^{-12}$. The eigenfrequencies were confirmed by measurements with an accelerometer in the same setup and a Renishaw XL-80 interferometer while the mount was installed on an optical table. The model prediction of the first eigenfrequency was, as expected from previous prototyping, approximately $10\%$ higher than the measured value. This is mainly due to the idealization and simplifications used for the model, e.g., ideal contacts between individual parts and simplified bearing contacts. Tolerances and variations in the assembly also lead to a unique vibration signature of each mount that we have measured. In addition, the measured 109 Hz provides a sufficiently high margin to meet our pointing requirements.
Displacement PSD with the first eigenfrequencies of the mirror mount measured with an Attocube IDS 3010 sensor. The first eigenfrequency is at 109 Hz, and the second is at 125 Hz. The mount was clamped onto the breadboard, which was bolted onto the chamber base plate, which was bolted onto the granite block L3-E3-F040; see Figure 4.

Wall-mounted Attocube IDS 3010 sensor with mirror mount bolted onto its breadboard installed on the chamber base plate and granite block L3-E3-F040.

The RMS displacement change of the retro mirror on the upper left corner of the mirror dummy measured at a PSD input of the granite block L3-E3-F040 depicted in Figure 8 (purple curve) is 12.7 nm. The distance of the upper left corner of the mirror dummy to the centre of both rotation axes of the mount is 230 mm. If we assume that the main angular pointing stability originates from the rotation axis of the mount, we calculate 55 nrad RMS mechanical pointing stability, i.e., 110 nrad RMS optical on the granite block. This value is within a factor of two in agreement with a measurement performed with three IDS 3010 sensor heads operated with fixed phase and using precision triangulation.
To direct the HAPLS beam either to hall E2 or towards E3, E4 and E5, a 180° rotation unit is required for the lower periscope mirror of the injector (see Figure 13). In addition, a periscope mirror translation switchyard guides the beam, which travels towards E4, down to the E3 hall, whereas a vertical mirror mount translation switchyard redirects the beam to E5.
Overview of the HAPLS BT switchyards in the E3 experimental hall and the E5 switchyard in the L4c hall.

It is important to note that all switchyards are mounted on towers, which have a measured 10–100 times higher vibration excitation PSD compared with the granite blocks (Figure 8). This makes usage of even pre-loaded translation or rotation stages prohibitive, owing to their relatively low spngness, resulting from their ability to move in a  ${10}^{-6}$ mbar ultra-clean vacuum. In a mock-up testbed, we sandwiched three lubricated translation stages between the mount and the breadboard, which lead to a factor of 4.6 higher vibration response compared with clamping the mount directly with ultra-spng stainless-steel clamps onto the breadboard. When we fully bridged these stages with clamps and bolts, the pointing was still twice as high as for clamping directly onto the breadboard. Clamping the mount via three stainless-steel posts (1 inch diameter) onto the breadboard resulted in the same vibration response as direct clamping onto the breadboard. As a consequence, a kinematic four-point mounting scheme was developed, which divides the forces of one of the three kinematic contact points equally into two connection points. To increase the spngness further, the mounts are clamped with three 2000 N force actuators for the rotation unit and four 2000 N actuators for the translation units onto the kinematic seats. The spngness of the clamped kinematic interface includes the compressive spngness of the material under the weight of the switchyard component and the clamping force in series with the spngness of the physical interface, which increases with pressure. For rotation or translation, the mounted mirror is lifted by actuators and either rotated $180{}^{\circ}$ or linearly driven to the ‘out of the beam’ park position.
5 The mounted wavefront and laser damage threshold of the high-power BT mirrors and their effect on focus quality
The single-pass peak-to-valley (PV) reflected wavefront error (RWE) of the 440 mm × 290 mm × 75 mm dielectrically coated AOI  $=45{}^{\circ}$ transport mirrors was specified to be less than 95 nm (0.117 waves @ 810 nm) for 90% of the full aperture, which is $396 \text{ mm} \times 261$ mm. Given the $210 \text{ mm} \times 210$ mm super-Gaussian rectangular beam size of HAPLS (1/1000 of the maximum intensity points), this leaves plenty of margin for mounting, alignment and potential increased coating stress issues. Power and astigmatism of the RWE may be compensated by an adequate alignment of the focusing parabola in the target chamber. From the measured surface deformations we calculated with the Zygo AMETEK MetroPro software the RWE at use angle and subtracted power and astigmatism. The first eight turn mirrors were all below 69 nm PV and 9.4 nm RMS for the central $230 \text{ mm} \times 230$ mm aperture. Figure 14 shows the best RWE at AOI $=45{}^{\circ}$: 54 nm PV and 9 nm RMS. This exceptional wavefront quality is fully preserved when the mirrors are installed into the spng 3-point clamp glass-to-metal interface of the mount, without lowering the eigenfrequency of the mounted mirror. The wavefront is very insensitive to the clamping force.
Measured RWE at AOI  $=45{}^{\circ}$. Left: After subtracting piston, tilt, power and astigmatism. Right: After subtracting piston and tilt only.

The modelled gravity sag of the periscope mounts ( $\le 55$ nm PV, i.e., 0.068 waves @ 810 nm) with a carefully optimized clamp position for minimum deformation was also validated interferometrically for a top periscope mirror. This measurement was performed by sending the interferometer beam down onto a retro-reflecting precision reference flat, lying on 3-point rear support on the optical table of the interferometer. The FEA model predicts that the PV of the gravity sag changes by 1 nm per mm offset from the optimum clamp position.
Despite the high-quality reflected wavefront, we took the effort to orient all five mirrors of the E3 BT for an optimum wavefront error cancellation when power and astigmatism are subtracted (parabola alignment). The result of this optimization is shown in Figure 15. The PV error is 97.6 nm and the RMS value amounts 15.8 nm yielding a Strehl ratio (SR) of 99%. MetroPro calculates the SR from the point spread function (PSF) according to Goodman[Reference Goodman22]. Adding the RWEs of the  $45{}^{\circ}$ and the $30{}^{\circ}$ mirrors inside of P3 yields a PV of 109.8 nm, 18.06 nm RMS and an SR of 98.8%. There is no difference between subtracting the power and astigmatism for all individual RWEs and then summing up the wavefronts compared with adding first all wavefronts and then removing the power and astigmatism of the resulting RWE.
Summation of all five RWEs of the E3 BT mirrors guiding HAPLS to P3, after optimization of the orientation to cancel wavefront deformations and subtracting power and astigmatism. The SR is 99%.

Given these data, the only optic of the BT up to the P3 target, which affects the focus quality of HAPLS is the target parabola. For the commissioning parabola, a decent cost protected gold-coated  $f=750$ mm, $30{}^{\circ}$ off-axis parabola was chosen, which was measured to have an SR of 96% for the central $230 \text{ mm} \times 230$ mm aperture after subtracting power and astigmatism (Figure 16).
Measured surface of the  $f=750$ mm 30° off-axis protected gold commissioning parabola, yielding an SR of 96% for the central $230 \text{ mm} \times 230$ mm aperture.

Two high-quality dielectric-coated parabolas with an SR of 99% are currently being manufactured.
In addition to the wavefront quality of the transport mirrors, their laser damage threshold (LDT) is critically important. HAPLS will have full energy 30 J in 30 fs at the exit of the pulse compressor with a nominal fluence for an ideal 20th-order super-Gaussian beam of 67 mJ/cm2. Phase errors within the laser and the compressor lead to phase-to-amplitude modulations. These intensity modulations grow, whereas the laser freely propagates to P3 (see Section 8). To keep the risk of catastrophic damage by intensity spikes of the HAPLS beam as low as possible, we chose the coating with the highest LDT that we could find on the market and from a vendor who coated similar mirrors for other high-repetition-rate Ti:Sa PW systems. Figure 17 shows the LDT of a 2 inch diameter coating witness sample evaluated in Garching with the ATLAS laser under  ${10}^{-7}$ mbar vacuum. ATLAS was used with an approximately $300\ \unicode{x3bc} \mathrm{m}$ diameter spot on the sample, was run at 5 Hz repetition rate and $\left(25\pm 10\right)$ fs pulse length, and had p-polarization with respect to the sample, which was raster scanned (1 mm). Any visible and irreversible modification of the irradiated surface under $10\times$ bright field microscope inspection was considered to be a damage. The damage diagnostics was integrated into the vacuum test chamber for online monitoring. The 0.8 J/cm2 value in Figure 17 is in good agreement with in-house LDT measurements performed at the PALS laser facility[Reference Velpula, Kramer and Rus23], conducted at 803 nm, 47 fs, 10 Hz at $6\times {10}^{-6}\kern0.1em \mathrm{mbar}$ with a p-polarized 385 mm × 146 mm beam. Based on experience optics vendors tend to specify lower LDT values for full-size PW laser beams than for few 100 μm diameter test beams, but so far we have no opportunity to measure with the full-size HAPLS beam.
LDT measurement of 2 inch diameter turn mirror coating witness sample with an approximately  $300\ \unicode{x3bc} \mathrm{m}$ diameter beam spot of the ATLAS laser on the sample: 5 Hz repetition rate, $\left(25\pm 10\right)$ fs pulse length, p-polarization with respect to the sample, 1 mm raster scan (LEX Photonics, LMU Munich).

6 Cleaning and clean installation
6.1 Cleanliness levels
Cleanliness of the BT vacuum system that houses the multimillion-Euro coated optics, is important for ELI Beamlines because particulate and, most importantly, chemical cleanliness levels affect the LDT and consequently the lifetime of the coatings[Reference Pryatel, Gourdin, Frieders, Ruble and Monticelli24, Reference Sommer, Stowers and Van Doren25]. This damage risk is minimized by a strict cleanroom ISO 5 assembly protocol. In addition, chemical surface contamination as well as the outgassing of all vacuum components is determined prior to their installation. Organic thin-film contamination is of particular concern if the contaminated surface is close to the coated optics, specifically the compressor gratings. Particulate cleanliness levels are defined according to the IEST-STD-CC-1246D norm (equivalent to MIL-STD-1246C). Level 50 is requested for optics and level 100 as best effort for all vacuum components. This level is lowered during the final installation to level 130. Chemical cleanliness is ensured by requiring less than  $100\kern0.1em \mathrm{ng}/{\mathrm{cm}}^2$ non-volatile residues (NVRs) on vacuum surfaces. Furthermore, residual gas analysis (RGA) criteria were derived from the LIGO experiment and are based on taking the 44 (CO2) AMU peak as a reference for heavier peaks ( $<1\%$ of peak 44) and for the 43 AMU peak to be $<10\%$ of peak 44. These criteria ensure that potential contamination of optical elements by hydrocarbons (HCs) will stay at acceptable levels. HC contamination is known for lowering the LDT and to ‘blacken’ mirrors and gold gratings owing to carbonization of the HC contamination layers by the high laser beam fluence.
6.2 Laser cleaning
The P3 chamber was gross cleaned by manual wiping upon delivery and installation, and then pumped down. Figure 18 shows an RGA spectrum after the first pumping cycles. It has several peaks above the LIGO criterion (spectrum denoted as ‘before laser cleaning’ in Figure 18). To reach the required chemical cleanliness levels, we cleaned all dry vacuum surfaces by rastering them with a high average power pulsed fibre laser system. This cleaning method relies on several phenomena. Most importantly, it is the rapid thermal expansion of contaminants (or the surface they are attached to) owing to the absorption of laser light. Heat transfer from incoming laser pulses causes internal mechanical stresses of contaminants resulting in shock waves that help to remove the adhered materials. The main forces responsible for the contamination adhesion are van der Waals forces, capillary forces and electrostatic interactions. The cleaning efficiency is linked to the laser parameters, mainly to the wavelength, fluence and repetition rate. The removal efficiency also depends on the physical properties of the contaminants and the surface. Cleaning can occur when forces induced by laser irradiation overcome the adhesion forces of the particles to the surface. In wet laser cleaning (in the presence of a thin liquid layer), the cleaning action is enhanced by rapid expansion and evaporation of the liquid around the contaminants. With high fluence laser pulses, the cleaning action can be enhanced by the plasma ablation of contaminants and the adhered layer’s emitted shrapnel. High-repetition-rate pulses turn it into a plasma and follow with decomposition to the volatile phase when gases and fumes are extracted to avoid re-deposition.
Comparison of P3 RGA measurements before and after P3 laser cleaning. The levels of contaminants were decreased by two to three orders of magnitude.

The laser cleaning can be partially used for the cleaning of particulates and fibres[Reference Imen, Lee and Allen26–Reference Zheng, Lukyanchuk, Lu, Song and Mai30]. Cleaning efficiency is limited by absorption rates, especially for contaminants such as plastic fibres, and is relatively low. The requested particulate cleanliness levels could not have been achieved with the laser cleaning alone and required high-pressure spray wash and swiping to remove the particulates.
The laser parameters are summarized in Table 1. The P3 laser cleaning process is illustrated in Figure 19. After 4 days, the entire interior of the P3 vessel was cleaned, and an RGA spectrum was measured again; see Figure 18. The partial pressures of heavy molecules were improved by two to three orders of magnitude, reaching the required cleanliness levels with a decent margin.
Summary of the laser parameters of the precision cleaning device used to clean the P3 chamber. It is based on a 1064.7 nm fibre laser with a flat-top profile

Cleaning of the P3 chamber floor shows a clear visual difference between the cleaned surface area and the non-cleaned area[31].

6.3 Cleanliness validation
The cleanliness levels were validated with established procedures. We performed for the large size vacuum components (e.g., chambers, pipes, breadboards) liquid surface rinsing and for small area components swipe tests. The particulate contamination was determined with an automated particle counting microscope HFD4 from Jomesa with which we counted for level 100 all particles larger than 5 μm on a filter membrane, through which we poured a one litre representative particle rinse sample. The NVR was measured using evaporation and precision weighting with 1 μg accuracy. The NVR of individual components was precisely measured by swiping a defined area with a qualified ultra-clean wipe, soaked in a high strength (similar to chloroform) solvent followed by Fourier-transform infrared spectroscopy (FTIR) of the solvent. The wipes were prepared and analysed by Fraunhofer IPA, Stuttgart, with a detection limit better than a few nanograms per millilitre of solvent.
In addition, RGA was performed with a quadrupole mass spectrometer for a few subsystems as a cross-check of the NVR, and finally for each installed BT section and also for the entire system. Figure 20 shows a typical RGA spectrum with the partial pressures of all masses up to 200 AMU at a total pressure of  ${10}^{-6}$ mbar.
Measured RGA spectrum of a BT vacuum vessel with the partial pressures of all masses up to 200 AMU at a total pressure of 10−6 mbar.

6.4 Assembly and installation
To meet our tight schedule, the entire HAPLS BT vacuum system and the mirror mounts were tendered cleaned to the above particle- and NVR-level requirements. Because the system is extremely difficult to clean once fully installed, utmost care was taken to minimize contamination during the ISO 5 subsystem assembly and the final installation and commissioning. We ensured that the cleanliness level of the delivered components was validated in our cleanroom ISO 5 facility whenever possible (see Figure 21).
Assembly of HAPLS BT vacuum vessels and optomechanics in cleanroom class ISO 5.

Careful selection of gloves and wipes as well as of all other laboratory equipment, such as mops and tools was performed in a very early stage of the BT project and turned out to be crucial. All products that were causing contamination due to leaving particulates, fibres or other residues were discarded. The cleanliness levels were continuously monitored with particle counters and visual inspection with high intensity LED and UV lamps. All experimental halls are ISO 7 cleanrooms. While this cleanroom class is sufficient for the installation of BT support structures as well as sealed vacuum components, it is not adequate for connecting vacuum subsystems or accessing optics in the vacuum chambers. To be able to access mirror chambers loaded with optics, local clean tents with a few flow boxes on top were constructed and built inside the E3 experimental hall to enable clean connection of vacuum subsystems (Figure 22). This, along with establishing early on stringent ISO 5 laboratory practices and getting advice from other laser facilities, as well as training dedicated personnel, enabled a smooth clean installation with very minimal cleanliness level degradation from the installation process itself. Close attention was also paid to maintain the high cleanliness levels when connecting to the central vacuum and to the venting system. This included a series of filters for venting. We kept also the system sealed and under vacuum and with pumps running whenever possible.
Clean installation in experimental hall E3. Local cleanroom tents were constructed and built to allow clean access to the mirror chambers and to connect them via bellows to the adjacent DN500 pipes.

As shown in Figure 23, P3 is at present operated in an ISO 5 environment.
Working inside P3. The interior of the P3 experimental chamber is treated as a cleanliness class ISO 5 cleanroom, whereas the experimental hall E3 is an ISO 7 cleanroom.

7 The alignment system
There are two complementary ways to align the optics from the injector up to the target inside the P3 chamber: with blue pilot lasers (see Figure 24–26), and with the sub-aperture alignment mode of the HAPLS.
The blue alignment laser setup in E3.

3D CAD picture of the injection of the 417.5 nm blue alignment laser beam into the HAPLS BT system at the lower injector periscope in chamber E3-CH010.

Top: Last BT mirror in chamber E3-CH050 in front of P3 with the alignment module (left) and the second 417.5 nm ‘iBeam smart’ being injected straight to P3. Bottom: Camera image with measured iBeam smart leak beam and shadow of the mirror mount’s rear surface alignment cross (left) and mirror chamber with alignment module (black) installed at the exit of the flange to monitor the pilot laser leak beam position with respect to the alignment cross (right).

7.1 Blue alignment laser beam
A single-mode diode laser emitting at 417.5 nm (iBeam smart from Toptica) is used as a pilot laser for the alignment of the HAPLS to P3 BT system after magnifying the beam to 1 inch diameter. The blue alignment laser is mounted with its beam expander onto a breadboard that is monolithically connected to the wall behind the injector chamber E3-CH010. The setup together with the injection of the pilot beam into the HAPLS BT system is shown in Figure 25. Two 2 inch diameter motorized mirrors are used to make the blue alignment laser collinear with the nominal optical axis of the HAPLS BT system, which is defined by laser-tracker precision-positioned targets.
As depicted in Figure 26, each mirror mount has a rear surface alignment cross, which is centred at the nominal position on the optical axis of the leak beam of the pilot laser, transmitted and refracted by the 75 mm thick  $90{}^{\circ}$ turn mirror.
When the pilot laser leak beam is centred with respect to the alignment cross, the mirror front surface reflection is centred on the nominal optical axis of the HAPLS BT system. The 0.5 mm accuracy of the position of the alignment cross is guaranteed by the laser tracker-based installation of the mirror mount onto the breadboard of the mirror chamber and the subsequent laser tracker-based installation of the entire chamber assembly onto its support. The leak beam with the centred shadow of the alignment cross (Figure 26) is demagnified and relay imaged onto a camera in the alignment module as shown in Figure 27.
Schematics of the alignment module in which the leak beam is demagnified and relay imaged together with the shadow of the alignment cross onto a camera.

Figure 28 shows how the front and rear surfaces of the injector bottom periscope mirror in chamber E3-CH010 reflect and transmit the alignment beam. The coated front surface of the injector bottom periscope mirror reflects the blue beam via a special design alignment cross (Figure 25) downwards and through a 100 mm diameter viewport window onto a breadboard located on the E3 floor. On this breadboard the near field (NF) of the beam is measured with respect to the alignment cross and also its nominal position inscribed into the breadboard as shown in the lower right of Figure 28. The nominal position on the E3 floor is determined with a laser tracker and allows setting the tip/tilt of the injector mirror after centring the blue alignment laser beam with the help of the second 2 inch diameter blue injection mirror on the alignment cross of the mirror mount located in the E3 translation switchyard chamber (see Figures 13 and 24).
Front (coated) and rear surface reflections of injector bottom periscope mirror for measuring the position of the blue beam with respect to the alignment cross and the nominal position inscribed into the breadboard on the E3 floor to also adjust the tip/tilt angle of this mirror. See also Figure 25.

After centring all blue leak beams with respect to their alignment crosses in all turn mirror chambers, the HAPLS BT system is aligned to its nominal optical axis up to P3. The transmission losses of the blue laser at each BT mirror are between 40% and 70%, depending on the polarization (orientation of the mirror) and the coating run. Although the beam is still visible behind the P3 focusing parabola, it was too weak for an accurate visual alignment of the AOI  $=45{}^{\circ}$ and AOI $=30{}^{\circ}$ turn mirrors, which steer the beam onto a $30{}^{\circ}$ off-axis focusing parabola (OAP) having a focal length of $f=750 \text{ mm}$ (see Figure 29). As a consequence a second blue alignment laser was installed at the last BT turn mirror chamber E3-CH055 for the alignment of the optics in P3. To make the second pilot beam collinear to the nominal optical axis towards P3, its reflection on the coated surface of the turn mirror through which it is injected needs to be centered on its alignment cross together with the first blue beam. Subsequently the second blue beam needs to be centered on the alignment cross of the first turn mirror in P3 (see Figures 26 and 29). All optical components in P3 are positioned with an accuracy of 200 μm and pre-aligned with a laser tracker.
Arrival of the full-size HAPLS beam in P3, the TM-45, the TM-17.5 turn mirror both with their rear surface alignment cross and the  $30{}^{\circ}$ off-axis gold coated parabola with a focal length of $f=750\kern0.1em \mathrm{mm}$. All components are pre-aligned with a laser tracker position and angle wise.

7.2 HAPLS laser alignment mode
After the completion of the alignment with the blue alignment laser beam, a 1 inch sub-aperture HAPLS beam is centrally cut out of the full-size HAPLS beam and is injected into the fully aligned BT system. Once the NF of the sub-aperture HAPLS alignment beam is centred at the alignment cross of the injector mirror similarly to the blue pilot beam and once the far field (FF) of HAPLS and the blue beam overlap in the target diagnostics, HAPLS is collinearly aligned to the nominal optical axis of the BT system and the operation of HAPLS at full aperture and energy may be started. The blue alignment laser beam allows to monitor potential misalignments and drifts of the BT system while HAPLS is in operation at any energy level by using a cheap IR blocking colour glass in front of the camera of the alignment module, which transmits the 417.5 nm pilot beam. In addition to avoiding filter wheels to attenuate HAPLS depending on its pulse energy (100 μJ to 30 J) one major advantage of the blue pilot beam alignment system is the fact that it may be automated easily and that the beam may be actively locked to the building with an additional pointing and centring diagnostics at the injector. It is important to note that the weak HAPLS sub-aperture alignment beam may not be detected behind a mirror for s-polarization due to the low transmission ( $1.6\times {10}^{-5}$ in dry atmosphere). This low transmission is required for achieving the ultra-high LDT.
8 Laser beam propagation
8.1 Phase-to-amplitude modulations of 20th-order super-Gaussian HAPLS beam with measured phase errors
Fusion type lasers such as the Nova laser and the National Ignition Facility (NIF) at Lawrence Livermore National Laboratory use imaging relay telescopes with spatial filtering for keeping intensity modulations as low as possible and for preventing optical damage owing to intensity spikes along the beam path[Reference Hunt, Glaze, Simmons and Renard32, Reference Hunt33]. These modulations originate from the Fresnel propagation of the phase errors of non-ideal optics, which are accumulated by the laser beam during its amplification and during the propagation through the BT system up to the target.
For the few nanosecond and narrow bandwidth pulses of fusion laser, the imaging relay telescopes may consist of two lenses. For 80 nm bandwidth, 30 J, 30 fs HAPLS pulses, the relay telescopes need to employ off-axis parabolas or other complex reflective freeform optics. These expensive optics need in addition to tip/tilt also rotation and longitudinal translation to collimate the beam and to avoid aberrations. The additional degrees of freedom result in larger pointing instabilities and significantly higher complexity for achieving optimum alignment. An additional complication arises from the locations of the switchyards (see Figure 13) and their large stay-out zones for any short pulse focus. Furthermore, even high-quality off-axis parabolas and freeform optics have relatively high mid spatial frequency (MSF) and high spatial frequency (HSF) phase errors due to the required small size sub-aperture polishing tools[Reference Pandey, Kumar, Pant and Ghosh34]. Owing to the switchyards, the HAPLS BT system would require for each experimental hall three reflective relay telescopes to fully image the beam up to the target focusing parabola. To assess whether the 10 times higher LDT shown in Figure 17 is a sufficiently high margin to avoid catastrophic damage of the BT and focusing optics when building a non-relay imaged BT system, we have developed in close cooperation with LightTrans International in Jena, Germany, a VirtualLab Fusion[Reference Wyrowski35, Reference Wang, Zhang, Baladron-Zorita, Hellmann and Wyrowski36] model to calculate the full-bandwidth diffraction propagation of HAPLS to each experimental hall. Because a solid understanding and potential control of the phase-to-amplitude modulations is of vital importance for a below optical damage threshold operation of the BT system, we have benchmarked this code against the physical optics propagation of Zemax OpticStudio and against an in-house developed Efficient Matrix Approach (EMA)-based code, as described by Shakir et al.[Reference Shakir, Fried, Pease, Brennan and Dolash37]. While VirtualLab Fusion may model the full-bandwidth diffraction propagation and has the capability to also include spatiotemporal coupling, Zemax and our in-house code may currently only propagate a monochromatic beam. Prior to designing and building the HAPLS BT system, without a relay imaging system, but the capability to retrofit one if need be, we propagated a phase map taken from another laser facility’s compressor grating interferograms, which we had scaled to an expected worst-case scenario. Figure 30 shows how well all three codes agree for the monochromatic case at 810 nm when an ideal flat intensity 20th-order super-Gaussian beam is propagated over 56.3 m to P3 with the first and preliminary phase error measurements of HAPLS.
Calculated phase-to-amplitude modulations for the free space propagation of a 20th-order super-Gaussian beam, which has at 30 J a fluence of  $67\kern0.22em \mathrm{mJ}/{\mathrm{cm}}^2$ (first row and second row left) with first and preliminary measured phase errors (second row right) over 53.6 m to P3. The VirtualLab Fusion, Zemax and in-house EMA-based code are in full agreement (third row). The peak intensity of these $x$- and $y$-lineouts is $86\kern0.22em \mathrm{mJ}/{\mathrm{cm}}^2$ and the modulation depth is up to 28% with respect to the ideal super-Gaussian beam. Fourth row: Calculated 2D beam profile after 53.6 m of propagation, left with VirtualLab Fusion and right with Zemax. Fifth row: Same as the fourth row, but calculated with EMA-based code. The peak fluence of the propagated ideal super-Gaussian 2D beam is $91\kern0.22em \mathrm{mJ}/{\mathrm{cm}}^2$.

Figure 31 shows the horizontal  $x$-cut of the ideal HAPLS beam profile for different propagation distances up to 100 m. The model predicts for the measured phase errors no significant increase in the peak intensity for these propagation distances.
X-lineout of EMA model prediction for the phase-to-amplitude modulations of an ideal flat fluence 20th-order super-Gaussian beam with the measured phase errors of the HAPLS beam for different propagation distances.

The depth of the intensity modulations and their increase over the propagation distance depend critically on the MSF and HSF content of the phase errors as we have shown previously[Reference Weber, Bechet, Borneis, Brabec, Bucka, Chacon-Golcher, Ciappina, DeMarco, Fajstavr, Falk, Garcia, Grosz, Gu, Hernandez, Holec, Janecka, Jantac, Jirka, Kadlecova, Khikhlukha, Klimo, Korn, Kramer, Kumar, Lastovicka, Lutoslawski, Morejon, Olsovcova, Rajdl, Renner, Rus, Singh, Smid, Sokol, Versaci, Vrana, Vranic, Vyskocil, Wolf, Yu and Radiat12]. According to Goodman[Reference Goodman22] the E-field  $E\left(x,y\right)$ in the $xy$ plane at the propagation distance $z$ may be calculated in Fresnel approximation by either calculating the convolution of the electric field $E\left(\xi, \eta \right)$ at $z=0$, and the free space transfer function (propagator)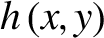 $h\left(x,y\right)$ or by multiplication of the Fourier transforms $E\left({f}_x,{f}_y\right)= \textrm{FFT}\left[E\left(x,y\right)\right]$ and $H\left({f}_x,{f}_y\right)= \textrm{FFT}\left[h\left(x,y\right)\right]$ followed by the inverse FFT operation:
 $${\displaystyle \begin{array}{l}\kern1.48em E\left(x,y\right)=\int\limits_{-\infty}^{\infty} \int\limits_{-\infty}^{\infty}E\left(\xi, \eta \right)h\left(x-\xi, y-\eta \right) \textrm{d}\xi \textrm{d}\eta, \\ {}\kern1.48em h\left(x,y\right)=\frac{e^{j k z}}{j\lambda z}\exp \left[\frac{j k}{2z}\left({x}^2+{y}^2\right)\right],\\[6pt] {}\kern1.24em E\left(x,y\right)=\frac{e^{j k z}}{j\lambda z}{e}^{\frac{j k}{2z}\left({x}^2+{y}^2\right)}\int\limits_{-\infty}^{\infty} \int\limits_{-\infty}^{\infty}\left[E\left(\xi, \eta \right){e}^{j\frac{k}{2z}\left({\xi}^2+{\eta}^2\right)}\right]\\ \quad{}\kern3.72em \times {e}^{-j\frac{2\pi }{\lambda z}\left( x\xi + y\eta \right)} \textrm{d}\xi \textrm{d}\eta, \\ {}H\left({f}_x,{f}_y\right)=\mathrm{\mathcal{F}}\left\{\frac{e^{j k z}}{j\lambda z}\exp \left[j\frac{\pi }{\lambda z}\left({x}^2+{y}^2\right)\right]\right\}\\ {}\kern3.48em ={e}^{j k z}\exp \left[- j\pi \lambda z\left({f}_x^2+{f}_y^2\right)\right],\end{array}}$$
 with  $E\left(x,y\right)$ being the electric field in the xy plane after propagation of the distance z from the aperture/phase object in the $\xi \eta$ plane at $z=0$; $k=2\pi /\lambda$ is the angular wavenumber, and $\lambda$ is the wavelength of the monochromatic electric field $E$.
$E$.
In general, there is no analytic solution and these operations need to be performed numerically, but the quadratic phase term of  $H\left({f}_x,{f}_y\right)$ shows that HSFs generate high-amplitude modulations.
The highest peak fluence of the HAPLS alignment beam measured in P3 amounts to  $200\kern0.22em \mathrm{mJ}/{\mathrm{cm}}^2$, which is a factor of 2.2 higher than the $91\kern0.22em \mathrm{mJ}/{\mathrm{cm}}^2$ calculated for the ideal super-Gaussian beam having the measured phase errors. From this measurement compared with the model predictions and based on the experience at other laser facilities, we infer that the 2 mm spatial sampling for the preliminary phase measurements is too low. Higher-resolution phase measurements will be performed in the near future. In addition, we will also input the measured beam profile of HAPLS into our propagation code once we have completed the energy ramp-up of HAPLS. The measured beam profile of the low-power full-size HAPLS alignment beam in P3 is shown with a central x and y lineout in Figure 32. Given the fact that the grating compressor generates most of the MSF errors that lead to intensity spikes during the beam propagation, this measurement suggests that an LDT of $0.8\kern0.22em \mathrm{J}/{\mathrm{cm}}^2$ is a sufficiently high margin for the BT mirrors.
HAPLS low-power alignment beam measured in P3 after 53.6 m of propagation. When scaled to 30 J operation, the peak fluence of the 2D beam is 200 mJ/cm2.

8.2 Simplified model of phase-to-amplitude modulations
To gain more insight into the scaling of the intensity modulations with the amplitudes of the phase errors and their spatial periods, the effect has been studied with a simplified model of a monomode sinusoidal phase modulation of depth  $\alpha$. This model implies a linear propagation and neglects possible interference of different spatial harmonics. However, it allows the estimation of the relevant importance of different spatial modulation wavelengths and the corresponding amplitude of intensity modulations at different distances along the laser beam propagation direction.
The laser beam at the laser exit is assumed to have a Gaussian intensity distribution of radius  $a=120$ mm with a sinusoidal phase modulation of a depth $\alpha$:
 $$\begin{align}E(y)={E}_o\exp \left(-\frac{y^2}{2{a}^2}+ j\alpha \sin {k}_{\perp }y\right),\end{align}$$
 where the phase modulation is characterized by a wavelength  $\lambda =2\pi /{k}_{\perp }$. The structure of the electric field at a distance $z$ from the plane of incidence is calculated analytically by expanding the sinusoidal modulation in a series of Bessel functions and propagating each component along the $z$-axis in the paraxial approximation. The field at a distance $z$ reads
 $${\displaystyle \begin{array}{l}E\left(y,z\right)\kern1em =\kern1em \frac{E_o}{\sqrt{1- jz/{z}_R}}\exp \left(-\frac{y^2/2{a}^2}{1- jz/{z}_R}\right) \\ {}\kern4.48em \times\sum \limits_{n=-\infty}^{\infty }{J}_n\left(\alpha \right)\exp \left(-{jnk}_{\perp}\frac{y+{nk}_{\perp }z/2{k}_{\mathrm{las}}}{1- jz/{z}_R}\right),\end{array}}$$
 where  ${z}_R=\frac{1}{2}{k}_{\mathrm{laser}}{a}^2$ is the Rayleigh length of the whole beam and ${k}_{\mathrm{laser}}=2\pi /{\lambda}_{\mathrm{laser}}$ is the laser wave number. For the laser wavelength ${\lambda}_{\mathrm{laser}}=0.81\kern0.22em \mu$m, this length of approximately $56$ km is much larger than the lengths of interest, $z=10{-\!}100$ m. Thus, amplitude modulations appear owing to the interference of harmonics of the phase modulation. The characteristic distance where such modulations appear, ${z}_{\lambda }={\lambda}^2/2{\lambda}_{\mathrm{laser}}$, is defined by the coordinate-dependent term in the exponential in Equation (3), ${k}_{\perp}^2z/2{k}_{\mathrm{laser}}\sim 1$. This characteristic distance is ${z}_{\lambda}\simeq 39.3$ m for the modulation wavelength of $\lambda =5.6$ mm and follows directly from Equation (3) for small $\alpha$:
 $$\begin{align}{z}_{\lambda }={\lambda}^2/2{\lambda}_{\mathrm{laser}}={\left(5.6\ \mathrm{ mm}\right)}^2/0.8\kern0.22em \mu \mathrm{m}=39.2\kern0.22em \mathrm{m}.\end{align}$$
 Consequently, the propagation length of interest is comparable to the effective Rayleigh length,  $\pi /\lambda {a}^2$, for the modulations having wavelengths $\lambda$ in the range from a few millimetres to a few tens of millimetres.
This analysis defines the domain of parameters to consider. Figure 33 shows the dependence of the relative amplitude modulations on the propagation distance for modulations with wavelength  $\lambda =5$, 15 and 30 mm for three values of the modulation depth: $\alpha =0.3$, 0.6 and 1.0.
Depth of amplitude modulation,  $\Delta =\left({E}_{\mathrm{max}}^2-{E}_{\mathrm{min}}^2\right)/2{E}_o^2$, as a function of propagation distance $l$ from the incidence plane for different modulation amplitudes: (a) $\lambda =5$ mm, (b) λ = 15 mm and (c) λ = 30 mm for modulation depths $\alpha =0.3$, 0.6 and 1.0.

The depth of the amplitude modulations is defined as the ratio of the difference of the maximum and the minimum laser intensity near the beam centre to the average intensity,  $\Delta =\left({E}_{\mathrm{max}}^2-{E}_{\mathrm{min}}^2\right)/2{E}_o^2$. For large wavelength, $\lambda =30$ mm (Figure 33(c)), where the Rayleigh distance, ${z}_{30}\simeq 360$ m, is much larger than the distance considered, the modulation amplitude increases linearly with distance until the saturation. The saturation amplitude increases with the modulation depth and with decrease in the modulation wavelength.
By contrast, for small-scale modulations  ${\lambda}_s=5$ mm, shown in Figure 33(a), the corresponding Rayleigh length, ${z}_5\simeq 10$ m is shorter than the considered distances. Consequently, the amplitude of intensity modulations remains at a constant level with small variation owing to the interference. The level of saturation depends on the modulation depth; for $\alpha \gtrsim 1$ intensity modulations are very strong, about 100%.
In order to be on a safe side, the small-wavelength modulations with  $\lambda <15$ mm must be suppressed and the amplitude of phase modulations should be kept below $\alpha \sim 0.5$. Phase modulations with a depth $\alpha >1$ are very dangerous because they generate narrow spikes with intensities which could be several times the average intensity.
8.3 Pointing stability on target
A comprehensive analysis of the laser beam pointing contributions from all subsystems is a complicated task. In this section, if not mentioned otherwise, the radial RMS pointing is presented.
The subsystems of the HAPLS BT to target can be, generally, divided into systems located on the laser floor in the L3 hall, and systems located on the experimental floor in the E3 hall.
• HAPLS L3 hall
– HAPLS amplified beam before the compressor. This subsystem includes front-end, alpha and beta amplifiers, and the beam expander.
– Compressed beam after the compressor. The beam diagnostics is located behind the last leak mirror.
– The beam pointing after leaving the L3 hall. This pointing includes all the above contributions from HAPLS plus the last leak mirror of the compressor and the upper periscope mirror of the HAPLS injector on the laser floor. It cannot be measured in the L3 hall, and additional beam diagnostics would be required in E3 to enable its measurement.
• E3 hall
– HAPLS BT system. This subsystem includes three periscope mirror chambers and two turning mirror chambers and is designed with very stringent guidelines to achieve an RMS pointing stability of less than
$1\kern0.22em \mu \mathrm{rad}$ as described in Sections 2–4.– P3 target chamber. The commissioning experiment consisted of two mirrors and one
$30{}^{\circ}$ OAP with a segment focal length of 0.75 m.


The HAPLS alignment beam as well as the two blue alignment lasers, located in the E3 hall, was used to measure the on-target pointing. An advantage of the blue alignment lasers is their capability to measure the pointing stability contribution of the P3 setup alone (second blue laser) and the contributions of all BT subsystems in the E3 hall behind the injector (first blue laser).
The focal spot plane was imaged with an infinity corrected 20× magnification microscope objective and an  $f=200\ \mathrm{mm}$ tube lens onto an Allied Vision Manta G-319B camera. The pixel size is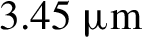 $3.45\ \mu \mathrm{m}$, which corresponds to a resolution of $0.172\ \mu \mathrm{m}/\mathrm{pixel}$ in the focal plane. This resolution was validated with a needle mounted onto a calibrated translation stage. Figure 34 shows examples of the imaged focal spot recorded with this setup. For each image, the centroid of the focal spot was calculated and used in the subsequent evaluation of the standard deviation of the centroid positions. The pointing angle was calculated by dividing by the focal length of the OAP.
Top: Schematic for monitoring the beam pointing stability in the P3 target chamber. Bottom: Focal spots images of full-aperture HAPLS beam (left) and 80 mm circular HAPLS sub-aperture (middle). The effect of switching off the P3 vacuum pumps is demonstrated with the blue alignment laser (right); see Section 8.4 for details. The images are overlayed with reconstructed centroid positions in each sample (black crosses) and with intensity projections (white curves).

The results are summarized in Table 2. The error of the pointing stability was estimated as the standard error of the sample standard deviation using the following equation:
 $$\begin{align}\textrm{SD}(s)=s\frac{\Gamma \left(\frac{n-1}{2}\right)}{\Gamma \left(n/2\right)}\sqrt{\frac{n-1}{2}-{\left[\frac{\Gamma \left(n/2\right)}{\Gamma \left(\frac{n-1}{2}\right)}\right]}^2},\end{align}$$
A summary of low-power laser pointing measurements in the P3 chamber compared with HAPLS pointing, measured in the L3 hall before the compressor. The number of focal spot positions measured to determine the pointing stability was 100 except for the blue laser 1 where we took 200 images. The camera was synchronized with HAPLS, i.e., had an acquisition rate of 3.3 Hz.

where  $s$ is the sample standard deviation and $n$ is the size of the sample.
8.4 Influence of P3 vacuum pumps on pointing stability
The blue alignment laser 2, which is mounted on the BT chamber CH055, as shown in Figure 26 (top), is used to measure the pointing contribution due to the P3 chamber alone. This laser’s beam pointing at the parabola is, to the first order, not affected by the BT[38] and, therefore, corresponds directly to the vibrations of the optical components in P3. Figures 29 and 36 show the two flat vertical mirrors, the OAP and the focal spot diagnostics in P3. All components are mounted on the optical table of P3.
There are four vacuum pumps installed on the P3 chamber: two turbo pumps Edwards STP3202 (3200 litres per second each) and two cryo-pumps Coolvac 1000BL (10,000 litres per second each).
It is expected that the cryo-pumps cause most of the chamber vibrations. When all pumps are in operation, the measured radial pointing with the blue laser 2 is approximately 1.5  $\mu \mathrm{rad}$, as indicated in Table 2. This measurement is dominated by the P3 commissioning parabola mount for which we have measured eigenfrequencies at 7.5, 30, 41 and 50 Hz. Hence, the real beam pointing before the parabola is most likely significantly lower. Switching the vacuum pumps off results in a very low pointing value of less than 0.3 $\mu \mathrm{rad}$. We plan to improve the vibration isolation of the pumps and may also switch off some of the pumps for 30–60 min for very demanding experiments. The design of a higher-stability OAP mount which is based on the BT mirror mount design is in preparation. The measurement of the pointing stability is schematically depicted in Figure 34 top. The plane of the focal spot is imaged onto a Manta G-319B camera. The displacement in the focal plane divided by the focal length of the parabola yields the angular beam pointing.
9 Beam diagnostic in the spatial domain
To characterize the NF intensity pattern and the focal spot image (FF pattern) of the HAPLS beam in the P3 target chamber, two image-monitoring systems (I and II), which are based on high-quality microscope objectives are implemented in the chamber as shown in Figure 35. The system I (top) collimates the laser beam after the focus to record the NF pattern and the wavefront of the laser beam. For this purpose, a 10× microscope objective lens (Mitutoyo, Infinity-corrected, NA = 0.26) is used to provide a large Fresnel number for the collimated beam. The Fresnel number ( ${F}_N$), defined as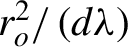 ${r}_o^2/\left( d\lambda \right)$, is a dimensionless parameter which describes the diffraction effect during the beam propagation. When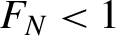 ${F}_N<1$ the beam propagation follows the FF diffraction theory and its field distribution is similar to that of the focal spot with a scaling factor. On the other hand, when ${F}_N>>1$, the beam is in the NF and its field distribution is close to the original input field distribution. In between, the beam propagation will follow the Fresnel diffraction theory and the field distribution is complicated due to the diffraction effect. For the system I, the Fresnel numbers are calculated to be ${F}_N=47$ for a 80-mm-diameter sub-aperture beam and ${F}_N=327$ for the $210\ \mathrm{mm} \times 210\ {\mathrm{mm}}$ full-aperture HAPLS beam, in the CCD camera plane located 3 cm away from the objective lens. Thus, the diffraction effect is negligible in the CCD camera plane and the beam profile experiences almost no diffraction, so the field distribution measured with the CCD camera is an inverse Fourier transform of the laser focus, which is the field distribution at the entrance pupil of the OAP (known as the NF pattern). The system II (bottom) measures the focal spot formed by the OAP. This system has a 20× objective lens (Mitutoyo, Infinity-corrected, NA = 0.4) that collimates the focused beam. The collimated beam after the objective lens enters into the tube lens ( $f=200\ \mathrm{mm}$). The tube lens focuses the beam onto another CCD camera with a spatial resolution of $3.45\ \mu \mathrm{m}$. The system II is designed to have a magnification factor of 20×. As mentioned in Section 8.3, the magnification of the system was calibrated with a needle and the actual magnification measured with the needle was 19.6×.
Photos of the image-monitoring system. The monitoring system 1 is for obtaining the NF intensity pattern and the wavefront of the HAPLS beam. The monitoring system 2 is for obtaining the focal spot image by the OAP.

The optical layout for the complete beam diagnostics in spatial and temporal domains inside and outside the chamber is displayed in Figure 36.
Diagnostic setup for the short focal length commissioning.

9.1 NF and FF patterns of the laser beam
Figure 37 shows the NF (shown in Figures 37(a) and 37(c)) patterns and focal spots (shown in Figures 37(b) and 37(d)) measured with the monitoring system. Despite the long propagation distance ( $>50$ m) through the BT system, no significant distortion in the beam shape was found because of the low wavefront error of the BT mirrors (see Figures 15 and 16). However, the laser beam profile contains a vertically periodic intensity modulation which is generated from one of the laser amplifiers. The Fourier analysis of the intensity modulation shows a peak at $0.18\ \mathrm{mm}^{-1}$ in the spatial frequency domain, which corresponds to 5.6 mm in the spatial period. The modulation depth defined as $\left({I}_{\mathrm{max}}-{I}_{\mathrm{min}}\right)/\left(2{I}_{\mathrm{average}}\right)$ is calculated to be about 40%. The modulation depth decreases as the laser beam is further amplified by the consecutive amplifiers owing to the onset of saturation. The measured spot sizes, defined by the full width at half-maximum (FWHM), for the 80 mm sub-aperture beam were $8.5\kern0.22em \mu \mathrm{m}$ in both directions. This is close to the minimum FWHM focal spot size, which we calculate with our code in two dimensions for an aberration-free 80 mm $1/{e}^2$ diameter 20th-order super-Gaussian beam to be $8\kern0.22em \mu \mathrm{m}$. The NF pattern for the full-aperture beam was measured at a laser energy of 51 mJ. The measured focal spot shows an elliptical shape which is caused by a not yet compensated astigmatism of the beam. A detailed shape of the focal spot can be derived from the measurement of the wavefront aberrations of the beam as described in the following.
NF and FF (focal spot) intensity patterns measured with the monitoring system: (a) NF pattern and (b) the focal spot image obtained with the 80 mm sub-aperture beam; (c) NF pattern and (d) the focal spot image with the full-aperture beam.

9.2 Wavefront analysis
The wavefront aberration of the laser beam was measured with a Shack–Hartmann (SH) wavefront sensor (Optocraft). The focal length of the microlens of the SH sensor is 2.539 mm, and the size of a microlens is  $110\kern0.22em \mu \mathrm{m}\times 110\kern0.22em \mu \mathrm{m}$. For the wavefront measurement, a CCD camera measuring the NF intensity pattern in the system I is replaced by the wavefront sensor. The software for the wavefront sensor performs a Zernike expansion up to 36th order in the Zygo order format from the taken spot array pattern. These Zernike coefficients are converted into the OSA standard format up to the fifth radial order. Then, the measured wavefront aberration, $W\left(x,y\right)$, was decomposed into the Zernike polynomials, ${Z}_n\left(x,y\right)$, as $W\left(x,y\right)={\sum}_0^{\infty }{c}_n{Z}_n\left(x,y\right)$, where ${c}_n$ is the Zernike coefficient representing the weighting of a specific Zernike mode.
9.2.1 80 mm diameter sub-aperture beam
First, we measured the aberrations of an 80 mm sub-aperture HAPLS beam, which will be used for the LUIS commissioning experiment. Figure 38 shows the measured wavefront of the 80 mm sub-aperture laser beam. Five spot images were taken and averaged. Figure 38(a) shows the Zernike coefficients for each Zernike mode up to the fifth radial order. The defocus ( $-0.593\pm 0.04\kern0.22em \mu \mathrm{m}$) was the largest Zernike mode in the beam. However, the defocus term only shifts the focal plane, so it does not affect the quality of the focal spot. Thus, the absolute Zernike coefficient for defocus is ignored in the graph. The second largest Zernike mode was the $0{}^{\circ}$ astigmatism ( $0.04\pm 0.011\kern0.22em \mu \mathrm{m}$). Figure 38(b) shows the reconstructed wavefront aberration map with the Zernike coefficients. The PV value is $0.32\ \unicode{x3bc} \mathrm{m}$ (or $0.40\lambda$ for $\lambda =0.81\kern0.22em \mu \mathrm{m}$). It should be mentioned that the wavefront aberration map reconstructed in the figure shows only a global change in the spatial phase profile owing to the low spatial resolution, which is only 7.2 mm and the Zernike polynomial is only expanded up to the fifth radial order. A 1–2 mm resolution wavefront measurement will be performed in the near future. Figure 38(c) shows the PSF based on the wavefront measurement. The peak value of the PSF represents the SR of the focal spot calculated with the higher-order wavefront only. Without defocus and astigmatism terms, the SR increases to 0.95 as shown in Figure 38(c), implying no serious wavefront deformations induced by the BT system. The SR containing astigmatism was $0.79\pm 0.03$ averaged over five measurements.
(a) Zernike coefficients for the 80 mm sub-aperture beam. The error bar for each Zernike mode is its standard deviation. The absolute value ( $0.593\kern0.22em \mu \mathrm{m}$) for the defocus term is not shown. (b) The wavefront map reconstructed from the Zernike coefficients (a). (c) PSF calculated from (b). (d) PSF calculated from (b) after subtracting defocus and astigmatism. HO denotes higher order than astigmatism modes.

9.2.2 Full-aperture HAPLS beam
Figure 39 shows only the central  $207\ \mathrm{mm}\times 150\ \mathrm{mm}$ wavefront map of HAPLS owing to the limited size of the SH wavefront sensor. The entire HAPLS beam will be demagnified and relay imaged onto the wavefront sensor after receiving the required optics. The Zernike decomposition cannot be used for the rectangular beam shape, since the Zernike polynomial is an orthonormal set of functions for circular apertures. The Legendre polynomials are commonly used for fitting the wavefront of rectangular apertures. The wavefront aberrations were not yet fully compensated for the full-aperture beam with the deformable mirror (DM) of HAPLS. However, to check the functionality of the DM, the wavefront was measured at two different DM configurations. Before the wavefront measurement, the focal spot in P3 was optimized by adjusting the OAP mount for highest peak intensity in the focus. In one configuration shown as DM configuration 1 in Figure 39, the PV value of the wavefront was about $2\kern0.22em \mu \mathrm{m}$. Changing to configuration 2 the PV value was improved from 2 to $1.3\kern0.22em \mu \mathrm{m}$ as shown in Figure 39. In this case, the focal spot image was also improved, but the shape and spot size were not yet close to a ‘diffraction-limited’ spot. The diameter of the focal spot of an ideal super-Gaussian rectangular HAPLS beam has an FWHM of $2.5\kern0.22em \mu \mathrm{m}$. The full aperture HAPLS beam will be characterized in the near future after ramping up the energy to the 15 J level. An additional DM will be tendered soon and will be located close to the target OAP to further improve the focal spot quality.
Wavefront maps for the  $207\ \mathrm{mm}\times 150\ {\mathrm{mm}}$ size laser beam in the target chamber.

10 The P3 infrastructure
10.1 P3 installation
The P3 target chamber has 4.5 m diameter and was manufactured by AWS in Spain from aluminium EN AW-5083 to minimize activation by ionizing radiation. It weighs 14 tons and is anchored directly to the 80 cm thick monolithic concrete floor of the E3 hall. The optical tables are not mechanically decoupled from the chamber, but directly bolted onto the chamber floor. This unusual design for laser-matter interaction experiments provides maximum usable space inside the chamber, as the chamber floor can be relatively thin, only 220 mm, without compromising the vibration stability of the optical breadboards. The high vibration stability is only achievable by using multiple anchoring points to the hall floor, which are precisely levelled via small Spinelli WSP2 Fixing Levelers between the chamber and the hall floor. A total of 25 anchors go from the inside of the chamber via levelling feet into the hall floor, and additional 20 anchor clamps fix the outside of the chamber bottom onto the floor. Figure 40 shows the anchoring of the chamber, where threaded rods are anchored 400 mm into the hall floor. As a result, the 80 cm thick reinforced concrete floor underneath the chamber can be considered as a part of the chamber structure resisting the vacuum forces and minimizing vibrations.
Top: The anchors used, going 400 mm deep into the concrete. Bottom: The distribution of the anchoring points and the individual levelling feet.

It is important to note that the massive 80 cm thick reinforced hall floor is pre-tensioned by the underground water pressure. The experimental hall is located 7 m below the groundwater level, which generates a significant water buoyancy load of 70 kN/m2 acting on the floor. Consequently, the floor is bent up and pre-tensioned.
Owing to the innovative anchoring of the chamber and the monolithic reinforced hall floor design, only minimal deformations occur on the chamber floor even when the enormous vacuum forces act on the chamber. Although the P3 chamber floor has a surface of 13.594 m2, which generates a vacuum force of  $1.36\;\mathrm{MN}$, the anchored chamber floor deforms no more than 100 μm according to our FEA simulations as shown in Figure 41. The P3 chamber affects the floor only locally, because the vacuum forces on the chamber floor are in equilibrium with the forces generated on the chamber cupola on the top. The cupola vacuum force is pushing downwards via the chamber walls onto the circumference of the floor and deflecting the edges down by more than 300 $\mu$m, as also shown in Figure 41. The target alignment at ambient pressure is preserved better than one focal spot diameter when P3 is pumped down.
FEM simulation results of P3 chamber floor deformation in z direction under vacuum force.

From the practical point of view, the chamber’s direct anchoring vastly simplified the construction and installation of the P3 chamber and allowed to design simple and modular breadboard structures, as described in the next section. With decoupling, it would have been very hard to provide as much space and modularity. Before the installation of the chamber, the anchors were installed and the levelling feet precision aligned to the nominal height with the laser tracker. The chamber was positioned with the help of the laser tracker and lowered onto its final position with sub-millimetre precision. The anchors were pre-tensioned to 65 kN to minimize load variation owing to cyclic vacuum loading. The resulting load variation on the anchors is less than 5 kN. The internal anchors can be accessed from inside through internal vacuum ports.
10.2 P3 breadboard structure
Figure 42 shows the unique breadboard structure in the P3 chamber. The individual elements can be arranged depending on the requirements of the specific experiment. The system consists of a central target table with two levels and two rings with ten wedges. Each wedge is bolted to the base plate of the vacuum chamber. The top surface of the breadboard is located 350 mm below the target chamber centre (TCC). The central table has also a second level 250 mm in depth, which can be used for bigger target manipulators and accessed via the removable central breadboard covers.
Left: The central target table and one wedge from the inner and outer ring. Right: All 21 elements of the breadboard structure.

Figure 43 shows the general layout of the breadboard structure inside the P3 experimental chamber used for the initial commissioning period.
Panorama of the present P3 breadboard configuration.

11 First X-ray measurement in P3
One of the well-known techniques to characterize the interaction of high-power lasers with matter consists of an analysis of emitted X-rays through high-resolution spectroscopy[Reference Renner and Rosmej39]. When focused onto a target with sufficient intensity, the laser pulse is absorbed through different processes inside its skin depth[Reference Rozmus and Tikhonchuk40, Reference Li, Zhang, Sheng, Zheng, Chen, Kodama, Matsuoka, Tampo, Tanaka, Tsutsumi and Yabuuchi41]. Some of these processes lead to an acceleration of suprathermal electrons with energies ranging from several kiloelectronvolts to hundreds of megaelectronvolts depending on the laser parameters. Such electron energies exceed the core–shell ionization threshold of any atom. Consequently, during an interaction between hot electrons and matter, one electron is ejected from the K-shell. This hole is filled in by the transition of another electron from a higher-energy shell. Consequently, a so-called K photon is generated[Reference Smid, Renner, Colaitis, Tikhonchuk, Schlegel and Rosmej42, Reference Condamine, Filippov, Angelo, Pikuz, Renner and Rosmej43]. The easiest transition to detect is the  $\mathrm{K}\unicode{x3b1}$ emission line, meaning that the electron goes from the L-shell to the K-shell.
In the context of the BT commissioning, two X-ray diagnostics were set up in the P3 interaction chamber. First, an imaging crystal was installed to monitor the generation of  $\mathrm{K}\unicode{x3b1}$ lines on a copper target. With this setup, the X-ray emission area is resolved in two dimensions along the target surface with $8\kern0.22em \mu \mathrm{m}$ spatial resolution. The recorded data provides information on the laser energy deposition inside the target. Owing to the good collection efficiency of the X-ray imager, this diagnostic allows the collection of single-shot data even at low laser energies.
Figure 44 shows a typical X-ray Cu  $\mathrm{K}\unicode{x3b1}$ image recorded in a single laser shot at 110 mJ. A white circle with $80\kern0.22em \mu \mathrm{m}$ radius is drawn around the hot spot. The $\mathrm{K}\unicode{x3b1}$ emission expands relatively homogeneously inside this area, which indicates a sufficiently uniform energy distribution within the focal spot. The total number of Cu $\mathrm{K}{\unicode{x3b1}}_1$ photons recorded by the CCD camera (PI-MTE from Princeton Instruments) is $400\pm 40$. From this measurement and after considering the crystal reflectivity, filtering, and CCD camera quantum efficiency, we find a $\mathrm{K}\unicode{x3b1}$ yield equal to $3\times {10}^9\pm 3\times {10}^8$ photons.
Copper  $\mathrm{K}\unicode{x3b1} $ emission recorded during an HAPLS 110 mJ single shot. Photons are emitted relatively homogeneously from the focal spot. The white dashed circle of $160\kern0.22em \mu \mathrm{m}$ diameter represents the emission area.

The second diagnostic benefits from the application of a high-spectral resolution spherical crystal spectrometer monitoring all plasma emission between  $\mathrm{K}\unicode{x3b1}$ and $\mathrm{He}\unicode{x3b1}$ spectral lines, i.e., radiative transitions in singly ionized atoms up to high charge states of almost fully ionized atoms. Figure 45(a) shows a microscope image of the vanadium foil after a series of laser bursts.
(a) Vanadium target patterned in a series of laser bursts indicates a good reproducibility inside the same bursts. (b) Vanadium X-ray  $\mathrm{K}\unicode{x3b1}$ spectrum recorded by an accumulation of 165 shots.

Different bursts are visible. For each of them, the target position compared to the optimum focal spot was slightly different, which explains the different shapes of the holes. However, one can see a very good shot-to-shot stability within single bursts.
Figure 45(b) shows the first X-ray spectrum recorded in the P3 interaction chamber. The emission is spatially integrated over the full plasma expansion. Owing to having just an energy of 85 mJ delivered in individual laser shots, only the low plasma temperature  $\mathrm{K}\unicode{x3b1}$ lines are clearly visible. At low laser energies, the spectrometer cannot record the relevant signal in a single shot owing to the limited collection efficiency of the quartz crystal used. However, capitalizing on the 3.3 Hz laser repetition rate of HAPLS, the accumulation is fast enough to produce high-quality X-ray spectra with the CCD camera. Here, the total exposure duration was 50 s for 165 accumulated shots.
12 Conclusions and outlook
A unique high-performance BT system was carefully engineered and successfully commissioned, ready to guide the HAPLS beam to the versatile P3 target chamber of the ELI-Beamlines plasma physics experimental infrastructure. Despite the very long propagation distances reaching 100 m for the E5 hall it was demonstrated that the BT system contributes with less than  $1\kern0.22em \mu \mathrm{rad}$ RMS to the on-target beam pointing stability. The experimental chamber P3 is not decoupled but bolted directly onto the floor of the building. This is a rather unusual approach for experimental laser–matter interaction chambers. However, owing to the extremely stable and massive base plate and the high-quality bolting, this novel approach is viable as the pointing measurements have shown. It is expected that the present on-target pointing stability can be further improved by optimizing the OAP mount in a similar fashion as the BT mounts. This will be necessary for the upcoming L4f laser beam (nominal 10 PW at 1.5 kJ pulse energy) as this beam is supposed to overlap in space and time with the HAPLS beam for flagship experiments. The experimental hall E3 and the P3 infrastructure have successfully served as a testbed for all other BT branches of ELI-Beamlines.
The preliminary experimental data obtained proves that the entire chain from pulse compressor, via BT, focusing optics, targeting and data acquisition is functional and ready for the energy ramp-up of HAPLS. ELI-Beamlines is conceived as a user facility in the framework of an ERIC (European Infrastructure Consortium[44, 45]) and will start first user operation with the HAPLS soon.
Acknowledgements
The authors acknowledge support from the project Advanced Research Using High-Intensity Laser-Produced Photons and Particles (ADONIS) (CZ.02.1.01/0.0/0.0/16_019/0000789) and by the project High Field Initiative (HiFI) (CZ.02.1.01/ 0.0/0.0/15_003/0000449), both from European Regional Development Fund.
The authors are very grateful for the help and dedicated support from the entire ELI-Beamlines staff. In particular, we are grateful to the following teams who contributed substantially to the commissioning: Department of Laser Systems (J. Cupal, L. Koubíková, D. Kramer, J. Naylon, B. Rus), Department of Technology Infrastructure and Instrumentation Services (P. Bakule, B. Plötzeneder), the safety team (V. Olšovcová), Department of Construction and Design Support (M. Laub, L. Brabec) and Department of Building Infrastructure and IT (R. Kuřátko) for providing laser operation, functional personal safety interlock, radiation safety system, vacuum operation and cleanliness.
We are grateful for the invaluable contributions from D. Heiland and R. Berg-Jahnke of Baudynamik Heiland & Mistler GmbH in Bochum, Germany on the design of the towers and breadboard assemblies as well as to S. Calderon and D. Calderon of Pegasus Design in Livermore, USA, on the design of the switchyards, the vertical mirror mounts and overall design guidance.
Special thanks also to D. Eimerl of EIMEX in Fairfield, USA, who performed the first beam propagation calculations for us and contributed with his extensive experience to the system design.


 Open access

