


1. Introduction
Rayleigh–Bénard convection (RBC) (e.g. Ahlers, Grossmann & Lohse Reference Ahlers, Grossmann and Lohse2009; Lohse & Xia Reference Lohse and Xia2010; Chilla & Schumacher Reference Chilla and Schumacher2012) is the paradigmatic model system to study thermal or buoyancy-driven flows. In reality, most convective systems deviate substantially from the ideal RBC model owing to one or more stabilizing factors. For example, the fluid layer must obviously be confined in the lateral directions for technical applications, background rotation is omnipresent in astro- and geophysics (e.g. Glatzmaier & Roberts Reference Glatzmaier and Roberts1995; Hartmann, Moy & Fu Reference Hartmann, Moy and Fu2001; Heimpel, Aurnou & Wicht Reference Heimpel, Aurnou and Wicht2005; Aurnou et al. Reference Aurnou, Calkins, Cheng, Julien, King, Nieves, Soderlund and Stellmach2015), and the additional contribution of salinity to buoyancy sets up double-diffusive convection in oceanography (e.g. Schmitt et al. Reference Schmitt, Ledwell, Montgomery, Polzin and Toole2005; Timmermans et al. Reference Timmermans, Toole, Krishfield and Winsor2008; Radko Reference Radko2013). Chong et al. (Reference Chong, Yang, Huang, Zhong, Stevens, Verzicco, Lohse and Xia2017) have shown by direct comparison that these different types of stabilization affect the heat transport of the system similarly: for moderate flow stabilization, the heat transport is enhanced compared with the heat transport in the non-stabilized system. On the contrary, when the stabilizing forcing is strong compared with the driving buoyancy, the heat transport is reduced and eventually suppressed. Still, most studies have focused on investigating each of the stabilizing effects separately. This study investigates the heat transport enhancement when two types of stabilization, namely rotation and horizontal confinement, are present simultaneously.
Confined-rotating RBC is fully controlled by four dimensionless parameters: the Prandtl number  $\textit {Pr}$ describing the fluid properties, the Rayleigh number $ {\textit {Ra}}$ setting the strength of thermal driving, the inverse Rossby number $ {\textit {Ro}}^{-1}$ as a measure of the rotation rate and the height-to-width aspect ratio $\varGamma ^{-1}$ defining the horizontal confinement of the domain (complete definitions in § 2). Note that, for convenience, we will use the inverse Rossby number $ {\textit {Ro}}^{-1}$ and the confinement parameter $\varGamma ^{-1}$ throughout the paper, such that the case ( $ {\textit {Ro}}^{-1}=0,\varGamma ^{-1}=0$) characterizes the classical non-stabilized RBC system. The global response of the system is expressed in the Nusselt number $ {\textit {Nu}}$, describing the dimensionless heat transport from the bottom to the top plate, and the directional Reynolds numbers $\textit {Re}_i$ as a measure for the strength of motion in the different directions $i$ (full definitions in § 2).
Several stabilizing effects and mechanisms have been observed in rotating RBC and confined RBC. In general, the stabilizing character of both confinement and rotation increases the critical Rayleigh number  $ {\textit {Ra}}_c$ that is needed to initiate convection (Chandrasekhar Reference Chandrasekhar1961). By increasing rotation $ {\textit {Ro}}^{-1}$ or confinement $\varGamma ^{-1}$ at fixed $ {\textit {Ra}}$, rotating RBC or confined RBC traverses various flow regimes towards a non-convective state. We now describe these regimes in more detail, beginning with rotating RBC.
In the absence of rotation ( $ {\textit {Ro}}^{-1}=0$) and for slow rotation ( $ {\textit {Ro}}^{-1}\ll 1$), thermal buoyancy is the dominating force in the momentum balance. In this buoyancy-dominated regime, the flow dynamics and heat transport are mostly unaffected by the rotation, and often a large-scale background circulation is present (e.g. Brown, Nikolaenko & Ahlers Reference Brown, Nikolaenko and Ahlers2005; van der Poel et al. Reference van der Poel, Ostilla-Mónico, Donners and Verzicco2015). Accordingly, we expect vertical motion to be larger than horizontal motion in the buoyancy-dominated regime ( $\textit {Re}_z>\textit {Re}_H$).
For moderate rotation ( $ {\textit {Ro}}^{-1}\approx 1$), when the Coriolis force and the buoyancy force make a similar contribution, the large-scale circulation is replaced by vertically aligned vortices (e.g. Vorobieff & Ecke Reference Vorobieff and Ecke1998; Kunnen, Clercx & Geurts Reference Kunnen, Clercx and Geurts2008). Counterintuitively to the increasing flow stabilization, the heat transport can be significantly enhanced as compared with the non-rotating case for a system with $\textit {Pr}>1$ (e.g. Kunnen, Clercx & Geurts Reference Kunnen, Clercx and Geurts2006; Zhong et al. Reference Zhong, Stevens, Clercx, Verzicco, Lohse and Ahlers2009). The heat transport enhancement results from Ekman pumping feeding the vortices with hot or cold fluid from the boundary layers (e.g. Rossby Reference Rossby1969). Theoretically, the enhancement by Ekman pumping is most efficient when the kinetic and thermal boundary layer thicknesses are equal (Stevens, Clercx & Lohse Reference Stevens, Clercx and Lohse2010b; Yang et al. Reference Yang, Verzicco, Lohse and Stevens2020), which, however, is only observed up to a certain $ {\textit {Ra}}$ (Yang et al. Reference Yang, Verzicco, Lohse and Stevens2020).
For rapid rotation ( $ {\textit {Ro}}^{-1}\gg 1$), when the Coriolis force largely surpasses the buoyancy force, the flow dynamics is mainly controlled by the geostrophic balance. In this geostrophic (or rotation-dominated) regime, vertical motion is further suppressed (Proudman Reference Proudman1916; Taylor & Lamb Reference Taylor and Lamb1917) and the heat transport decreases rapidly with increasing rotation (e.g. Ecke & Niemela Reference Ecke and Niemela2014). Nonetheless, Ekman pumping remains important for heat transport (Stellmach et al. Reference Stellmach, Lischper, Julien, Vasil, Cheng, Ribeiro, King and Aurnou2014). Different types of flow organization have been observed within the geostrophic regime, depending on $ {\textit {Ra}}$ and $\textit {Pr}$ (e.g. Sprague et al. Reference Sprague, Julien, Knobloch and Werne2006; Julien et al. Reference Julien, Rubio, Grooms and Knobloch2012; Nieves, Rubio & Julien Reference Nieves, Rubio and Julien2014; Stellmach et al. Reference Stellmach, Lischper, Julien, Vasil, Cheng, Ribeiro, King and Aurnou2014): the flow can either still organize in vertically coherent structures (e.g. convective Taylor columns) or settle into vertically decorrelated geostrophic turbulence. Moreover, Zhang et al. (Reference Zhang, van Gils, Horn, Wedi, Zwirner, Ahlers, Ecke, Weiss, Bodenschatz and Shishkina2020) and de Wit et al. (Reference de Wit, Guzmán, Madonia, Cheng, Clercx and Kunnen2020) recently discovered boundary zonal flow in finite-size cylinders, which can make a significant contribution to the heat transport (Lu et al. Reference Lu, Ding, Shi, Xia and Zhong2021; Zhang, Ecke & Shishkina Reference Zhang, Ecke and Shishkina2021). This already depicts an interplay of confinement and rotation.
In both the moderately rotating and the geostrophic regime, vortical structures dominate the flow. Hence, we expect horizontal motion to be larger than vertical motion ( ${\textit {Re}_H>\textit {Re}_z}$). In the context of this paper, we refer to both together as the rotation-controlled regime as the direct counterpart of the buoyancy-dominated regime. Accordingly, we will use $\textit {Re}_z=\textit {Re}_H$ as our definition to describe the transition between the two regimes. We note that various definitions for this transition and the corresponding transitional Rossby number $ {\textit {Ro}}^{-1}_{{BD\text {-}RC}}$ have been used in literature based on different characteristics, when (i) the kinetic boundary layer changes from Prandtl–Blasius type to Ekman type (Stevens et al. Reference Stevens, Zhong, Clercx, Ahlers and Lohse2009; Stevens, Clercx & Lohse Reference Stevens, Clercx and Lohse2010a; Kunnen et al. Reference Kunnen, Stevens, Overkamp, Sun, van Heijst and Clercx2011; Rajaei et al. Reference Rajaei, Joshi, Alards, Kunnen, Toschi and Clercx2016a), (ii) the flow dynamics changes from a large-scale circulation to vertically aligned vortices (Julien et al. Reference Julien, Legg, McWilliams and Werne1996; Kunnen et al. Reference Kunnen, Clercx and Geurts2008; Rajaei et al. Reference Rajaei, Joshi, Kunnen and Clercx2016b) and (iii) heat transport enhancement sets in (Stevens et al. Reference Stevens, Zhong, Clercx, Ahlers and Lohse2009; Weiss et al. Reference Weiss, Stevens, Zhong, Clercx, Lohse and Ahlers2010). However, several recent studies have revealed a more detailed view of this transition (Weiss & Ahlers Reference Weiss and Ahlers2011a; Stevens, Clercx & Lohse Reference Stevens, Clercx and Lohse2013a; Weiss, Wei & Ahlers Reference Weiss, Wei and Ahlers2016), and have shown that the different characteristics are related to similar, but slightly different rotation rates within a narrow interval of $ {\textit {Ro}}^{-1}$ (Wei, Weiss & Ahlers Reference Wei, Weiss and Ahlers2015; Alards et al. Reference Alards, Kunnen, Stevens, Lohse, Toschi and Clercx2019).
Finally, beyond a critical rotation rate ( $ {\textit {Ro}}^{-1}> {\textit {Ro}}^{-1}_c$), the amount of thermal driving does not suffice to initiate convection ( $ {\textit {Ra}}< {\textit {Ra}}_c( {\textit {Ro}}^{-1}$)), and the heat transport is purely conductive. In finite-size systems, an additional regime of wall-mode convection is observed for $ {\textit {Ro}}^{-1}> {\textit {Ro}}^{-1}_c$ (e.g. Buell & Catton Reference Buell and Catton1983; Zhong, Ecke & Steinberg Reference Zhong, Ecke and Steinberg1991; Liu & Ecke Reference Liu and Ecke1997; Favier & Knobloch Reference Favier and Knobloch2020). Therein, the bulk is already in rest, but weak convective flow is generated next to the sidewalls, which results in a heat transport larger than conduction. This again depicts an interplay of confinement and rotation.
Analogue regimes in terms of the heat transport also exist in confined RBC (Chong et al. Reference Chong, Huang, Kaczorowski and Xia2015; Chong & Xia Reference Chong and Xia2016). In domains with a large horizontal extent ( $\varGamma ^{-1}\ll 1$) the flow is controlled by the boundary layers as in classical RBC (Chong et al. Reference Chong, Huang, Kaczorowski and Xia2015). In this regime, the heat transport is mostly insensitive to $\varGamma ^{-1}$ and adapts the value from the unconfined case. By reducing the horizontal extent the flow first enters a plume-controlled regime for moderate confinement ( $\varGamma ^{-1}\gtrsim 1$), in which the heat transport is enhanced, before, in the severely confined regime ( $\varGamma ^{-1}\gg 1$), the heat transport is strongly reduced (Chong et al. Reference Chong, Huang, Kaczorowski and Xia2015; Chong & Xia Reference Chong and Xia2016). Finally, the system becomes too confined to initiate convection $ {\textit {Ra}}_c(\varGamma ^{-1})> {\textit {Ra}}$ (e.g. Chandrasekhar Reference Chandrasekhar1961; Catton & Edwards Reference Catton and Edwards1970; Chong & Xia Reference Chong and Xia2016; Ahlers et al. Reference Ahlers2022). Similar to the rotation-controlled regime in rotating RBC, vertically coherent structures form within the plume-controlled regime in confined RBC (Chong et al. Reference Chong, Huang, Kaczorowski and Xia2015; Hartmann et al. Reference Hartmann, Chong, Stevens, Verzicco and Lohse2021). Contrary to the studies of Chong et al. (Reference Chong, Huang, Kaczorowski and Xia2015, Reference Chong, Yang, Huang, Zhong, Stevens, Verzicco, Lohse and Xia2017) and Chong & Xia (Reference Chong and Xia2016), the present study deals with cylindrical confinement. Hartmann et al. (Reference Hartmann, Chong, Stevens, Verzicco and Lohse2021) have shown that heat transport enhancement in confined RBC generally occurs in cylindrical and cuboid domains, but flow organization, optimal confinement $\varGamma ^{-1}$ and amplitude of heat transport enhancement are strongly influenced by the cell geometry. Further, Zwirner & Shishkina (Reference Zwirner and Shishkina2018) have shown that an inclined gravity in addition to confinement is able to significantly enhance the heat transport.
Chong et al. (Reference Chong, Yang, Huang, Zhong, Stevens, Verzicco, Lohse and Xia2017) have nicely revealed more striking similarities in heat transport enhancement for individually examined types of stabilization: confinement, rotation and an additional stabilizing buoyant scalar field as in double-diffusive convection. These similarities lead to the question of how multiple types of stabilization exactly interplay with each other, whether their effects simply superpose or complexly interact. By direct numerical simulations (DNSs) of confined-rotating RBC in a cylindrical set-up (§ 2), we explore the two-dimensional parameter space of  $ {\textit {Ro}}^{-1}$ and $\varGamma ^{-1}$ at fixed $ {\textit {Ra}}$ and $\textit {Pr}$ to identify the maxima of heat transfer (§ 3), elucidate the governing effects and mechanisms and discuss their interaction (§ 4). Finally, we will compare the results from different $ {\textit {Ra}}$ and discuss their implications (§ 5).
2. Numerical set-up and analysis methods
We perform DNSs of RBC in a cylindrical sample rotating around its vertical axis. The governing equations in RBC encompass the balances of mass, momentum and energy conservation. The influence of constant rotation around the axis is included by considering the Coriolis force in the momentum equations. For an incompressible fluid the governing equations under the Oberbeck–Boussinesq approximation are solved in their dimensionless form (e.g. Zhong et al. Reference Zhong, Stevens, Clercx, Verzicco, Lohse and Ahlers2009)
 \begin{equation} \left.\begin{gathered} \boldsymbol{\nabla}\boldsymbol{\cdot}\boldsymbol{u}=0\\ \frac{\mathrm{d}\boldsymbol{u}}{\mathrm{d}t}=-\boldsymbol{\nabla} P + \sqrt{\frac{\textit{Pr}}{ {\textit{Ra}}}}\nabla^2\boldsymbol{u}+\varTheta\boldsymbol{e}_z-\frac{1}{ {\textit{Ro}}}\boldsymbol{e}_z \times\boldsymbol{u}\\ \frac{\mathrm{d}\varTheta}{\mathrm{d}t}=\frac{1}{\sqrt{\textit{Pr}\, {\textit{Ra}}}}\nabla^2\varTheta. \end{gathered}\right\} \end{equation}
Here,  $\boldsymbol {u}$, $P$ and $\varTheta$ are the normalized velocity, pressure and temperature fields, respectively. The equations are normalized by the height of the cylinder $H$ and the free-fall velocity $U_0=\sqrt {\alpha g \Delta T H}$, where $\alpha$ is the isobaric thermal expansion coefficient, $g$ the gravitational acceleration and $\Delta T$ the temperature difference between upper and lower plate. The temperature is normalized as $\varTheta =({T-T_{{top}}})/{\Delta T}\in [0,1]$. The pressure field P is reduced by the hydrostatic balance and centrifugal contributions. The control parameters in the equations then are the Prandtl number $\textit {Pr}$, the Rayleigh number $ {\textit {Ra}}$ and the inverse Rossby number $ {\textit {Ro}}^{-1}$
 \begin{equation} \textit{Pr}=\nu/\kappa;\quad {\textit{Ra}}=\alpha g \Delta T H^{3}/(\nu\kappa) ;\quad {\textit{Ro}}^{{-}1}=2\varOmega H/U_0. \end{equation}
Here,  $\nu$ is the kinematic viscosity, $\kappa$ the thermal diffusivity and $\varOmega$ the rotation rate. The inverse Rossby number $ {\textit {Ro}}^{-1}$ can alternatively be expressed in terms of the Ekman number $ {\textit {Ek}}$: $ {\textit {Ro}}^{-1}=2\sqrt {\textit {Pr}/ {\textit {Ra}}}\, {\textit {Ek}}^{-1}$. Finally, the confinement parameter $\varGamma ^{-1}$ defines the cylinder size of height $H$ and diameter $D$:
$D$:
 \begin{equation} \varGamma^{{-}1}=H/D. \end{equation}
No-slip boundary conditions are imposed on the isothermal top and bottom plates and the adiabatic sidewall. In all simulations the Prandtl number is fixed at  $\textit {Pr}=4.38$ ( $\approx$ water), the Rayleigh number is chosen in the range $2\times 10^{8}\leqslant {\textit {Ra}}\leqslant 7\times 10^{9}$. Among all $ {\textit {Ra}}$ we cover a parameter space of $0\leqslant {\textit {Ro}}^{-1}\leqslant 40$ and $2\leqslant \varGamma ^{-1}\leqslant 32$.
The governing equations (2.1) are solved by a central second-order accurate finite-difference discretization on a staggered grid as presented in Verzicco & Orlandi (Reference Verzicco and Orlandi1996) and Verzicco & Camussi (Reference Verzicco and Camussi1997, Reference Verzicco and Camussi1999). The code has been often validated (e.g. Kooij et al. Reference Kooij, Botchev, Frederix, Geurts, Horn, Lohse, van der Poel, Shishkina, Stevens and Verzicco2018). For a sufficient resolution of the Kolmogorov scales in the entire domain, we increase the number of grid points in the vertical direction from  $N_z=256$ for $ {\textit {Ra}}=2\times 10^{8}$ up to $N_z=768$ for $ {\textit {Ra}}=7\times 10^{9}$. Additionally, we use a stretched grid in the vertical and radial directions to ensure that the resolution of the boundary layers at the plates and the sidewall fulfil the required criteria given in Shishkina et al. (Reference Shishkina, Stevens, Grossmann and Lohse2010). The dynamic time stepping in our simulations is controlled by a maximum Courant number and a maximum time step. The numerical parameters per simulation set are summarized in Appendix A.
The global key response parameter of the system is the dimensionless heat transport given by the Nusselt number  $ {\textit {Nu}}=Q H/(\kappa \Delta T)$ with the heat flux $Q$ from the bottom to the top plate. We compute $ {\textit {Nu}}\equiv \left \langle {\textit {Nu}}(t)\right \rangle _t$ directly from the vertical gradient of the dimensionless temperature $\varTheta$ as the average $\left \langle \cdot \right \rangle$ over both plates
 \begin{equation} {\textit{Nu}}(t)=\left\langle-\partial_z\left\langle\varTheta(t)\right\rangle_{r,\vartheta}\right\rangle_{z=\{0,1\}}. \end{equation}
For comparison between different  $ {\textit {Ra}}$, we present all heat transport data normalized as $ {\textit {Nu}}/ {\textit {Nu}}_0$, where $ {\textit {Nu}}_0( {\textit {Ra}}, {\textit {Ro}}^{-1}=0,\varGamma ^{-1}=1)$ serves as $ {\textit {Ra}}$-dependent reference value of the (mostly) non-stabilized system, i.e. a non-rotating, sufficiently wide cylinder. The reference values $ {\textit {Nu}}_0$ are known from various experiments and numerical simulations, and are well described by the Grossmann–Lohse theory (Grossmann & Lohse Reference Grossmann and Lohse2000, Reference Grossmann and Lohse2001; Stevens et al. Reference Stevens, van der Poel, Grossmann and Lohse2013b). Further, we use the root mean square (r.m.s.) of the normalized temporal Nusselt number fluctuations to quantify the temporal stability of the flow
 \begin{equation} {\textit{Nu}}_{rms}=\sqrt{\left\langle\left(\frac{{\textit{Nu}}(t)}{\left\langle{\textit{Nu}}\right\rangle_t}-1\right)^{2}\right\rangle_t}. \end{equation}
 To characterize the flow we use the directional Reynolds numbers  $\textit {Re}_{r,\vartheta,z}\equiv \left \langle \textit {Re}_{r,\vartheta,z}(t)\right \rangle _t$ based on the dimensionless r.m.s. velocities $\sqrt {\left \langle u_{i}^{2}\right \rangle _{r,\vartheta,z}}$
 \begin{align} \textit{Re}_{i}(t)&=\frac{U_0 H}{\nu}\sqrt{\left\langle u_{i}^{2}(t)\right\rangle_{r,\vartheta,z}}:\ i=\{r,\vartheta,z\} \nonumber\\ &=\sqrt{\frac{{\textit{Ra}}}{\textit{Pr}}}\sqrt{\left\langle u_{i}^{2}(t)\right\rangle_{r,\vartheta,z}}.\end{align}
These Reynolds numbers allow the distinction of the strength of fluid motion in the different directions, i.e. radial, azimuthal and vertical directions. Consequently, their ratios can depict the predominant flow motion and will help to classify characteristic flow states. Temporal averaging starts when the statistically stationary state has been reached.
The ratio of thermal to kinetic boundary layer thicknesses plays a crucial role in Ekman pumping related heat transport enhancement (Stevens et al. Reference Stevens, Clercx and Lohse2010b; Yang et al. Reference Yang, Verzicco, Lohse and Stevens2020). We determine the thermal boundary layer thickness  $\lambda _{\varTheta }$ from the vertical profile of the horizontally averaged temperature (e.g. Stevens et al. Reference Stevens, Clercx and Lohse2010a), where $\lambda _{\varTheta }$ is defined as the intersection between the temperature gradient at the plate with a linear fit to the temperature profile in the bulk ( $0.2\leqslant z\leqslant 0.8$). Following Stevens et al. (Reference Stevens, Clercx and Lohse2010a) and Yang et al. (Reference Yang, Verzicco, Lohse and Stevens2020), the kinetic boundary layer thickness $\lambda _u$ is estimated as twice the height of the peak location of the horizontally averaged quantity $\left \langle \boldsymbol {u}\boldsymbol {\cdot }\nabla ^{2}\boldsymbol {u}\right \rangle _H$. The horizontal averages involve only 90 % of the radial distance from the axis, which in our case worked best to consistently exclude effects of the sidewall boundary layer (Wagner, Shishkina & Wagner Reference Wagner, Shishkina and Wagner2012). The reported values are averaged over top and bottom boundary layers.
3. Heat transport maxima under rotation and confinement
First, we keep  $ {\textit {Ra}}=7\times 10^{8}$ (and $\textit {Pr}=4.38$) fixed and vary the confinement parameter $\varGamma ^{-1}$ and the rotation rate $ {\textit {Ro}}^{-1}$. When, on the one hand, $\varGamma ^{-1}$ is varied in the absence of rotation $ {\textit {Ro}}^{-1}=0$, the normalized heat transport $ {\textit {Nu}}/ {\textit {Nu}}_0$ is largest for $\varGamma ^{-1}=12$ (figure 1a). When, on the other hand, $ {\textit {Ro}}^{-1}$ is varied in a relatively wide cylinder with $\varGamma ^{-1}=3$, the largest $ {\textit {Nu}}/ {\textit {Nu}}_0$ is reached at $ {\textit {Ro}}^{-1}\approx 8$. Both are known as the heat transport enhancement by either moderate confinement (e.g. Huang et al. Reference Huang, Kaczorowski, Ni and Xia2013; Chong et al. Reference Chong, Huang, Kaczorowski and Xia2015) or moderate rotation (e.g. Zhong et al. Reference Zhong, Stevens, Clercx, Verzicco, Lohse and Ahlers2009; Kunnen et al. Reference Kunnen, Stevens, Overkamp, Sun, van Heijst and Clercx2011). However, surprisingly, the two-dimensional parameter subspace of $\varGamma ^{-1}$ and $ {\textit {Ro}}^{-1}$ reveals a strongly non-symmetric enhancement of the heat transport when both confinement and rotation are present simultaneously (figure 1a). Hence, the enhancing effects of both types of stabilization do not simply superpose with each other. Instead they interact in a more complex way.
Heat transport maxima and flow characteristics in the parameter space of rotation  $ {\textit {Ro}}^{-1}$ and confinement $\varGamma ^{-1}$ for $ {\textit {Ra}}=7\times 10^{8}$. A, B and C mark the positions of the confinement (§ 3.1), double-vortex (§ 3.2) and single-vortex maxima (§ 3.3), respectively. Grey, green and red lines show the transitions between the (sub-)regimes of prominent flow characteristics. (a) Normalized heat transport $ {\textit {Nu}}/ {\textit {Nu}}_0$ (circles, data points; background, cubic interpolation). (b) Regimes of prominent flow motion based on linear interpolation of $\textit {Re}_{\vartheta,r,z}$ data. The grey area depicts the buoyancy-dominated regime ( $\textit {Re}_z>\textit {Re}_H=(\textit {Re}_{\vartheta }^{2}+\textit {Re}_{r}^{2})^{1/2}$). The coloured areas belong to the rotation-controlled regime ( $\textit {Re}_H>\textit {Re}_z$). In the green sub-regime the characteristic flow motion ( $\textit {Re}_{\vartheta }>\textit {Re}_r>\textit {Re}_z$) indicates double-vortex flow. In the red sub-regime suppressed radial motion (see (e)) indicates single-vortex flow. The symbol colour shows again the heat transport $ {\textit {Nu}}/ {\textit {Nu}}_0$. (c) Mean vertical temperature gradient in the bulk $\langle \partial _z\langle \varTheta \rangle _{r,\vartheta,t}\rangle _{0.2\leqslant z\leqslant 0.8}$ (circles, data points; background, linear interpolation). (d) Temporal stability of the flow based on $ {\textit {Nu}}_{rms}$ ((2.5), circles, data points; background, linear interpolation). (e) Ratio of azimuthal to radial Reynolds numbers $\textit {Re}_{\vartheta }/\textit {Re}_r$ (circles, data points; background, linear interpolation).

Our simulations reveal three separate maxima of the heat transport (figure 1a). Maximum A is the heat transport enhancement by moderate confinement in the absence of rotation, which vanishes already under weak rotation. Therefore, we will hereafter refer to it as the confinement maximum. On the contrary, the enhancement by moderate rotation  $ {\textit {Ro}}^{-1}$ in large domains does not directly vanish with increasing confinement $\varGamma ^{-1}$ (figure 1a). It further extends into the $( {\textit {Ro}}^{-1},\varGamma ^{-1})$ parameter space and even increases up to maximum B, which is the largest heat transport achieved for $ {\textit {Ra}}=7\times 10^{8}$. Thereby, the range of $ {\textit {Ro}}^{-1}$, which enhances the heat transport, shifts towards faster rotation with increasing $\varGamma ^{-1}$, and separates from the confinement maximum. The onset of heat transport enhancement strongly correlates with $\textit {Re}_z=\textit {Re}_H=(\textit {Re}_{\vartheta }^{2}+\textit {Re}_{r}^{2})^{1/2}$, the transition from buoyancy-dominated to rotation-controlled regime (figure 1b; thick grey line), which will be further discussed in § 4. Even more surprisingly, we observe a third maximum C at the tip of the enhancement region around maximum B.
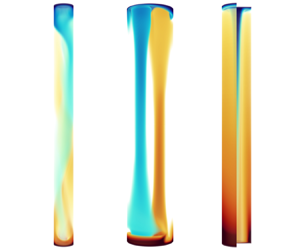
All maxima are associated with an individual (sub-)regime of the fluid motion (figure 1b), which characterizes the flow pattern around each maximum. At the confinement maximum the flow forms vertically coherent buoyant plumes (figure 2a). At maximum B the flow is organized in two stable vortices (figure 3a). Hence, we will hereafter refer to it as the double-vortex maximum. At maximum C the flow is characterized by one stable central vortex (figure 4a). Accordingly, we will refer to it as the single-vortex maximum. Next, we present each of the three maxima and its specific flow dynamics separately in detail (§§ 3.1–3.3).
Flow characteristics at the confinement maximum at  $ {\textit {Ra}}=7\times 10^{8}$ ( $\varGamma ^{-1}=12$, $ {\textit {Ro}}^{-1}=0$): (a) snapshot of the temperature field, (b) temporal evolution of $ {\textit {Nu}}(t)$ at the top and bottom plate, (c) temporal evolution of $\textit {Re}(t)$ for each velocity component.

Flow characteristics at the steady double-vortex maximum at  $ {\textit {Ra}}=7\times 10^{8}$ ( $\varGamma ^{-1}=5, {\textit {Ro}}^{-1}=12.5$): (a) snapshot of the temperature field, (b) temporal evolution of $ {\textit {Nu}}(t)$ at the top and bottom plate, (c) temporal evolution of $\textit {Re}(t)$ for each velocity component.

Flow characteristics at the steady single-vortex maximum at  $ {\textit {Ra}}=7\times 10^{8}$ ( $\varGamma ^{-1}=8, {\textit {Ro}}^{-1}=20$): (a) snapshot of the temperature field, (b) temporal evolution of $ {\textit {Nu}}(t)$ at the top and bottom plate, (c) temporal evolution of $\textit {Re}(t)$ for each velocity component.

3.1. Flow organization around the confinement maximum (A)
At the confinement maximum, the flow tends to organize into two plumes: one up- and one downwelling plume of hot and cold fluid, respectively (figure 2a). Both plumes span the entire vertical distance and connect the boundary layers along top and bottom plates (Hartmann et al. Reference Hartmann, Chong, Stevens, Verzicco and Lohse2021). Both plumes are entangled such that they emerge around the sidewalls and impact at the centre on the opposite plate. At boundary layer height this structure yields the same characteristic pattern of plume distribution for the optimal heat transport in confined RBC (Chong et al. Reference Chong, Huang, Kaczorowski and Xia2015, Reference Chong, Yang, Huang, Zhong, Stevens, Verzicco, Lohse and Xia2017). The integral quantities  $ {\textit {Nu}}$ and $\textit {Re}$ (figure 2b,c) are strongly fluctuating in time, which indicates that – typical for turbulent convection – these plumes are relatively unstable. Vertical motion is predominant ( $\textit {Re}_z\gg \textit {Re}_{\vartheta,r}$, figure 2c) as expected in the buoyancy-dominated regime in which ${\textit {Re}_z>\textit {Re}_{H}=(\textit {Re}_{\vartheta }^{2}+\textit {Re}_{r}^{2})^{1/2}}$ (figure 1b; grey area).
Further, the confinement maximum in a cylindrical domain correlates with a local minimum of the temperature gradient in the bulk (figure 1c, see also Hartmann et al. Reference Hartmann, Chong, Stevens, Verzicco and Lohse2021). A flatter bulk gradient can indicate two situations: more turbulent mixing in general, or larger mutual vertically coherent structures that compensate each other in the horizontal average within the entire bulk region. Obviously, the second is the case at the confinement maximum. At the optimal confinement, a domain-spanning double-plume structure is triggered, which maximizes this effect. Moderate confinement reduces horizontal mixing and thereby supports vertical transport and the formation of vertically coherent structures (Chong et al. Reference Chong, Huang, Kaczorowski and Xia2015; Chong & Xia Reference Chong and Xia2016; Chong et al. Reference Chong, Yang, Huang, Zhong, Stevens, Verzicco, Lohse and Xia2017). When  $\varGamma ^{-1}$ is increased beyond the optimum, the growing impact of the sidewalls reduces the heat transport (Chong et al. Reference Chong, Huang, Kaczorowski and Xia2015; Chong & Xia Reference Chong and Xia2016). Similarly, coherent flow structures in wall-normal direction help to maximize the heat transport in inclined-confined RBC (Zwirner & Shishkina Reference Zwirner and Shishkina2018).
3.2. Flow organization around the double-vortex maximum (B)
At the double-vortex maximum, the flow consists of two vortices, one vortex of hot (cold) fluid that emerges from the bottom (top) plate (figure 3a). Both span the entire domain side by side and connect top and bottom boundary layers. Such vertically aligned vortices are typically observed at the heat transport maximum in the rotation-controlled regime (e.g. Stevens, Clercx & Lohse Reference Stevens, Clercx and Lohse2012). This flow structure appears to be very steady after it has fully developed for  $ {\textit {Ra}}=7\times 10^{8}$ (figure 3b,c). The double-vortex structure is characterized by a different configuration of mean fluid motion in the flow: both lateral motions, azimuthal $\textit {Re}_{\vartheta }$ and radial $\textit {Re}_r$, are significantly larger than the vertical motion $\textit {Re}_z$ (figure 3c). In particular, we observe $\textit {Re}_\vartheta >\textit {Re}_r>\textit {Re}_z$, which will serve as an indicator to identify the formation of double-vortex flow (figure 1b). The temporal stability of this flow structure is also visible in the Nusselt number fluctuations $ {\textit {Nu}}_{rms}$ (2.5). We find a region with stable flow formation in the $( {\textit {Ro}}^{-1},\varGamma ^{-1})$ parameter space around the double-vortex and the single-vortex maxima (figure 1d). The appearance of stable flow co-occurring with enormous heat transport enhancement in the sub-regime of double-vortex flow can be linked to a stabilizing temperature gradient in the bulk $\langle \partial _z\langle \varTheta \rangle _{r,\vartheta,t}\rangle _{0.2\leqslant z\leqslant 0.8}>0$ (figure 1c). Such a temperature inversion is known to stabilize flow formations (Tilgner, Belmonte & Libchaber Reference Tilgner, Belmonte and Libchaber1993; Brown & Ahlers Reference Brown and Ahlers2007), in this case the two opposing domain-spanning Ekman vortices. Consequently, cylindrical confinement plays a crucial role in maximizing the heat transport by stabilizing the double-vortex state in a very narrow range of ( $Ro^{-1},\varGamma ^{-1}$) combinations.
3.3. Flow organization around the single-vortex maximum (C)
At the single-vortex maximum, the flow organizes itself in one central vortex of cold (or hot) fluid sinking (rising) from the top (bottom) plate and a curtain of hot (cold) fluid rising (sinking) at the sidewall (figure 4a). At the maximum this single-vortex flow is also very stable (figure 4b,c), although it is not top–bottom symmetric. Also, the single-vortex maximum is related to a very distinct flow organization (figure 4c). Again, azimuthal motion  $\textit {Re}_{\vartheta }$ is predominant, and thus horizontal motion $\textit {Re}_{H}$ is also stronger than vertical motion $\textit {Re}_{z}$. However, radial motion $\textit {Re}_{r}$ is almost entirely suppressed in the single-vortex state. This results in an extreme ratio between the lateral components $\textit {Re}_\vartheta /\textit {Re}_r\gg 1$, a geometric effect of a singular vortex centred in a cylindrical coordinate system. In this case, the vortex itself does not have a radial flow component. Radial motion occurs only close to the top and bottom plates. On the contrary, any off-centred vortex contains a radial flow component in the cylindrical reference system.
Nevertheless, the presence of a single-vortex flow structure in the  $( {\textit {Ro}}^{-1},\varGamma ^{-1})$ parameter space can be identified by a significantly increased ratio $\textit {Re}_{\vartheta }/\textit {Re}_{r}\gg 1$ with its maximum directly located at the single-vortex heat transport maximum (figure 1e). The other maxima do not show any significant dependence on this ratio (elsewhere $\textit {Re}_{\vartheta }/\textit {Re}_{r}\approx 1$). Single-vortex flow is limited to a small regime in the $( {\textit {Ro}}^{-1},\varGamma ^{-1})$ parameter space and the transition is very sharp. Only between the single-vortex maximum and the double-vortex maximum can a more gradual increase of the ratio $\textit {Re}_{\vartheta }/\textit {Re}_{r}$ be identified (figure 1e). For our data, an arbitrary threshold of $\textit {Re}_{\vartheta }/\textit {Re}_{r}\geqslant 2.5$ is appropriate to identify the sub-regime of single-vortex flow (figure 1e,b). The existence of single-vortex flow (figure 1e) corresponds well with the partial region of steady flow formation (figure 1d) that has not been linked to bulk temperature inversion due to double-vortex flow (figure 1c).
Single-vortex flow is always related to an extreme ratio  $\textit {Re}_{\vartheta }/\textit {Re}_{r}$, but it can be interrupted by periods of turbulent mixing for $( {\textit {Ro}}^{-1},\varGamma ^{-1})$ combinations beside the maximum (Appendix B: figure 11). We assume that the single-vortex flow in one configuration becomes unstable due to its lack of symmetry and recovers it by reverting the flow configuration. Interestingly, the temporal stability of single-vortex flow increases (periods of steady single-vortex flow elongate) towards the maximum where no instability has been observed (figure 4b,c). Thus, the time-averaged $\textit {Re}_{\vartheta }/\textit {Re}_{r}$ ratio does also reflect the temporal stability of the single-vortex flow (figure 1e). Whether the flow can be infinitely stable in one configuration at the single-vortex maximum remains an open question.
We note that, although the sidewall obviously plays an essential role for single-vortex flow, the flow dynamics is very different from the recently observed boundary zonal flow (Zhang et al. Reference Zhang, van Gils, Horn, Wedi, Zwirner, Ahlers, Ecke, Weiss, Bodenschatz and Shishkina2020). First, in single-vortex flow, either hot or cold fluid is transported along the sidewall, while in boundary zonal flow both hot and cold plumes alternate. Second, single-vortex flow includes a convective bulk, whereas for boundary zonal flow the bulk is at rest. Third, single-vortex flow is steady, whereas boundary zonal flow is still turbulent. Finally, the two are observed in different parameter ranges, suggesting that both are only local – not global – states in the parameter space.
4. Interfering effects for heat transport enhancement
The central mechanism for heat transport enhancement under rotation is Ekman pumping (e.g. Rossby Reference Rossby1969). The common view is that the onset of Ekman pumping causes the transition from a large-scale circulation to vertically aligned vortices, which can result in heat transport enhancement (Julien et al. Reference Julien, Legg, McWilliams and Werne1996). Although it has been recently observed that the onset of heat transport enhancement and the change in flow dynamics have slightly different onsets (Alards et al. Reference Alards, Kunnen, Stevens, Lohse, Toschi and Clercx2019), both are certainly closely related to each other.
In this work, we define the transition from buoyancy-dominated to rotation-controlled regime by the change of the predominant fluid motion from vertical to horizontal, i.e. at  $\textit {Re}_{z}=\textit {Re}_{H}$ (figure 1b; thick grey line). The transition ${\textit {Re}_{z}=\textit {Re}_{H}=(\textit {Re}_{\vartheta }^{2}+\textit {Re}_{r}^{2})^{1/2}}$ describes the onset of heat transport enhancement in very confined systems significantly better than the commonly used transition of the kinetic boundary layer from Prandtl–Blasius type to Ekman type (Appendix B: figure 12). We note that, in this context, any Ekman pumping related increase of $ {\textit {Nu}}$ with $ {\textit {Ro}}^{-1}$ is seen as heat transport enhancement independent of whether $ {\textit {Nu}}/ {\textit {Nu}}_0>1$ or not. In our view, it is reasonable that vertical motion is predominant in the buoyancy-dominated regime, and horizontal motion takes over in the rotation-controlled regime, when vortical structures dominate the flow. The vortical structures extend the vertical transport induced by Ekman pumping through the bulk, which thereby increases the heat transport. We observe that all simulations with a rotation enhanced heat transport are characterized by $\textit {Re}_{H}>\textit {Re}_{z}$, and that the onset is located just beyond this transition (figure 1b).
Both the transition  $\textit {Re}_{z}=\textit {Re}_{H}$ and the onset of heat transport enhancement simultaneously shift towards faster rotation $ {\textit {Ro}}^{-1}$ with increasing confinement $\varGamma ^{-1}$. With increasing $\varGamma ^{-1}$, the cylinder diameter approaches the critical length scale of convective instability $L_c=4.82\times Ek^{1/3}$ for rotating RBC (Chandrasekhar Reference Chandrasekhar1961; Kunnen et al. Reference Kunnen, Ostilla-Mónico, van der Poel, Verzicco and Lohse2016). We assume that the formation of vortical flow structures requires a minimal lateral size, i.e. a maximal confinement $\varGamma ^{-1}_{max}(L_c)$, which can be reached with faster rotation. Consequently, the transitional rotation rate $ {\textit {Ro}}^{-1}_{BD\text {-}RC}$ for the onset of heat transport enhancement is strongly $\varGamma ^{-1}$-dependent in slender cylinders, but might be insensitive to $\varGamma ^{-1}$ in sufficiently wide domains. Several approaches employ a Ginzburg–Landau model to account for the $\varGamma ^{-1}$-dependence (e.g. Weiss et al. Reference Weiss, Stevens, Zhong, Clercx, Lohse and Ahlers2010; Weiss & Ahlers Reference Weiss and Ahlers2011b), but ignore any $ {\textit {Ra}}$-dependence, which will be addressed in § 5.
Ideally, an equal thickness of thermal and kinetic boundary layer is supposed to maximize the heat transport in rotating RBC (e.g. Julien et al. Reference Julien, Legg, McWilliams and Werne1996; King et al. Reference King, Stellmach, Noir, Hansen and Aurnou2009), since Ekman pumping becomes most efficient in ejecting heat from the boundary layers into the columnar vortices (Stevens et al. Reference Stevens, Clercx and Lohse2010b). However, this is only valid up to a certain  $ {\textit {Ra}}$ and confinement (Yang et al. Reference Yang, Verzicco, Lohse and Stevens2020). Similar to Yang et al. (Reference Yang, Verzicco, Lohse and Stevens2020), we test this assumption by mapping the heat transport onto the ratio of thermal and kinetic boundary layer thicknesses $\lambda _{\varTheta }/\lambda _u$ for fixed confinement $\varGamma ^{-1}$ (figure 5). Thereby, an increasing $\lambda _{\varTheta }/\lambda _u$ is generally related to an increasing $ {\textit {Ro}}^{-1}$. Accordingly, our widest cylinder ( $\varGamma ^{-1}=3$) shows a relatively symmetric heat transport enhancement around $\lambda _{\varTheta }/\lambda _u=1$ (figure 5a). With increasing confinement ( $\varGamma ^{-1}=4$), the maximal heat transport at $\lambda _{\varTheta }/\lambda _u\approx 1$ significantly increases but also gains some asymmetry around the enhancement peak (figure 5a). Thereby, the large heat transport coincides with the presence of double-vortex flow (figure 5d; green symbols). For confinement $\varGamma ^{-1}_{2VM}=5$, at which the double-vortex maximum is obtained, the peak is still located close to $\lambda _{\varTheta }/\lambda _u\!=\!1$, but with a rather sharp onset just at $\lambda _{\varTheta }/\lambda _u\approx 1$ (figure 5b). The largest heat transport is again associated with stable double-vortex flow (figure 5e; green symbols). In slender cylinders ( $\varGamma ^{-1}>\varGamma ^{-1}_{2VM}$), no enhancement can be observed around $\lambda _{\varTheta }/\lambda _u=1$ (figure 5c). Still, large heat transport is observed twice: (i) rotation induced enhancement only appears at $\lambda _{\varTheta }/\lambda _u>1$ again with an extremely sharp onset. The largest heat transport again coincides with double-vortex or single-vortex flow (figure 5f; green and red symbols). (ii) Large heat transport at $\lambda _{\varTheta }/\lambda _u\approx 0.6<1$ corresponds to the non-rotating cases and the enhancement due to confinement (§ 3.1), which is different from the expectation $\lambda _{\varTheta }/\lambda _u\approx 1$ based on the unifying view of Chong et al. (Reference Chong, Yang, Huang, Zhong, Stevens, Verzicco, Lohse and Xia2017). We explain this deviation by the different definitions used to determine the kinetic boundary layer thickness. This, however, seems to affect mainly the estimates for the non-rotating confined cases. Nonetheless, the kinetic and thermal boundary layers themselves evolve in general as expected (see Appendix B: figures 12b, 13).
Normalized heat transport  $ {\textit {Nu}}/ {\textit {Nu}}_0$ mapped onto the ratio of thermal and kinetic boundary layers $\lambda _\varTheta /\lambda _u$ for various $\varGamma ^{-1}$ at $ {\textit {Ra}}=7\times 10^{8}$: (b) for $\varGamma ^{-1}_{2VM}=5$, where the double-vortex maximum is observed, (a) for less confinement $\varGamma ^{-1}<\varGamma ^{-1}_{2VM}$, i.e. wider cylinders than in (b), (c) for more confinement $\varGamma ^{-1}>\varGamma ^{-1}_{2VM}$, i.e. more slender cylinders than in (b). (d–f) Same data as in (a–c), respectively, but symbols coloured in their corresponding regime of prominent flow motion (figure 1b): grey – buoyancy-dominated regime, blue – rotation-controlled regime, green – rotation-controlled with double-vortex flow (figure 3a), red – rotation-controlled with single-vortex flow (figure 4a). The vertical grey line marks the most beneficial boundary layer ratio $\lambda _\varTheta /\lambda _u=1$. The dashed grey line (no specific scaling) serves as guide for the eye. The coloured and grey lines connecting the data points in (a–c) and (d–f), respectively, follow increasing rotation $ {\textit {Ro}}^{-1}$ per confinement $\varGamma ^{-1}$.

The sharp onsets for  $\varGamma ^{-1}\geqslant \varGamma ^{-1}_{2VM}$ result from a shifted transition from the buoyancy-dominated to the rotation-controlled regime. In less confined domains ( ${\varGamma ^{-1}<\varGamma ^{-1}_{2VM}}$), the rotation-controlled regime already begins at $\lambda _{\varTheta }/\lambda _u\ll 1$ and thus the efficiency of Ekman pumping can symmetrically increase and decrease around $\lambda _{\varTheta }/\lambda _u=1$ (figure 5d; blue symbols). However, as long as the flow is buoyancy-dominated, no vortical structure can profit from Ekman pumping to enhance the heat transport, even for a beneficial ratio $\lambda _\varTheta /\lambda _u\approx 1$ (figure 5e,f; grey symbols). When the rotation-controlled regime begins at $\lambda _\varTheta /\lambda _u\geqslant 1$, Ekman pumping is immediately most effective, resulting in a sharp increase of the heat transport, which afterwards decreases again with further increase of $\lambda _\varTheta /\lambda _u$ (figure 5b,c). Heat transport enhancement does still exist even when the rotation-controlled regime begins at $\lambda _{\varTheta }/\lambda _u\gg 1$, but may not suffice to exceed the reference heat transport $ {\textit {Nu}}_0$ (figure 5c,f; $\varGamma ^{-1}=10$). These observations show that Ekman pumping is the essentially required mechanism for heat transport enhancement, and that the combination with a boundary layer ratio $\lambda _\varTheta /\lambda _u\approx 1$ is the beneficial condition.
Ekman pumping is always present in all rotating (sub-)regimes (figure 1b; blue, green, red areas). However, its net contribution to heat transport enhancement depends on the boundary layer ratio  $\lambda _\varTheta /\lambda _u\approx 1$, which determines the efficiency of heat injection into the Ekman vortices (Stevens et al. Reference Stevens, Clercx and Lohse2010b). With increasing rotation vertical (heat) transport is suppressed, which leads to a thicker thermal boundary layer and hence a larger ratio $\lambda _\varTheta /\lambda _u$. Accordingly, the envelope of the normalized heat transport among all $\varGamma ^{-1}$ decreases with increasing boundary layer ratio for $\lambda _{\varTheta }/\lambda _u>1$ (figure 5). Another way to grasp this limiting effect is the intrinsic relation of $ {\textit {Nu}}/ {\textit {Nu}}_0$ and $\lambda _{\varTheta }/\lambda _u$ via the thermal shortcut. However, for the same boundary layer ratio $\lambda _\varTheta /\lambda _u$, i.e. for the same efficiency for heat being injected into the Ekman vortices, the heat transport is mostly largest whenever a stable, domain-spanning flow structure (single vortex or double vortex) is formed (figure 5d–f; green and red vs blue symbols). Moreover, single-vortex flow is less efficient than double-vortex flow for $ {\textit {Ra}}=7\times 10^{8}$ (figure 5e,f; green vs red symbols). Taken together, the heat transport with double-vortex or single-vortex flow clusters above the heat transport without a specific vortex structure, but within all regimes the heat transport decreases with increasing $\lambda _\varTheta /\lambda _u>1$. This nicely depicts the superposing impacts of the boundary layer ratio and a stable, domain-spanning flow formation (figure 5d–f).
In summary, we identified two effects that affect the efficiency of Ekman pumping in the rotation-controlled regime. Both effects can be characterized differently. First, the boundary layer ratio  $\lambda _\varTheta /\lambda _u$ determines how effective heat is injected from the boundary layer into the bulk. Therefore, we refer to it as a heat injection effect. Second, certain combinations of confinement $\varGamma ^{-1}$ and rotation $ {\textit {Ro}}^{-1}$ lead to stable and vertically domain-spanning flow structures, which increase the efficiency of heat transported through the bulk. It is, therefore, a bulk transport effect. Several sub-regimes of stable, domain-spanning flow, which interfere with the effectiveness of the boundary layer ratio, result in the multiple maxima of heat transport under rotation and confinement.
5. Dependence on the Rayleigh number
We will now demonstrate how the three heat transport maxima (§ 3) depend on  $ {\textit {Ra}}$. Therefore, we explore the $( {\textit {Ro}}^{-1},\varGamma ^{-1})$ parameter space at four values of $ {\textit {Ra}}=2\times 10^{8}$, $7\times 10^{8}$, $2.3\times 10^{9}$ and $7\times 10^{9}$ (figure 6). For each $ {\textit {Ra}}$ we can identify the different regimes of flow motion with their associated heat transport maxima (confinement, double vortex and single vortex). The confinement maximum is clearly present for all $ {\textit {Ra}}$, and always disappears when rotation is added (figure 6). The magnitude of heat transport enhancement increases with increasing $ {\textit {Ra}}$ (figure 7a), and shifts towards stronger confinement (figure 7c) as also observed by Chong et al. (Reference Chong, Huang, Kaczorowski and Xia2015) and Hartmann et al. (Reference Hartmann, Chong, Stevens, Verzicco and Lohse2021).
Heat transport (a,c,e,g) and regimes of prominent flow motion (b,d,f,h) in the parameter space of rotation rate  $ {\textit {Ro}}^{-1}$ and cylinder confinement $\varGamma ^{-1}$ at four $ {\textit {Ra}}$. A, B and C mark the position of the confinement (§ 3.1), double-vortex (§ 3.2) and single-vortex maxima (§ 3.3), respectively. Grey, green and red lines show the transitions between the (sub-)regimes of prominent flow motion. The grey area depicts the buoyancy-dominated regime ( $\textit {Re}_z>\textit {Re}_H$). The coloured areas belong to the rotation-controlled regime ( $\textit {Re}_H>\textit {Re}_z$). In the green and red sub-regimes the characteristic flow motion indicates the double-vortex and single-vortex flow, respectively. The symbol colour always shows the heat transport $ {\textit {Nu}}/ {\textit {Nu}}_0$. $ {\textit {Nu}}_0$ is the heat transport of the non-rotating $\varGamma ^{-1}=1$ case at each $ {\textit {Ra}}$. See also figure 1(a,b) for detailed description.

(a) Normalized heat transport  $ {\textit {Nu}}_{{max}}/ {\textit {Nu}}_0$ of the three maxima as a function of $ {\textit {Ra}}$. Here, $ {\textit {Nu}}_0$ is the heat transport of the non-rotating $\varGamma ^{-1}=1$ case at each $ {\textit {Ra}}$. (b) Rotation rate $ {\textit {Ro}}^{-1}_{opt}$ of the double-vortex and single-vortex maxima as a function of $ {\textit {Ra}}$. (c) Confinement parameter $\varGamma ^{-1}_{opt}$ of the three maxima as a function of $ {\textit {Ra}}$.

The double-vortex maximum is present at all four  $ {\textit {Ra}}$, but with a sharp drop of its enhancement efficiency between $ {\textit {Ra}}=7\times 10^{8}$ and $ {\textit {Ra}}=2.3\times 10^{9}$. For the lower $ {\textit {Ra}}=2\times 10^{8},7\times 10^{8}$, the double-vortex maximum achieves the largest enhancements within this study by up to $50\;\%$, whereas the enhancement drops to less than $20\;\%$ for larger $ {\textit {Ra}}=2.3\times 10^{9},7\times 10^{9}$, which is even below the heat transport of the confinement maximum that then becomes the most efficient (figure 7a). Although the magnitude of heat transport enhancement decreases, the region of enhanced heat transport around the double-vortex maximum (where $ {\textit {Nu}}> {\textit {Nu}}_0$) enlarges significantly with increasing $ {\textit {Ra}}$. Most prominently the enhancement region enlarges towards larger $ {\textit {Ro}}^{-1}$ and $\varGamma ^{-1}$, concurrent with the shift of the associated flow regimes (figure 6). This entire behaviour of the heat transport enhancement can be explained by an interference of the two enhancing effects, beneficial boundary layer ratio and stable vortex formation.
To illustrate this interference that explains the above behaviour (figures 6, 7a), we show again the heat transport mapped onto the boundary layer ratio (as in figure 5), but now for selected confinement parameters  $\varGamma ^{-1}$ among all four $ {\textit {Ra}}$ values (figure 8). Note that, in this plot, we assign each combination of $\varGamma ^{-1}$ and $ {\textit {Ra}}$ relative to its associated optimal confinement of the double-vortex maximum $\varGamma ^{-1}_{2VM}( {\textit {Ra}})$, i.e. $\varGamma ^{-1}=6>\varGamma ^{-1}_{2VM}( {\textit {Ra}}=2\times 10^{8})=4$ (figure 8c), but $\varGamma ^{-1}=6<\varGamma ^{-1}_{2VM}(7\times 10^{9})=8$ (figure 8a). The strong enhancement at lower $ {\textit {Ra}}$ results from the coincidence that, around the most beneficial boundary layer ratio $\lambda _\varTheta /\lambda _u\approx 1$, the flow (i) experiences Ekman pumping, and (ii) forms a stable double-vortex structure (figures 8b,e and 8a,d). Consequently, both enhancing effects interfere most efficiently, but also most locally around $\lambda _\varTheta /\lambda _u=1$ and in the $( {\textit {Ro}}^{-1},\varGamma ^{-1})$ parameter space. On the other hand, at larger $ {\textit {Ra}}$, the rotation-controlled regime begins only at $\lambda _\varTheta /\lambda _u\gtrsim 1$, which already reduces the largest achievable efficiency of Ekman pumping. Moreover, double-vortex flow is only formed at larger $\lambda _\varTheta /\lambda _u$, and thus it co-occurs only with a weak efficiency from the boundary layer ratio. Hence, the double-vortex maximum forms, where the interference of both effects is still the largest, but not as ideal as at lower $ {\textit {Ra}}$. As a consequence, double-vortex flow at its maximum is less stable at larger $ {\textit {Ra}}$ than at lower $ {\textit {Ra}}$ (figure 9). Still, whenever double-vortex flow can be identified, the heat transport is temporary strongly enhanced (figure 9; shaded areas). In brief, the shift of the double-vortex flow regime away from $\lambda _\varTheta /\lambda _u\approx 1$ for larger $ {\textit {Ra}}$ reduces the interference of the two enhancing effects, and therefore enlarges the region of heat transport enhancement while flattening the double-vortex maximum.
Normalized heat transport  $ {\textit {Nu}}/ {\textit {Nu}}_0$ mapped onto the ratio of thermal and kinetic boundary layers $\lambda _\varTheta /\lambda _u$ for various combinations of $\varGamma ^{-1}$ and $ {\textit {Ra}}$: (b) for $\varGamma ^{-1}_{2VM}( {\textit {Ra}})$, where the double-vortex maximum is observed at each value of $ {\textit {Ra}}$, (a) for less confinement $\varGamma ^{-1}<\varGamma ^{-1}_{2VM}( {\textit {Ra}})$, i.e. wider cylinders than in (b), (c) for more confinement $\varGamma ^{-1}>\varGamma ^{-1}_{2VM}( {\textit {Ra}})$, i.e. more slender cylinders than in (b). (d–f) Same data as in (a–c), respectively, but symbols coloured in their corresponding regime of prominent flow motion (figure 6): grey – buoyancy-dominated regime, blue – rotation-controlled regime, green – rotation-controlled with double-vortex flow, red – rotation-controlled with single-vortex flow. The vertical grey line marks the most beneficial boundary layer ratio $\lambda _\varTheta /\lambda _u=1$. The dashed grey line (no specific scaling) serves as guide for the eye. The coloured and grey lines connecting the data points in (a–c) and (d–f), respectively, follow increasing rotation $ {\textit {Ro}}^{-1}$ per confinement $\varGamma ^{-1}$.

Flow characteristics at the double-vortex maximum at  $ {\textit {Ra}}=2\times 10^{8}$ and $ {\textit {Ra}}=2.3\times 10^{9}$: (a) temporal evolution of $ {\textit {Nu}}(t)$ at the top and bottom plates, (b) temporal evolution of $\textit {Re}(t)$ for each velocity component. The shaded areas indicate when double-vortex flow (as in figure 3a) is observed.

For very large  $ {\textit {Ra}}$, this shift could result in a segregation of the double-vortex maximum into two separate maxima, one originating from the most effective boundary layer ratio $\lambda _\varTheta /\lambda _u\approx 1$, and another from stable double-vortex flow. Some evidence for such a splitting might be visible in our data for $ {\textit {Ra}}=7\times 10^{9}$ (figure 6g,h). This would be analogue to the separation of the single-vortex maximum from the double-vortex maximum with increasing $ {\textit {Ra}}$ (figure 6). To verify this hypothesis, either a much finer sampling in $ {\textit {Ro}}^{-1}$ and $\varGamma ^{-1}$ or another set at a larger $ {\textit {Ra}}$ is necessary, which both are beyond the computational resources of this study.
The single-vortex maximum emerges with increasing  $ {\textit {Ra}}$ (figure 6). The regime of single-vortex flow is still very limited for $ {\textit {Ra}}=2\times 10^{8}$ and enlarges significantly with increasing Ra. For $ {\textit {Ra}}\geqslant 7\times 10^{8}$ the sub-regime of single-vortex flow has sufficiently enlarged to form an individual maximum within our parameter sampling. Still, we can define the single-vortex maximum for $ {\textit {Ra}}=2\times 10^{8}$ based on the location of the most stable single-vortex flow at $\varGamma ^{-1}=6$, $ {\textit {Ro}}^{-1}\!\approx\! 16$ (Appendix B: figure 14c). However, it seems likely that the single-vortex flow is associated with larger $ {\textit {Ra}}$, and does not occur at very low $ {\textit {Ra}}\ll 10^{8}$. With increasing $ {\textit {Ra}}$ and an enlarging single-vortex regime the enhancement efficiency of its maximum increases up to ${\approx }20\,\%$, which is comparable to the double-vortex maximum at the larger $ {\textit {Ra}}$ (figure 7a). Independent of $ {\textit {Ra}}$, the single-vortex flow is limited to relatively strong confinement $\varGamma ^{-1}>\varGamma ^{-1}_{2VM}$, and occurs only for $\lambda _\varTheta /\lambda _u\!>\!1$ directly after the transition to the rotation-controlled regime (figure 8c,f). As shown before (§ 3.3, Appendix B: figure 11), this transition occurs gradually with extending periods in which the flow stays in a stable single-vortex state. Both double-vortex and single-vortex maxima shift towards faster rotation and stronger confinement for increasing $ {\textit {Ra}}$ (figure 7b,c). Presumably, the locations of the maxima follow some effective scaling laws, but due to the large uncertainty we refrain from giving estimates for the scaling exponents.
The general trend of heat transport enhancement in wider vs slender cylinders, as already observed for  $ {\textit {Ra}}=7\times 10^{8}$ (§ 4, figure 5), is present among all four $ {\textit {Ra}}$ (figure 8a–c): in wider cylinders ( $\varGamma ^{-1}<\varGamma ^{-1}_{2VM}( {\textit {Ra}}$)), the rotation-controlled regime (blue symbols) begins at $\lambda _\varTheta /\lambda _u\ll 1$, and we observe a nearly symmetric heat transport enhancement around $\lambda _{\varTheta }/\lambda _u=1$ (figure 8a,d). For $\varGamma ^{-1}_{2VM}( {\textit {Ra}})$, the onset of heat transport enhancement occurs at $\lambda _{\varTheta }/\lambda _u\approx 1$ and can be rather steep because the flow can immediately form a double-vortex structure as observed for lower $ {\textit {Ra}}$ (figure 8b,e). In slender cylinders ( $\varGamma ^{-1}>\varGamma ^{-1}_{2VM}( {\textit {Ra}}$)), the heat transport enhancement always shows a sharp onset at $\lambda _{\varTheta }/\lambda _u>1$, which corresponds to an immediate transition from buoyancy-dominated regime to rotation-controlled regime with single-vortex flow (figure 8c,f). This representation of our data nicely depicts a $ {\textit {Ra}}$-independent clustering of the heat transport within the different flow regimes (figure 8d–f).
Collapsing all data into one frame emphasizes even better a sheet-like clustering (figure 10), which nicely illustrates the superposing character of both enhancing effects. In the buoyancy-dominated regime (grey symbols), no heat transport enhancement by rotation is observed among all combinations of  $\varGamma ^{-1}$, $ {\textit {Ro}}^{-1}$ and $ {\textit {Ra}}$, and all enhancement is related to the confinement maximum, which collapses at $\lambda _{\varTheta }/\lambda _u\approx 0.6$ for all $ {\textit {Ra}}$ (see also § 4). Only when the azimuthal motion becomes predominant does Ekman pumping set in and enhance the heat transport (blue symbols). Thereby, the net enhancement and the resulting heat transport depend on the actual ratio between the kinetic and thermal boundary layer thicknesses. When additionally a double-vortex or single-vortex flow is present, the heat transport is further increased (green and red symbols) above the cases when only Ekman pumping is present. Thereby, single-vortex flow seems to be very limited to a much smaller interval of $\lambda _{\varTheta }/\lambda _u$ than double-vortex flow. Whether Ekman pumping is active, and whether a (stable) domain-spanning flow is formed in addition depends on the combination of $ {\textit {Ra}}$, $\varGamma ^{-1}$, $ {\textit {Ro}}^{-1}$ and likely $\textit {Pr}$ that was not varied in this study. In other words: although a $ {\textit {Ra}}$-independent clustering is observed, several parameter values (e.g. larger $ {\textit {Ra}}$) can inhibit the best interference of a beneficial boundary layer ratio and a stable vortex flow, such that the largest potential heat transport enhancement is not achievable.
Clustering of the heat transport  $ {\textit {Nu}}/ {\textit {Nu}}_0$ mapped onto the ratio of thermal and kinetic boundary layers $\lambda _\varTheta /\lambda _u$ for all combinations of $ {\textit {Ro}}^{-1}$, $\varGamma ^{-1}$ and $ {\textit {Ra}}$. The data are coloured in the corresponding regimes of flow motion (figure 6): grey – without Ekman pumping, blue – with Ekman pumping, green and red – Ekman pumping and double-vortex or single-vortex flow. The vertical grey line marks the most beneficial boundary layer ratio $\lambda _\varTheta /\lambda _u=1$. The dashed grey line (no specific scaling) serves as guide for the eye. The grey lines connecting the data points follow increasing rotation $ {\textit {Ro}}^{-1}$ per confinement $\varGamma ^{-1}$.

For all  $ {\textit {Ra}}$, the onset of heat transport enhancement is nicely described by the transition of predominant fluid motion from vertical to horizontal $\textit {Re}_z=\textit {Re}_H$ (figures 6, 8). This transition and the onset of heat transport enhancement clearly depend on $ {\textit {Ra}}$, in contrast to describing the onset by a $ {\textit {Ra}}$-independent Ginzburg–Landau model (Weiss et al. Reference Weiss, Stevens, Zhong, Clercx, Lohse and Ahlers2010; Weiss & Ahlers Reference Weiss and Ahlers2011a,Reference Weiss and Ahlersb). Nonetheless, a $ {\textit {Ra}}$-dependence in very confined systems seems meaningful regarding that the formation of horizontally dominated, vortical flow requires a sufficiently wide domain, larger than the most unstable convective length scale $L_c\propto {\textit {Ek}}^{1/3}\propto {\textit {Ra}}^{1/6}$. However, the $ {\textit {Ra}}$-dependence appears to be rather complex so that its complete derivation is beyond the scope of this study.
6. Conclusions
We have performed DNSs of confined-rotating RBC. For fixed  $ {\textit {Ra}}$ and $\textit {Pr}$, we identified three distinct maxima in the parameter space of rotation $ {\textit {Ro}}^{-1}$ and confinement $\varGamma ^{-1}$: a confinement, a double-vortex and a single-vortex maximum. Each maximum can be linked to a regime with an individual characteristic domain-spanning flow structure. We find that the heat transport enhancement of these maxima can be explained by an interference of two effects:
(i) Heat injection: in the rotation-controlled regime of predominant vortical (horizontal) fluid motion and Ekman pumping, a beneficial ratio of thermal and kinetic boundary layer thicknesses $\lambda _\varTheta /\lambda _u\approx 1$ leads to the most effective heat transport from the boundary layer into the bulk.
(ii) Bulk transport: certain combinations of rotation
$ {\textit {Ro}}^{-1}$, confinement $\varGamma ^{-1}$ and thermal driving $ {\textit {Ra}}$ trigger a stable domain-spanning flow formation, which supports effective heat transport through the bulk.


The interference of both enhancing effects in the  $( {\textit {Ro}}^{-1},\varGamma ^{-1})$ parameter space can result in one strong heat transport maximum, or cause a broad region of enhanced heat transport with multiple maxima. At lower $ {\textit {Ra}}\lesssim 2\times 10^{9}$, a strong interference of both effects results in a larger heat transport enhancement for combined rotation and confinement than only confinement or only rotation could achieve. Contrary, at larger $ {\textit {Ra}}\gtrsim 2\times 10^{9}$, where the interference is weak, pure confinement achieves the largest heat transport enhancement. Additionally, we have shown that the heat transport in strongly confined-rotating RBC does not automatically benefit from the optimal ratio of boundary layer thicknesses $\lambda _\varTheta /\lambda _u\approx 1$, as it does not necessarily coincide with the presence of Ekman pumping, which is required for the enhancement.
Further investigations should aim to understand the occurrence of the different regimes of stable vortex formation for the various values of control parameters  $\varGamma ^{-1}$, $ {\textit {Ro}}^{-1}$, $ {\textit {Ra}}$ and $\textit {Pr}$, e.g. those for conditions in potential technical applications. Especially, understanding the onset of heat transport enhancement and the transition from buoyancy-dominated to rotation-controlled regime $ {\textit {Ro}}^{-1}_{{BD\text {-}RC}}(\varGamma ^{-1}, {\textit {Ra}},\textit {Pr})$ promises further fundamental insights into the interplay of confinement and rotation. A better understanding of the general interaction of different types of stabilization remains important in various scientific fields such as geo- or astrophysics. This requires comparable studies on other combinations of interacting types of stabilization, e.g. rotating double-diffusive convection, confined double-diffusive convection or rotating magnetohydrodynamics.
Acknowledgements
We acknowledge the access to several computational resources, all of which were used for this work: PRACE for awarding us access to MareNostrum 4 based in Spain at the Barcelona Computing Center (BSC) under projects 2018194742 and 2020225335, the national e-infrastructure of SURFsara, a subsidiary of SURF cooperation, the collaborative ICT organization for Dutch education and research and NWO Science for the use of supercomputer facilities.
Funding
This work was funded by the ERC Starting Grant UltimateRB no. 804283.
Declaration of interests
The authors report no conflict of interest.
Data availability statement
The data that support the findings of this study are openly available in 4TU.ResearchData at http://doi.org/10.4121/16974109.
Appendix A. Overview numerical simulations
Table 1 summarizes the most relevant details of the conducted numerical simulations.
Summary of numerical parameters per set of simulations (varying  $ {\textit {Ro}}^{-1}$). Columns from left to right: confinement $\varGamma ^{-1}$, number of grid points in the vertical, radial, azimuthal directions $N_z$, $N_r$, $N_\vartheta$, number of simulations $M_{Ro}$ per set, range of $ {\textit {Ro}}^{-1}$ per set, largest Nusselt number $ {\textit {Nu}}_{max}$ within each set, minimal number of points within the boundary layer $N_{BL,min}$ based on the estimate $\lambda _\varTheta =1/(2 {\textit {Nu}}_{max})$, coarsest resolution of the Kolmogorov scales $\eta$ in the bulk $(\Delta z/\eta )_{mid}$, coarsest resolution of the Kolmogorov scales $\eta$ in the boundary layers $(\Delta z/\eta )_{BL}$, averaging time interval $\Delta t_{avg}$ in units of free-fall time (multiple values denote minimum and maximum value), maximal Courant number CFL $_{max}$ and maximal time step $\Delta t_{max}$ in units of free-fall time, both controlling the dynamic time stepping.

Appendix B. Supporting figures
Figure 11 shows the two (temporary) stable configurations of single-vortex flow in the vicinity around the stable single-vortex maximum. Figure 12 justifies that, for confined-rotating RBC, the change of predominant direction of flow motion from vertical to horizontal characterizes the onset of heat transport enhancement better than the transition of the kinetic boundary layer from Prandtl–Blasius to Ekman type. We note that in this context any Ekman pumping related increase of  $ {\textit {Nu}}$ with $ {\textit {Ro}}^{-1}$ is seen as heat transport enhancement independent of whether $ {\textit {Nu}}/ {\textit {Nu}}_0>1$ or not. Figure 13 shows how kinetic and thermal boundary layer thicknesses evolve individually in the $( {\textit {Ro}}^{-1},\varGamma ^{-1})$ parameter space. The kinetic boundary layer thickness $\lambda _u$ is estimated as twice the height of the peak location of the horizontally averaged quantity $\left \langle \boldsymbol {u}\boldsymbol {\cdot }\nabla ^{2}\boldsymbol {u}\right \rangle _H$. The thermal boundary layer thickness $\lambda _{\varTheta }$ is defined as the intersection between the temperature gradient at the plate with a linear fit to the horizontally averaged mean temperature profile in the bulk, see also § 2. Figure 14 gives an overview on the additional flow characteristics (as in figure 1c–e for $ {\textit {Ra}}=7\times 10^{8}$) for all four $ {\textit {Ra}}$ numbers.
Configurations of single-vortex flow ( $ {\textit {Ra}}=7\times 10^{9}$, $\varGamma ^{-1}=12$, $ {\textit {Ro}}^{-1}=25$): (a) snapshot of the temperature field at $t=400$ with a hot centred vortex, (d) snapshot of the temperature field at $t=2400$ with a cold centred vortex, (b) temporal evolution of $ {\textit {Nu}}(t)$ at the top and bottom plates, (c) temporal evolution of $\textit {Re}(t)$ for each velocity component. The vertical dashed and dotted lines indicate the times of the temperature snapshots in (a,d), respectively.

Onset of heat transport enhancement at  $ {\textit {Ra}}=7\times 10^{8}$, $\textit {Pr}=4.38$: (a) normalized heat transport $ {\textit {Nu}}/ {\textit {Nu}}_0$ for various $\varGamma ^{-1}$, (b) kinetic boundary layer thickness $\lambda _u/H$, the dashed grey line indicates Ekman type scaling $\lambda _u\propto 2.284 ((\textit {Pr}/ {\textit {Ra}})^{1/2}{Ro})^{-1/2}$ (see Rajaei et al. Reference Rajaei, Joshi, Alards, Kunnen, Toschi and Clercx2016a), (c) ratio of vertical and horizontal Reynolds number $\textit {Re}_z/\textit {Re}_H$. The dashed grey line separates the regimes of predominant vertical ( $\textit {Re}_z/\textit {Re}_H>1$) and horizontal motion ( $\textit {Re}_z/\textit {Re}_H<1$). The vertical dotted lines indicate when $\textit {Re}_z/\textit {Re}_H=1$ for each $\varGamma ^{-1}$. In comparison this corresponds better with the onset of Ekman pumping enhanced heat transport (a) than the transition of the kinetic boundary layer from Prandtl–Blasius to Ekman type (b).

Boundary layer thicknesses in the  $( {\textit {Ro}}^{-1},\varGamma ^{-1})$ parameter space for (a,b) $ {\textit {Ra}}=2\times 10^{8}$, (c,d) $ {\textit {Ra}}=7\times 10^{8}$, (e,f) $ {\textit {Ra}}=2.3\times 10^{9}$, (g–h) $ {\textit {Ra}}=7\times 10^{9}$. (a,c,e,g) Kinetic boundary layer thickness $\lambda _u/H$. (b,d,f,h) Thermal boundary layer thickness $\lambda _\varTheta /H$. Each colour scale applies to both panels per $ {\textit {Ra}}$. The grey, green and red lines and highlighted locations A, B, C mark the regime transitions and heat transport maxima as in figure 6.

Additional flow characteristics for (a–c)  $ {\textit {Ra}}=2\times 10^{8}$, (d–f) $ {\textit {Ra}}=7\times 10^{8}$, (g–i) $ {\textit {Ra}}=2.3\times 10^{9}$, (j–l) $ {\textit {Ra}}=7\times 10^{9}$. (a,d,g,j) Vertical temperature gradient in the bulk. (b,e,h,k) Temporal stability of the flow based on $ {\textit {Nu}}_{rms}$ (2.5). (c,f,i,l) Ratio of azimuthal to radial Reynolds numbers $\textit {Re}_{\vartheta }/\textit {Re}_r$. See figure 1(c–e) for detailed description.


 Open access