

During the American Dust Bowl of the 1930s, Plains counties experienced substantial erosion that reduced agricultural land values in more-eroded counties, relative to less-eroded counties, and led to relative declines in population through the 1950s (Hornbeck Reference Hornbeck2012). During the 1930s, amidst the Great Depression, the notable experiences of migrants to California became associated with those of “Dust Bowl migrants” and they came to represent a breakdown of the American economy.
Dust Bowl migrants became an archetype: refugees displaced by environmental collapse. This lasting impression of Dust Bowl migrants was established, and remains prominent, largely through artistic works: John Steinbeck’s novel “The Grapes of Wrath” and its film; Dorothea Lange’s photography, including “Migrant Mother, Nipomo, California;” and Woody Guthrie’s “Dust Bowl ballads.” Quantitative efforts to examine the Dust Bowl migrants have included contemporaneous surveys of migrant families in California (Janow and McEntire Reference Janow and McEntire1940) and subsequent analysis of regional migrants in Census data samples (Gregory Reference Gregory1989; Long and Siu Reference Long and Siu2018). A substantial empirical challenge is that “Dust Bowl migrants,” or those induced to move by the Dust Bowl itself, are difficult to identify separately from other migrants in the 1930s who were induced to move by the Great Depression, New Deal policies, agricultural mechanization, broader drought, and other factors (Bogue and Hagood 1953; Fishback, Horrace, and Kantor Reference Fishback, Horrace and Kantor2006; Boustan, Fishback, and Kantor Reference Boustan, Fishback and Kantor2010; Gutmann et al. Reference Gutmann, Daniel Brown, Cunningham, Susan Hautaniemi Leonard, Jeremy Mikecz, Rhode and Sylvester2016; Sichko Reference Sichko2021). Understanding who these Dust Bowl migrants were, and how they differed from other migrants in the 1930s, is important to understand this archetypal “environmental refugee” and clarify how migration responded to this environmental collapse. Further, by following both migrants and non-migrants, my analysis can move beyond identifying impacts of the Dust Bowl on more-eroded counties (Hornbeck Reference Hornbeck2012) and identify impacts of the Dust Bowl on people from more-eroded counties.
This paper examines the Dust Bowl migration, estimating how the intensity of county-level erosion influenced migration rates and the characteristics of those who migrated. The paper identifies these archetypal “Dust Bowl migrants” and how they differed from other migrants. The analysis uses the full 1940 U.S. Census, which asked people their 1935 county of residence, in comparing migrants to non-migrants in their 1935 county (out-selection) and comparing migrants to natives in their 1940 county (in-selection). These data also allow for the first assessment of how the Dust Bowl impacted wage incomes in 1939, including those who remained and those who migrated.
Migration represents a main potential channel of adaptation to local environmental destruction, and the experiences of migrants and their reception in new locations depend importantly on who migrates in response to this environmental collapse. Migrants are generally “selected” because the relative returns or costs of migration generally differ across individuals. Further, when people can plan for future migration, they may invest more in education or skills that are relatively more productive in new locations. Thus, the people who migrate after unanticipated large shocks may differ from those who migrate in typical circumstances. Environmental shocks may also generate different migration responses than other economic shocks, and permanent environmental changes may generate different migration responses than temporary environmental disasters. The Dust Bowl migrants are of particular historical interest, as they have become an archetype of environmental refugees, and the Dust Bowl migrants represent a rare opportunity to explore migration responses to a permanent and unanticipated collapse in the local environment.
My empirical analysis compares migrants from more-eroded counties to migrants from less-eroded counties within the same state and with similar pre-1930s characteristics, extending the empirical specification from Hornbeck (Reference Hornbeck2012). I measure migration using individuals’ reported county of residence in 1935 and 1940, rather than matching individuals across censuses, which reduces the potential for spurious migration and includes women in the data. This period of analysis (1935 to 1940) coincides with the core Dust Bowl migration period, though there may have been some additional migration in the early 1930s and after 1940. The empirical analysis cannot identify particular individuals as “Dust Bowl migrants,” but my analysis identifies how, on average, the Dust Bowl induced different migrants.
I estimate that migration rates were higher from more-eroded counties than from less-eroded counties. Overall, 7 percent of 1935 Plains residents had, by 1940, moved to a county more than 200 miles away. This migration rate was 2.6 percentage points higher from high-erosion counties and 1.4 percentage points higher from medium-erosion counties, relative to low-erosion counties within the same state and with similar pre-1930s characteristics. Diverted in-migration also contributed to relative population declines in more-eroded counties, though this effect is statistically insignificant and smaller in magnitude than the increase in out-migration.
Migrants from more-eroded counties moved further and moved to more geographically scattered destinations, as compared to more geographically clustered destinations of migrants from less-eroded counties. These migration patterns suggest an atypical, and perhaps less-planned, migration response to local environmental collapse.
Migration to California was not the typical response (1.65 percent of 1935 Plains residents), but this migration rate to California was 0.69 percentage points higher from high-erosion counties and 0.50 percentage points higher from medium-erosion counties. I also estimate elevated migration to the Pacific Northwest (Washington, Oregon, Idaho), though the experiences of migrants to California have been more central in popular narratives surrounding Dust Bowl migrants.
Migrants from more-eroded counties were more “negatively selected,” in years of education, than other migrants who were generally “positively selected.” That is, while migrants generally had more years of education than those who remained in their 1935 counties, this was less true of migrants from more-eroded counties. Further, when focusing only on “Dust Bowl migrants,” or only those additional migrants induced to move by higher erosion, they had fewer years of education than non-migrants. Along other characteristics, migrants generally were younger, more likely to be male, and less likely to have lived on a farm in 1935; and along these characteristics, Dust Bowl migrants were similar to general migrants. Migrants from more-eroded counties were slightly more likely than other migrants to have lived on a farm in 1935, though the Dust Bowl migrants’ popular reputation for being agricultural was more shaped by differences from natives in their new destinations.
Migrants from more-eroded counties had lower wage incomes in 1939, compared to natives in their new destinations, than migrants from less-eroded counties. Further, migrants from all Plains counties had substantially lower incomes than natives in California. These patterns appear to have driven popular impressions of the Dust Bowl migrants, often influenced by experiences in California migrant camps.
I estimate strikingly modest impacts of the Dust Bowl on 1939 incomes, however, for all 1935 residents of more-eroded counties. While agricultural land values declined substantially in more-eroded counties, with limited adaptation in local agricultural production (Hornbeck Reference Hornbeck2012), I estimate only modest differences in 1939 wage incomes between all 1935 residents of more-eroded counties and less-eroded counties. The impact on 1939 incomes is similar for migrants and non-migrants, particularly after controlling for differences in years of education. The impact on incomes is also smaller for groups that experienced greater migration responses, consistent with migration playing a key role in mitigating the impact of the Dust Bowl on people despite the large and enduring impact of the Dust Bowl on land.
Finally, I explore how the impacts of the Dust Bowl on incomes were mitigated or exacerbated by New Deal program spending. Greater agricultural adjustment administration (AAA) spending was associated with a more negative effect of the Dust Bowl on male incomes, whereas public works spending moderately mitigated the impact on male incomes. This spending had little differential impact on female incomes, and relief spending had little impact by 1939. These results are consistent with Fishback, Horrace, and Kantor (Reference Fishback, Horrace and Kantor2005) and Liu and Fishback (Reference Liu and Fishback2019), who find contrasting impacts of public works spending (which generated local manual labor demand) and AAA spending (which reduced local manual labor demand by taking agricultural land out of production). These estimates suggest how policy responses can mitigate or exacerbate the economic consequences of permanent environmental change (see also Balboni Reference Balboni2021).
The Dust Bowl provides a rare opportunity to explore migration responses to a permanent collapse in the local environment, in contrast to more exploration of migration responses to more temporary natural disasters and weather shocks (Piguet, Pécoud, and de Guchteneire Reference Piguet, Pécoud and de Guchteneire2011; Boustan, Kahn, and Rhode Reference Boustan, Kahn and Rhode2012; Marchiori, Maystadt, and Schumacher Reference Marchiori, Maystadt and Schumacher2012; Bohra-Mishra, Oppenheimer, and Hsiang Reference Bohra-Mishra, Oppenheimer and Hsiang2014; Cai et al. Reference Cai, Feng, Oppenheimer and Pytlikova2016; Deryugina Reference Deryugina2017; Deryugina, Kawano, and Levitt Reference Deryugina, Kawano and Levitt2018; Boustan et al. Reference Boustan, Kahn, Rhode and Lucia Yanguas2019; Deryugina and Molitor Reference Deryugina and Molitor2020; Mahajan and Yang Reference Mahajan and Yang2020; Spitzer, Tortorici, and Zimran Reference Spitzer, Tortorici and Zimran2020; Sichko Reference Sichko2021).Footnote 1 The migration literature has long considered how migrant selection varies across contexts (Roy Reference Roy1951; Borjas Reference Borjas1987), and characterizing the Dust Bowl migrants and their experiences provides an opportunity to refine the archetype of environmental refugee. Indeed, future changes in climate are expected to generate substantial migrant flows (Stern Reference Stern2007), which may have an important role in mitigating the economic costs of climate change (Desmet and Rossi-Hansberg Reference Desmet and Rossi-Hansberg2015), but these migration responses to environmental collapse may differ from typical migration flows. The Dust Bowl period highlights how a permanent collapse of the local environment generated less “positively-selected” migrants, who went to different destinations and had lower incomes than natives in their destinations. This substantial migration response was ultimately associated with little impact of environmental collapse on people’s incomes, however, which is in contrast to the large and enduring impacts on land’s value.
In focusing on migration from environmental collapse, this episode also complements our understanding of how the United States has been influenced by large-scale migration, such as the Great Migration of African Americans to the Northern United States (Collins and Wanamaker Reference Collins and Wanamaker2014, Reference Collins and Wanamaker2015) and mass migration to the United States (Abramitzky, Boustan, and Eriksson 2012; Abramitzky and Boustan 2017). Who migrates, and how they differ from natives in their new destinations, influences how migrants are received and what impacts migrants have in those destinations (Boustan Reference Boustan2009, Reference Boustan2010; Boustan, Fishback, and Kantor Reference Boustan, Fishback and Kantor2010; Derenoncourt Reference Derenoncourt2022).
HISTORICAL CONTEXT
Amidst economic turmoil in the 1930s, the United States’ Plains experienced widespread severe erosion in what became known as the Dust Bowl. Especially severe droughts in 1934 and 1936, and loss of ground cover, made topsoil susceptible to large dust storms (e.g., “Black Sunday” in 1935) and substantial water erosion during occasional rains. There was uncertainty concerning future regional weather, but local erosion was immediately clear: agricultural land values declined substantially by 1940, in more-eroded counties relative to less-eroded counties, and remained lower with limited adaptation in local agricultural production (Hornbeck Reference Hornbeck2012).
The Dust Bowl became associated with imagery of displaced farmers migrating to California, which potentially reflects the combined experiences of the Dust Bowl, the Depression, and displacement by mechanization. In 1939, a survey of migrant families in California highlighted this migration from Oklahoma (Janow and McEntire Reference Janow and McEntire1940), with peak arrival years in 1936 and 1937. Migrants became derogatorily referred to as “Okies,” though there was also substantial migration from Arkansas (“Arkies”) and other non-Plains areas, which suggests these regional migration patterns also reflected factors other than the Dust Bowl.
These migrants faced hostility and even some efforts to block their entry into California. Stein (Reference Stein1973) argues that, while California had previously received large population inflows, native Californians turned against “Okies” because they were seen as atypically poor and undesirable. Contemporaries considered many of the “lowliest settlers” in California resettlement camps to be refugees from the Dust Bowl (e.g., Cannon Reference Cannon1996, p. 102).Footnote 2
Gregory (Reference Gregory1989) uses the 1940 Census (1 percent sample) to examine migrants to California, comparing all migrants from a broad region (Oklahoma, Texas, Arkansas, Missouri) to non-migrants and how these “Southwestern” migrants compared to others in California in 1940. Gregory (Reference Gregory1989) emphasizes that migration to California had been common, drawing relatively well-off migrants, but that 1935–40 migrants from the Southwest were atypically worse-off. These migrants left for California not only due to the Dust Bowl, Stein and Gregory emphasize, but also mechanization, changing crop prices, and AAA policy.Footnote 3 The combined influences of these shocks are a challenge in characterizing “Dust Bowl migrants,” or those who migrated because of the Dust Bowl in particular.
Long and Siu (Reference Long and Siu2018) examine 4,210 individuals from 20 “Dust Bowl counties” around the Oklahoma panhandle in 1930, whom they compare to a national sample, and examine migration to California and other destinations. Many of these panhandle-region counties experienced severe wind erosion, but severe erosion was more widespread in the Plains (Hansen and Libecap Reference Hansen and Libecap2004; Hornbeck Reference Hornbeck2012) and these panhandle-region counties are outside areas of concentrated migration to California mapped by Janow and McEntire (Reference Janow and McEntire1940).
Long and Siu (Reference Long and Siu2018) emphasize several results, including: (1) farmers were least likely to move from Dust Bowl counties (but not from other counties); (2) migrants from Dust Bowl counties were not more likely to go to California; (3) population decline in Dust Bowl counties was mostly due to decreased in-migration rather than increased out-migration; (4) there was negligible selectivity of migrants from Dust Bowl counties, such as in their education and likelihood of living in their birth state (though selection in migration from elsewhere).
I estimate substantially different results along these dimensions: (1) people living on farms were less likely to migrate, in general, and weakly more likely to migrate from more-eroded counties; (2) migrants from more-eroded counties were more likely to go to California;
(3) there was diverted in-migration to more-eroded counties but a larger increase in out-migration from more-eroded counties; (4) there were notable differences among migrants from more-eroded counties, who had less education and were more likely to be living in their birth state. This selection into migration then complicates the estimation of returns to migration.
To measure migration, Long and Siu (Reference Long and Siu2018) link individuals from the 1930 Census to the 1940 Census using their name, race, age, and state of birth. False-positive matches would generate spurious migration and, indeed, 52 percent of panhandle-region residents are indicated to have moved counties. Even if matching errors occur at the same rate across places, and do not vary systematically with individuals’ characteristics, inflated migration rates from matching errors would attenuate differences in true migration rates across places and attenuate estimated differences between true migrants and non-migrants.
Identifying archetypal “Dust Bowl migrants” is about understanding who was induced to move by the Dust Bowl and requires a counterfactual for who would have otherwise migrated. The panhandle-region (analyzed in Long and Siu (Reference Long and Siu2018)) and the southwestern-region (analyzed in Gregory (Reference Gregory1989)) differed substantially from other areas of the country, in 1930 and in changes over previous decades, and may have been affected differently by the Depression, AAA policy, mechanization, and changing crop prices, among other factors. Long and Siu (Reference Long and Siu2018) emphasize that out-migration from the 1930s panhandle-region was not higher than in the 1920s, but migration declined elsewhere in the 1930s and the 1920s are not a counterfactual for the 1930s. Various 1930s shocks may also have affected areas differently based on their agricultural production and other characteristics.
My analysis draws on Dust Bowl erosion throughout the Plains, comparing migration from more-eroded counties to migration from less-eroded counties within the same states and with similar pre-1930s county characteristics. Building on the empirical specification in Hornbeck (Reference Hornbeck2012), these relative comparisons identify average differences between Dust Bowl migrants and other migrants. This helps separate what historical impressions of Dust Bowl migrants are a phenomenon of the Depression and other events of the 1930s, and in what ways this historical legacy should be attributed to the Dust Bowl itself and local environmental collapse.
Further, by observing all 1935 residents of Plains counties (migrants and non-migrants), my analysis can move beyond estimating impacts of the Dust Bowl on more-eroded land (Hornbeck Reference Hornbeck2012) to estimate impacts of the Dust Bowl on people from more-eroded places.
DATA
Figure 1 shows a map of cumulative erosion damage after the Dust Bowl (Hornbeck Reference Hornbeck2012). Dark gray areas are high-erosion (>75 percent topsoil lost), light gray areas are medium-erosion, and white areas are low-erosion (<25 percent topsoil lost). Because mapped erosion represents cumulative erosion after the Dust Bowl, rather than erosion only during the 1930s, the empirical analysis follows Hornbeck (Reference Hornbeck2012) in controlling for pre-1930s county characteristics, so residual variation in erosion reflects differential 1930s erosion.Footnote 4 This residual variation in erosion is strongly associated with 1930s declines in county-level land values and population (Hornbeck Reference Hornbeck2012).
THE 843 PLAINS COUNTIES, SHADED BY EROSION LEVEL
Notes: The mapped erosion levels are low (shaded white, less than 25 percent of topsoil lost), medium (shaded light gray, 25 to 75 percent of topsoil lost), or high (shaded dark gray, more than 75 percent of topsoil lost). Thin lines denote 1940 county borders, corresponding to 843 counties in this Plains region. Thick lines denote state boundaries. Crossed out areas are not in the Plains region. The Plains region is defined as this contiguous set of 843 counties from these 12 states (Colorado, Iowa, Kansas, Minnesota, Montana, Nebraska, New Mexico, North Dakota, Oklahoma, South Dakota, Texas, and Wyoming) that have 50 percent or more of their area in the typical central United States grassland and forest vegetation regions (Tall Grass, Short Grass, Mesquite Grass, Mesquite and Desert Grass Savanna, and Oak-Hickory Forest) as mapped by the USDA’s 1924 Atlas of Agriculture.
Source: National Archives (College Park, MD), RG 114, Cartographic Records of the Soil Conservation Service, #149.

Individual-level data are from the full 1940 Census, which includes individuals’ county of residence in 1940 and 1935. I define the migration rate in county c as the number of people who moved from county c to other counties, from 1935 to 1940, divided by the number of people in 1940 who report living in county c in 1935.
The Census data also include individuals’ age, gender, education, whether they lived on a farm in 1935, and whether they lived in their birth state in 1935. I restrict the analysis to individuals aged 25–55 in 1935, focusing on working-age individuals with completed education by 1935. This sample includes 49.4 million individuals in the contiguous United States with reported county of residence in 1940 and 1935, or 96.4 percent of individuals aged 25–55 in 1935. The excluded 3.6 percent of individuals includes those with missing 1935 location, along with those living in 1935 outside the contiguous United States.
County-level data are from the Census of Agriculture and Census of Population (Haines 2010). These data capture a variety of Plains county characteristics in 1930, 1925, 1920, and 1910: acres of farmland (1930, 1925, 1920, 1910), cropland share of farmland (1930, 1925), population per acre (1930, 1920, 1910), rural population share (1930, 1920, 1910), on-farm population share (1930), farms per acre (1930, 1925, 1920, 1910), average farm size (1930, 1925, 1920, 1910), individual crop shares of total cropland (1930 and 1925, for five crop categories: corn, wheat, hay, cotton, oats/barley/rye), cows per acre (1930, 1925, 1920, 1910), pigs per acre (1930, 1925, 1920, 1910), and chickens per acre (1930, 1925, 1920). These characteristics capture pre-trends in county-level population and agricultural production, along with differential effects of shocks during the 1930s such as the Depression, New Deal programs, and agricultural mechanization. These pre-1930s county data are adjusted to county boundaries in 1940, following Hornbeck (Reference Hornbeck2010), and merged with mapped erosion intensity.
EMPIRICAL SPECIFICATIONS
For estimating relative impacts of Dust Bowl erosion on migration rates from Plains counties, I regress the migration rate for county c on the fraction of the county in a high-erosion area (H c), the fraction of the county in a medium-erosion area (M c), state fixed effects (α s), and county characteristics in 1930, 1925, 1920, and 1910 (X c):
 $${Y_c} = {\beta _1}{H_c} + {\beta _2}{M_c} + {\alpha _s} + \theta {X_c} + {\varepsilon _c}.$$
Coefficients β 1 and β 2 reflect the difference in migration rates for high-erosion counties and medium-erosion counties, relative to low-erosion counties. Relative impacts of the Dust Bowl are identified by comparing more-eroded counties to less-eroded counties within the same state and with similar pre-1930s characteristics (as specified in Hornbeck (Reference Hornbeck2012) and listed previously). The identification assumption is that more-eroded counties would otherwise have experienced similar migration as less-eroded counties, and this assumption is more credible when comparing counties within the same state and with similar characteristics in 1930 and before (i.e., counties with similar changes in population and counties with similar characteristics that would be affected more similarly by other events in the 1930s).Footnote 5 This equation does not estimate aggregate effects of the Dust Bowl, as even low-erosion counties may have been affected, but identifies differences in migration intensity and sets up an analysis of how these additional migrants differed.
For estimating average differences between Plains migrants and non-migrants, I regress individual characteristic Y ic on whether that individual moved from a Plains county in 1935 to a different county in 1940 (Migrant i) and county fixed effects (γ c):
 $${Y_{ic}} = \beta Migran{t_i} + {\gamma _c} + {\varepsilon _{ic}}.$$
When county fixed effects reflect individuals’ 1935 county, the coefficient β captures out-selection: average differences between Plains migrants and non-migrants from their old origin counties. When county fixed effects reflect individuals’ 1940 county, the coefficient β captures in-selection: average differences between Plains migrants and natives in their new destination counties throughout the contiguous United States.
The main empirical specification then estimates how Dust Bowl erosion induced different migrants, combining Equations (1) and (2). For example, while migrants may have more years of education than non-migrants in general, the main empirical specification estimates whether this difference was different for Plains migrants from more-eroded counties and Plains migrants from less-eroded counties. I regress individual characteristic Y ic on whether that individual moved from a Plains county in 1935 to a different county in 1940 (Migrant i), interacted with the fraction of the 1935 county in a high-erosion area (H c), the fraction of the 1935 county in a medium-erosion area (M c), 1935 state fixed effects (α s), and 1935 county characteristics in 1930, 1925, 1920, and 1910 (X c):
 $${Y_{ic}} = {\beta _1}{H_c} \times Migran{t_i} + {\beta _2}{M_c} \times Migran{t_i} + {\alpha _s} \times Migran{t_i} + \theta {X_c} \times Migran{t_i} + {\gamma _c} + {\varepsilon _{ic}}.$$
Coefficients β 1 and β 2 indicate how the selection of Plains migrants from high-erosion counties and medium-erosion counties is different than the selection of Plains migrants from low-erosion counties (within the same state and with similar pre-1930s county characteristics). When county fixed effects (γ c) reflect individuals’ 1935 county, β 1 and β 2 report how out-selection differs for Plains migrants from more-eroded counties relative to Plains migrants from less-eroded counties. When county fixed effects (γ c) reflect individuals’ 1940 county, β 1 and β 2 report how in-selection differs for Plains migrants from more-eroded counties relative to Plains migrants from less-eroded counties.
For individual-level analysis of migrant characteristics, in Equations (2) and (3), standard errors are clustered by 1935 county or two-way clustered by 1935 county and 1940 county. For county-level analysis of migration rates, in Equation (1), specifications are weighted by county population in 1935.Footnote 6 For replication files, see Hornbeck (2023).
RESULTS
Migration Rates
Table 1 reports that 17 percent of people moved counties between 1935 and 1940 (Panel A, Column (1)), among the 6.5 million sample people living in the 843 Plains counties in 1935. This migration rate is 3.1 percentage points higher for people from high-erosion counties (Panel A, Column (2)) and 1.9 percentage points higher for people from medium-erosion counties (Panel A, Column (3)), relative to people from low-erosion counties (within the same state and with similar pre-1930s county characteristics, from estimating Equation (1)). These estimates imply the migration rate is 1.2 percentage points higher for people from high-erosion counties relative to people from medium-erosion counties.Footnote 7
ESTIMATED MIGRATION FROM 1935 TO 1940, BY ORIGINAL COUNTY EROSION LEVEL

Notes: For 843 Plains counties (Figure 1), county-level migration rates are defined for all individuals residing in these counties in 1935, ages 25 to 55 in 1935, who reported county of residence in 1935 and 1940. Panel A reports the number of migrants leaving a county between 1935 and 1940, as a percent of that county’s sample population in 1935. Panel B reports the corresponding number for migrants who leave their county and move to a county further than 200 miles away, and Panel C reports the corresponding number for migrants who leave their county and move to a county within 200 miles. Panel D reports the number of migrants going to California, as a percent of 1935 county sample population. Panel E reports the number of migrants going to the Pacific Northwest (Washington, Oregon, Idaho) as a percent of 1935 county sample population. Panel F reports the number of migrants entering a county between 1935 and 1940, as a percent of that county’s population in 1935, split into migrants coming from a county more than 200 miles away and migrants coming from a county less than 200 miles away.
Column (1) reports the average across all 843 Plains counties, weighting by county population in 1935, with standard deviations reported in brackets. For each row, Columns (2) and (3) report the coefficients from estimating Equation (1): regressing the migration percent on the fraction of the county in a high-erosion area and the fraction of the county in a medium-erosion area (low-erosion is the omitted category), controlling for state fixed effects and a vector of county-level characteristics in 1930, 1925, 1920, and 1910 (from Hornbeck Reference Hornbeck2012). These county-level regressions are weighted by county population in 1935, and robust standard errors are reported in parentheses.
Sources: IPUMS 1940 Census Data (NBER server) and data from Hornbeck Reference Hornbeck2012 (see replication files and ReadMe).
This higher migration from more-eroded counties was concentrated among people moving to counties more than 200 miles from their origin county (Table 1, Panel B).Footnote 8 Over this period, 7.2 percent of people moved more than 200 miles (Column (1)), and this migration was higher from more-eroded counties: 2.6 percentage points higher from high-erosion counties (Column (2)) and 1.4 percentage points higher from medium-erosion counties (Column (3)), relative to low-erosion counties. By contrast, while 9.9 percent of people moved to counties within 200 miles (Panel C, Column (1)), this movement among nearby counties was more similar from more-eroded and less-eroded counties (Panel C, Columns (2) and (3)). Thus, while moving among nearby counties was relatively common over this period, the increase in migrants moving more than 200 miles more directly relates to additional migration induced by the Dust Bowl.
Of particular interest is long-distance migration to California. Overall, 1.65 percent of people moved from Plains counties to California (Panel D, Column (1)). This migration to California was 0.69 percentage points higher for people from high-erosion counties and 0.50 percentage points higher for people from medium-erosion counties, relative to people from low-erosion counties. These estimates imply the Dust Bowl induced 63,000 additional migrants to California from high-erosion and medium-erosion counties, relative to low-erosion counties.Footnote 9 This estimate should be lower than aggregate migration to California induced by the Dust Bowl, as the Dust Bowl likely increased migration from low-erosion counties also, but I focus on these additional Dust Bowl migrants from more-eroded counties to distinguish their characteristics from those of other migrants.
Panel E reports there was also somewhat elevated migration to the Pacific Northwest (Washington, Oregon, Idaho), though migration to California was substantively larger and has been more central in shaping popular impressions of Dust Bowl migrants. Panel F reports there was less in-migration to more-eroded counties, which helps to explain an additional portion of the relative population declines in more-eroded counties (from Hornbeck Reference Hornbeck2012), though this diverted in-migration is smaller in magnitude than the impact on out-migration and itself not statistically significant.
For subsequent tables, I define “migrants” as those who moved to counties more than 200 miles from their origin Plains county. This definition excludes those moving across nearby county boundaries, or moving within counties, and focuses on the elevated rates of migration associated with higher Dust Bowl erosion.Footnote 10
Table 2 further explores the migration patterns of those leaving more-eroded counties. Panel A reports that migrants from more-eroded counties moved farther than migrants from less-eroded counties, even among those who migrated more than 200 miles from their origin county. Panel B reports that migrants from more-eroded counties had less geographically clustered destinations than migrants from less-eroded counties, based on a constructed index of geographical clustering in counties’ migrant destinations (see table notes). These migration patterns suggest an atypical, and perhaps less-planned, migration response to local environmental destruction than other migration from less-eroded counties.
DIFFERENCES IN MIGRATION PATTERNS, BY COUNTY EROSION LEVEL

Notes: The sample is 843 Plains counties (Figure 1) for which county-level outcome variables are defined based on the destinations of those counties’ migrants (1935 residents of each county who lived in a different county by 1940, at least 200 miles away). In Panel A, the outcome variable is the average distance between migrants’ 1935 county and 1940 county. In Panel B, the outcome variable is an index of geographic clustering in migrant destinations, normalized to have a mean of zero and standard deviation of one. For each 1935 county, I calculate the share of migrants that go to each county in 1940. For that 1935 county’s state, I calculate the share of migrants from that state that go to each county in 1940. I then take the squared difference between these two measures, and create the index for each 1935 county by summing across all 1940 destinations. This creates an index of how much migrants from a particular county are concentrated in particular destinations, as compared to general destinations of migrants from that state.
Column (1) reports the sample mean of the outcome variable in each panel. Columns (2) and (3) report coefficients from estimating Equation (1): regressing the indicated outcome variable in each panel on the fraction of the 1935 county in a high-erosion area and medium-erosion area (low-erosion is the omitted category), and controlling for 1935 state fixed effects and 1935 county characteristics (in 1930, 1925, 1920, 1910). Robust standard errors are reported in parentheses.
Sources: IPUMS 1940 Census Data (NBER server) and data from Hornbeck Reference Hornbeck2012 (see replication files and ReadMe).
Out-Selection of Dust Bowl Migrants
Plains migrants were “positively selected,” on average, with roughly one more year of education than non-migrants from their 1935 origin county (Table 3, Column (1)). This difference is similar for men (1.11 years) and women (1.02 years), from estimating Equation (2). Indeed, more-educated people are generally more geographically mobile in the United States (see, e.g., Bogue and Hagood 1953; Collins Reference Collins, Hatton and Kevin2007; Hornbeck and Moretti Reference Hornbeck and Moretti2021).Footnote 11
ESTIMATED OUT-SELECTION OF MIGRANTS, BY ORIGINAL COUNTY EROSION LEVEL

Notes: For Columns (1)–(3), a migrant is someone who lived in different counties in 1935 and 1940 (at least 200 miles apart) and a non-migrant is someone who lived in the same county in 1935 and 1940. The sample is restricted to people who lived in 1935 within the 843 Plains counties (Figure 1). For Columns (4)–(6), the definition of migrants is further restricted to those who migrated to counties in California between 1935 and 1940.
For the indicated outcome variable (in rows), Column (1) reports estimates from Equation (2): the estimated coefficient on a “migrant” indicator, controlling for 1935 county fixed effects. From estimating Equation (3), Columns (2) and (3) report coefficients on the “migrant” indicator, interacted with the fraction of the person’s 1935 county in a high-erosion area and medium-erosion area (low-erosion is the omitted category), and controlling for: 1935 county fixed effects, interactions between the “migrant” indicator and 1935 state fixed effects, and interactions between the “migrant” indicator and 1935 county characteristics (in 1930, 1925, 1920, 1910). Columns (4)–(6) report analogous estimates, but restricting the definition of migrant to include only those who migrated to counties in California.
For these individual-level regressions, robust standard errors clustered by 1935 county are reported in parentheses.
Sources: IPUMS 1940 Census Data (NBER server) and data from Hornbeck Reference Hornbeck2012 (see replication files and ReadMe).
By contrast, the Dust Bowl induced migration among people with fewer years of education. Migrants from more-eroded counties were less “positively selected,” in years of education, than migrants from less-eroded counties (Columns (2) and (3)). Male migrants from high-erosion counties averaged 0.51 fewer years of education relative to non-migrants from their counties, compared to the difference in years of education between migrants and non-migrants from low-erosion counties (within the same state and with similar pre-1930s characteristics, from estimating Equation (3)).
Under an additional assumption, these estimates can be used to recover the selection of “Dust Bowl migrants” only (i.e., only those migrants induced to move by the Dust Bowl erosion). If we assume that higher erosion only induced additional migrants, and did not also discourage some from migrating, then estimates from Table 1 imply that additional Dust Bowl migrants were 30 percent of all migrants from high-erosion counties (and 18 percent of all migrants from medium-erosion counties).Footnote 12 To recover the selection of these additional Dust Bowl migrants, induced to move by higher erosion and driving the differences estimated in Table 3, estimates from Column (2) of Table 3 would then be scaled up by 3.33 (1/0.30): male Dust Bowl migrants from high-erosion counties averaged 1.7 fewer years of education relative to non-migrants in high-erosion counties, compared to the difference between migrants and non-migrants from low-erosion counties.Footnote 13
Dust Bowl migrants were then “negatively selected” in absolute terms, compared to non-migrants. Male Dust Bowl migrants from high-erosion counties were less positively selected than migrants from low-erosion counties (–1.7 years), whereas average male migrants were positively selected (1.1 years), implying Dust Bowl migrants also had less education than non-migrants. These estimates are similar for female migrants: whereas migrants were generally positively selected, Dust Bowl migrants were negatively selected in years of education.
Plains migrants to California also averaged more years of education than non-migrants (Column (4)), though these migrants were less positively selected than migrants to all counties (Column (1)). Migrants to California from more-eroded counties were less positively selected than migrants to California from less-eroded counties (Columns (5) and (6)), and “Dust Bowl migrants” moving to California were negatively selected, in absolute terms, compared to non-migrants.Footnote 14
Plains migrants were also less likely than non-migrants to have been living in their birth state in 1935 (Column (1)), though this was less true for migrants from more-eroded counties than for migrants from less-eroded counties (Columns (2) and (3)). In other respects, Dust Bowl migrants were more similar to general migrants: less likely to have lived on a farm in 1935, younger, and more likely male.
Appendix Table 1 reports the selection of “local migrants,” or those who moved to counties within 200 miles. The rate of local migration was similar from more-eroded and less-eroded counties (Table 1, Panel C), and Appendix Table 1 reports little difference in years of education for migrants from more-eroded and less-eroded counties.Footnote 15 This is consistent with the assumption noted previously that the Dust Bowl largely induced additional migrants while other migrants remained similar. If higher erosion also discouraged some from migrating, then “Dust Bowl migrants” would be a higher share of all migrants and the implied scaling factor used earlier would be closer to one.Footnote 16
Appendix Table 2 broadens the analysis to compare migrants and non-migrants from the Plains region and non-Plains regions. As in Table 3, Plains migrants average more years of education than non-migrants (Column (3)). This difference is even greater in non-Plains regions (Column (6)), such that all Plains migrants are less positively-selected than all non-Plains migrants (Column (7)).
In-Selection of Dust Bowl Migrants
Dust Bowl migrants’ reputation for having been agricultural appears to reflect differences from natives in their new counties (Table 4), more than differences from non-migrants in their origin counties (Table 3). Migrants from more-eroded counties were more likely to have lived on a farm in 1935 than migrants from less-eroded counties, compared to natives in their destination counties (Table 4, Row 1, Columns (2)–(3) and (5)–(6)). Further, while all Plains migrants were no more likely than natives to have lived on a farm (Column (1)), all Plains migrants to California were 12 percentage points more likely to have lived on a farm in 1935 than natives in their California counties (Column (4)). From Californians’ perspective, which largely shaped popular impressions of the Dust Bowl migrants: more migrants were arriving from more-eroded counties; all Plains migrants to California had a more agricultural background than natives; and Dust Bowl migrants had a more agricultural background, relative to natives, than was typical of other Plains migrants. By 1940, however, migrants had shifted from agriculture: all Plains migrants became less likely than natives to live on a farm, weakly so in California, and migrants from more-eroded counties were not as disproportionately living on a farm in 1940.
ESTIMATED IN-SELECTION OF MIGRANTS, BY ORIGINAL COUNTY EROSION LEVEL

Notes: For Columns (1)–(3), a migrant is someone who lived in different counties in 1935 and 1940, at least 200 miles apart, and lived in 1935 within the 843 Plains counties (Figure 1). A non-migrant is someone who lived in the same county in 1935 and 1940, within all counties in the contiguous United States. For Columns (4)–(6), the sample is further restricted to migrants from the 843 Plains counties to California and non-migrants in California counties only.
For the indicated outcome variable (in rows), Column (1) reports estimates from Equation (2): the estimated coefficient on a “migrant” indicator, controlling for 1940 county fixed effects. From estimating Equation (3), Columns (2) and (3) report coefficients on the “migrant” indicator, interacted with the fraction of the person’s 1935 county in a high-erosion area and medium-erosion area (low-erosion is the omitted category), and controlling for: 1940 county fixed effects, interactions between the “migrant” indicator and 1935 state fixed effects, and interactions between the “migrant” indicator and 1935 county characteristics. Skill-adjusted income is defined by controlling for individuals’ years of education, age, and age-squared.
For these individual-level regressions, robust standard errors two-way clustered by 1935 county and 1940 county are reported in parentheses.
Sources: IPUMS 1940 Census Data (NBER server) and data from Hornbeck Reference Hornbeck2012 (see replication files and ReadMe).
Dust Bowl migrants had lower incomes in 1939, relative to natives, and especially in California. This reflects two effects: migrants from more-eroded counties had lower incomes than migrants from less-eroded counties, and all Plains migrants had lower incomes than natives in California especially.Footnote 17 Migrants from more-eroded counties also had fewer years of education, relative to natives, than migrants from less-eroded counties. There continue to be income differences, however, after controlling for “skill” (years of education, age, age-squared).Footnote 18 Reinforcing this effect, all Plains migrants averaged substantially lower skill-adjusted incomes than natives (especially in California).Footnote 19
Dust Bowl Impact on Wage Incomes
I estimate remarkably modest impacts of the Dust Bowl on 1939 wage incomes of people from more-eroded counties, given the lower incomes of Dust Bowl migrants (relative to natives) and the substantial impacts of Dust Bowl erosion on agricultural land value and revenue in more-eroded counties. Table 5, Panel A, compares 1939 wage incomes for all those living in more-eroded counties in 1935 to all those living in less-eroded counties in 1935 (within the same state and controlling for pre-1930’s county characteristics, as in Equation (1)).
ESTIMATED LOG INCOME DIFFERENCES IN 1939, BY ORIGINAL COUNTY EROSION LEVEL

Notes: The sample includes all people who were living in 1935 within the 843 Plains counties (Figure 1), ages 25 to 55 in 1935, who reported county of residence in 1935 and 1940, and who reported working 26+ weeks in 1939 (equivalent full-time weeks). Panel A reports estimates for a pooled sample of men and women, interacting all control variables with gender, and Panel B reports estimates separately by gender. Panel C reports estimates separately for migrants (who moved more than 200 miles) and non-migrants (who live in the same county), and Panel D reports estimates by migration status when controlling for individuals’ years of education, age, and age-squared. Panel E reports estimates separately for those with less than or equal to eight years of education and those with more than eight years of education, and Panel F reports estimates separately for those living on a farm in 1935 and those not living on a farm in 1935.
Column (1) reports average 1939 wage and salary income in levels, with standard deviations reported in brackets. As in Equation (1), Columns (2) and (3) report the coefficients from regressing log income on the fraction of the person’s 1935 county in a high-erosion area and medium-erosion area (low-erosion is the omitted category), controlling for 1935 state fixed effects and 1935 county characteristics (in 1930, 1925, 1920, and 1910). For these individual-level regressions, robust standard errors two-way clustered by 1935 county and 1940 county are reported in parentheses.
Sources: IPUMS 1940 Census Data (NBER server) and data from Hornbeck Reference Hornbeck2012 (see replication files and ReadMe).
Average wage incomes in 1939 were a statistically insignificant 1.3 percent lower for people from high-erosion counties relative to people from low-erosion counties (Panel A, Column (1)). The Dust Bowl’s effect on wage incomes is moderately more negative for people from medium-erosion counties and for the smaller number of women working 26+ weeks (Panel B), but the magnitudes are small in contrast to much larger impacts on agricultural revenues and land values in high-erosion counties (27 and 30 percent, respectively) and medium-erosion counties (16 and 17 percent, respectively) estimated by Hornbeck (Reference Hornbeck2012). These estimates suggest substantially smaller impacts from the Dust Bowl on people than on land. A key difference is that people can move following local environmental destruction, whereas land is fixed.
Panels A and B pool all migrants and non-migrants, based on their 1935 location, because of the differential selection of migrants and their destinations. The clearest causal impact of the Dust Bowl on wage incomes would then not condition on endogenous migration decisions.Footnote 20 Indeed, previous research was unable to follow migrants and focused on how land was affected by the Dust Bowl (Hornbeck Reference Hornbeck2012) rather than how people were affected by the Dust Bowl.
To further explore these income differences, however, Panel C reports differences in 1939 wage incomes for migrants and non-migrants. Migrants from more-eroded counties have modestly lower incomes than migrants from less-eroded counties, whereas there is less difference in incomes for non-migrants from more-eroded and less-eroded counties. Migrants from more-eroded counties had fewer years of education, however, and Panel D reports the reverse pattern when controlling for individuals’ years of education, age, and age-squared (i.e., “skill” in Mincer earnings regressions). Overall, migrants’ and non-migrants’ wage incomes were similarly affected in more-eroded counties in a manner consistent with this migration providing an outlet to mitigate the economic impacts of the Dust Bowl.
Income differences among migrants do not appear to be driven by migrants from more-eroded counties moving to destinations with different prevailing incomes. Using the empirical specification from Table 2, migrants from more-eroded counties move to destinations in which natives have similar average incomes and average years of education as natives in the destination counties of migrants from less-eroded counties. The skill-adjusted income differences for migrants, from Panel D of Table 5, are also similar when including 1939 county fixed effects to compare migrants from more-eroded counties to migrants from less-eroded counties within the same 1939 county. This suggests that income differences for migrants from more-eroded counties are not driven by different destinations.
Panels E and F report impacts on 1939 wage incomes when splitting the sample by education and farm status, which suggests less impact on the incomes of demographic groups that had more migration response. Migrants and non-migrants were also affected similarly, within demographic groups, consistent with migration equalizing labor market impacts.
The 1940 Census reports only wage and salary income in 1939, which would not include impacts on agricultural profits. I estimate that people from more-eroded counties were not differentially likely to be farmers in 1939, for the whole population or for migrants only, which suggests there is not differential sorting into occupations without reported wage data. Given labor mobility across occupations, the estimated impacts on wage and salary income could approximate impacts on labor income in agricultural and non-agricultural sectors.
Table 6 reports how the impacts of the Dust Bowl on incomes were mitigated or exacerbated by New Deal program spending from 1933 to 1939. Panel A reports that male incomes fell by 6.1 percent more in more-eroded counties that had one standard deviation greater per capita spending through AAA. Greater public works spending was associated with moderately higher male incomes in more-eroded counties, whereas relief spending had little impact by 1939 and there was little differential impact on female incomes (Panel B). These results are consistent with AAA spending reducing local manual labor demand by taking agricultural land out of production, whereas public works spending generated local manual labor demand (Fishback, Horrace, and Kantor Reference Fishback, Horrace and Kantor2005; Liu and Fishback Reference Liu and Fishback2019). These estimates suggest how policy responses can mitigate or exacerbate the economic consequences of permanent environmental change (see also Balboni Reference Balboni2021).
ESTIMATED LOG INCOME DIFFERENCES IN 1939, BY ORIGINAL COUNTY EROSION LEVEL, INTERACTED WITH NEW DEAL PROGRAM SPENDING

Notes: This table reports estimates similar to those from Table 5, but interacting county erosion with counties’ level of per-capita spending on New Deal programs (AAA, Public Works, Relief). New Deal spending is normalized to have a mean of zero and standard deviation of one. The sample includes all people who were living in 1935 within the 843 Plains counties (Figure 1), ages 25 to 55 in 1935, who reported county of residence in 1935 and 1940, and who reported working 26+ weeks in 1939 (equivalent full-time weeks). Panels A and B report estimates for men and women, interacting all control variables with gender.
Column (1) reports average 1939 wage and salary income in levels, with standard deviations reported in brackets. As in Equation (1), Columns (2) and (3) report the coefficients from regressing log income on the fraction of the person’s 1935 county in a high-erosion area and medium-erosion area (low-erosion is the omitted category), along with interactions between county erosion and New Deal program spending, controlling for main effects of New Deal program spending and 1935 state fixed effects and 1935 county characteristics (in 1930, 1925, 1920, and 1910). For these individual-level regressions, robust standard errors two-way clustered by 1935 county and 1940 county are reported in parentheses.
Sources: IPUMS 1940 Census Data (NBER server) and data from Hornbeck Reference Hornbeck2012 (see replication files and ReadMe).
CONCLUSION
Dust Bowl migrants are an enduring archetype of environmental refugees, having left areas of the U.S. Plains that experienced severe erosion in the 1930s. While impressions of Dust Bowl migrants influence perceptions of migration responses to environmental collapse, this Dust Bowl migration is difficult to identify separately from the influences of other events in the 1930s (e.g., the Great Depression, New Deal policies, changing crop prices, agricultural mechanization). These other factors influence both artistic depictions and quantitative analyses of migrants from the Southwest (Gregory Reference Gregory1989) or panhandle region (Long and Siu Reference Long and Siu2018).
My analysis compares migrants from more-eroded counties to migrants from less-eroded counties, within the same state and with similar pre-1930s county characteristics, to identify the relative increase in migration induced by the Dust Bowl and how the Dust Bowl changed the selection of migrants. I estimate a substantial migration response to the Dust Bowl, which generated distinctive environmental refugees, but was ultimately associated with remarkably modest impacts of the Dust Bowl on the wage incomes of people from more-eroded counties in comparison to the substantial and enduring impacts of the Dust Bowl on agricultural land in more-eroded counties.
Dust Bowl migrants were “negatively selected,” with fewer years of education, in contrast to typical migrants who were “positively selected” and averaged more years of education than non-migrants. In this sense, these environmental refugees were atypical of general migrants in this era, more pushed from more-eroded counties than pulled to economic opportunities. This atypical selection of migrants suggests why these particular migrants generated unusually hostile local reactions in their destinations.
I estimate increased migration to California from more-eroded counties, which is only one component of the general migration response to the Dust Bowl, but which has been central to popular impressions of Dust Bowl migrants. These impressions of Dust Bowl migrants partly reflected average migrant experiences in California, where migrants had substantially lower incomes than natives, and migrants from more-eroded counties were also more likely than natives to have lived on a farm in 1935.
There was ultimately little impact of the Dust Bowl on 1939 wage incomes, however, for people living in more-eroded counties in 1935 relative to people living in less-eroded counties in 1935. Further, the Dust Bowl had similar impacts on 1939 wage incomes of migrants and non-migrants. Later censuses or Social Security records may allow for further analysis of longer-term impacts on Dust Bowl migrants and their children, though it would be important to consider endogenous selection into migration from more-eroded counties.Footnote 21
Whereas Hornbeck (Reference Hornbeck2012) estimates only slow and limited adaptation of local agricultural production in more-eroded counties, and enduring declines in agricultural land values, the migration of these “environmental refugees” was ultimately associated with little average impact on all original residents’ wage incomes from the permanent collapse of the local environment. These environmental refugees were distinctive in their characteristics and destinations, however, which suggests a more unusual disruption and migration response following local environmental collapse.
ESTIMATED OUT-SELECTION OF LOCAL MIGRANTS, BY ORIGINAL COUNTY EROSION LEVEL
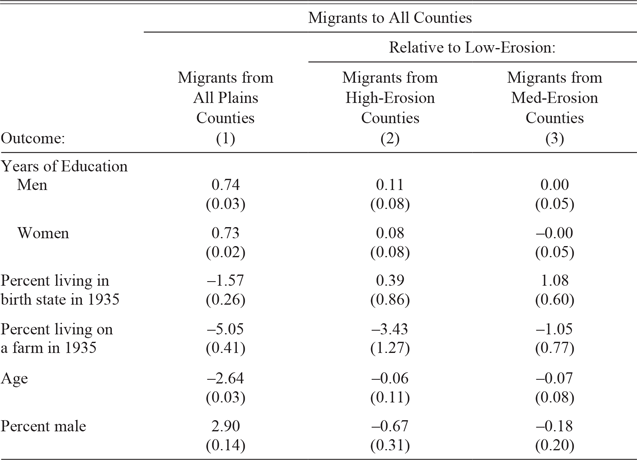
Notes: Columns (1)–(3) reproduce Columns (1)–(3) in Table 3, but for “local migrants” who lived in different counties in 1935 and 1940 less than 200 miles apart (compared to non-migrants, who lived in the same county in 1935 and 1940). The sample is restricted to people who lived in 1935 within the 843 Plains counties (Figure 1).
For the indicated outcome variable (in rows), Column (1) reports estimates from Equation (2): the estimated coefficient on a “local migrant” indicator, controlling for 1935 county fixed effects. From estimating Equation (3), Columns (2) and (3) report coefficients on the “local migrant” indicator, interacted with the fraction of the person’s 1935 county in a high-erosion area and medium-erosion area (low-erosion is the omitted category), and controlling for: 1935 county fixed effects, interactions between the “local migrant” indicator and 1935 state fixed effects, and interactions between the “local migrant” indicator and 1935 county characteristics (in 1930, 1925, 1920, 1910).
For these individual-level regressions, robust standard errors clustered by 1935 county are reported in parentheses.
Sources: IPUMS 1940 Census Data (NBER server) and data from Hornbeck Reference Hornbeck2012 (see replication files and ReadMe).
AVERAGE OUT-SELECTION OF MIGRANTS, IN THE PLAINS VS. NON-PLAINS REGIONS

Notes: As in Table 3, a migrant is someone who lived in different counties in 1935 and 1940 (at least 200 miles apart) and a non-migrant is someone who lived in the same county in 1935 and 1940. For Columns (1)–(3), the sample is people who lived in 1935 within the 843 Plains counties (Figure 1); for Columns (4)–(6), the sample is people who lived outside the 843 Plains counties.
For the indicated outcome variable (in rows): Columns (1) and (4) report the sample means for migrants and Columns (2) and (5) report the sample means for non-migrants. Column (3) reports the difference between Columns (1) and (2); Column (6) reports the difference between Columns (4) and (5); and Column (7) reports the difference between Columns (3) and (6). Standard deviations are reported in brackets, and robust standard errors clustered by 1935 county are reported in parentheses.
Sources: IPUMS 1940 Census Data (NBER server) and data from Hornbeck Reference Hornbeck2012 (see replication files and ReadMe).


 Open access

