


DISCUSSION POINTS
• Cost reductions are no longer the single most significant challenge for PV technology—addressing grid integration challenges and increasing grid flexibility are now also critical to solar’s future.
• With greater grid flexibility and technology advances, solar energy has the potential to supply as much as 30% of U.S. electricity demand by 2050, and significantly more if energy storage costs also decline aggressively.
• There is a synergistic relationship between solar energy and energy storage: cost declines and greater deployment of one create greater market opportunity for the other.
Introduction
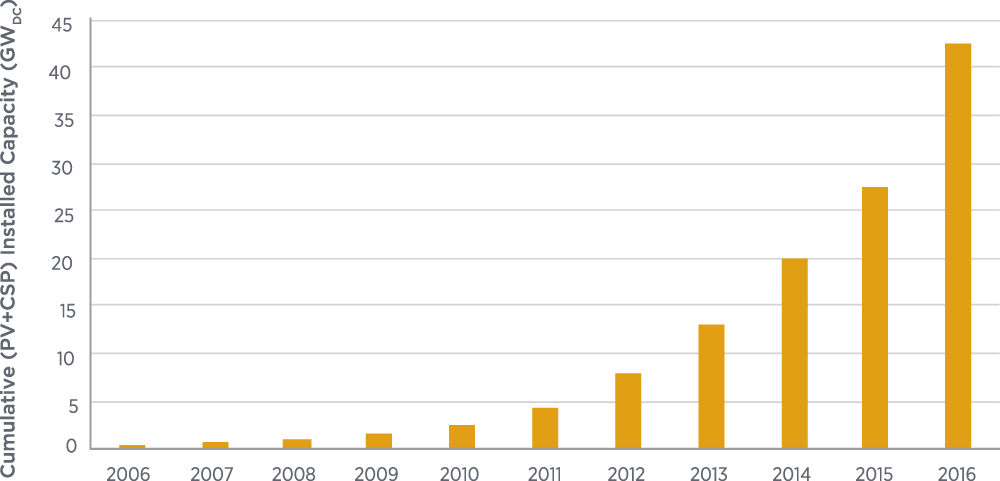
It is a remarkable time for solar power. Over the past decade, solar power has gone from an expensive and niche technology to the largest source of new electrical generation capacity added in the United States (in 20161). Solar power capacity in the United States increased nearly two orders of magnitude from 2006 to 2016 (Fig. 1), from generating less than 0.01% of U.S. electricity to over 1%,2 comprised by over 1 million individual installations.1 Furthermore, in some areas of the United States, solar is even more prominent. In 2016, solar technology generated more than 13% of electricity in California, while Hawaii, Vermont, and Nevada all surpassed 7% of electricity from solar.2 Worldwide, the trends are similar: 2015 was the first year that solar power supplied greater than 1% of all electricity, with some countries reaching much higher levels (notably Italy and Germany at 8%).3 This recent growth in the United States has been enabled by rapid cost declines—photovoltaics (PV) system costs falling by a factor of 6 in the past 10 years4—as well as policies and incentives that have included state renewable portfolio standards and the federal investment tax credit (ITC).
The growth of solar over the past decade has also been consistently underestimated. Figure 2 shows how the actual installations of solar systems in the United States have consistently been higher than projections over the past 10 years. The same pattern of underestimating the potential growth of solar has also been true for international projections.Reference Haegel, Margolis, Buonassisi, Feldman, Froitzheim, Garabedian, Green, Glunz, Henning, Holder, Kaizuka, Kroposki, Matsubara, Niki, Sakurai, Schindler, Tumas, Weber, Wilson, Woodhouse and Kurtz7
Projections of cumulative PV capacity in the United States compared to actual installations, illustrating the pattern of underprediction of PV deployment. Projections from the Energy Information Administration’s Annual Energy Outlook (AEO).8 Note that the values are in GW-AC, rather than GW-DC as used in Fig. 1.

Looking forward, there is also considerable potential for solar power to play an increasingly important role as a power generation source. By 2030, baseline projections are that solar will supply 5% of U.S. electricity and will increase to 12–17% by 2050.9–Reference Cole, Frew, Gagnon, Richards, Sun, Zuboy, Woodhouse and Margolis11 Furthermore, more rapid technology innovation, both in solar-generated power as well as synergistic technologies like energy storage, has the potential to significantly expand solar deployment beyond these numbers. There remains significant room for further cost reductions, and solar technology can also increase its contributions to the reliability and resilience of the power grid.
To date, PV, which uses semiconductors to directly convert sunlight into electricity, has been the dominant solar technology, with 40.6 GWDC installed in the United States at the end of 2016. There are also concentrating solar thermal power (CSP) technologies (1.9 GW installed in the United States2), which use mirrors to focus sunlight onto a tower or tube receiver where it is converted into thermal energy that can be stored before being used to run a conventional power generator such as a steam turbine (Fig. 3). The configuration of CSP systems can be tailored to function more like a peaker or a baseload power plant. Both PV and CSP technologies can decrease carbon dioxide emissions and water consumption relative to conventional power generation technologies and provide other important benefits. Because sunlight is a free, ubiquitous energy source, once solar technology is installed, the price of electricity generation can be very predictable over the system’s lifetime (e.g., there are no uncertainties due to fuel price fluctuations). In addition, if the costs for solar system installation and operation and maintenance (O&M) continue to decline, increasing solar generation at the utility-scale could lead to overall electricity price reductions.Reference Cole, Frew, Gagnon, Richards, Sun, Zuboy, Woodhouse and Margolis11 Photovoltaic power retains its efficiency even at small scale—a key difference from conventional generator-based power sources. This makes it possible for solar to be economical for small-scale installations (e.g., household rooftop installations), including portable and off-grid applications.
Photographs of PV technology (a) and CSP power tower technology (b, photo credit: Julianne Boden).

Still, there are significant barriers to the increasing deployment of solar technologies. Because the sun does not shine at night and clouds can create variability in output during the day, there are challenges integrating high penetrations of solar-generated electricity onto the grid. CSP with thermal energy storage can mitigate many of those challenges by storing its thermal energy until it is needed, and PV can be integrated with energy storage, flexible loads, and fast-ramping generators, but more work is needed to advance both approaches. Another challenge is project financing because both PV and CSP are capital-intensive technologies and thus most of the funding for the entire lifecycle of the plant needs to be raised upfront.
In the remainder of this paper, we provide an overview of historical and potential future cost reductions for solar energy technologies and discuss how increasing grid flexibility (with a focus on energy storage) could influence future solar deployment.
Cost declines—history
In discussing the costs of solar technology, the two most frequently used metrics are the upfront system cost (in $/W) and levelized cost of electricity (LCOE, in $/kW h). LCOE represents the net present value of the average cost of electricity produced by a system, accounting for the cradle-to-grave cost (including the upfront system cost and the costs of financing, O&M, taxes, and system decommissioning) as well as the energy produced over the lifetime of the system (including the initial system energy yield in the specific location and the remaining lifetime energy yield that changes according to the system degradation rate and decommissioning schedule).Reference Jones-Albertus, Feldman, Fu, Horowitz and Woodhouse12 LCOE is the primary metric used in this paper due to its inclusion of full lifecycle costs, rather than only upfront costs.
LCOE is a good starting point to understand the cost drivers behind a single energy technology (e.g., PV); however, it is not an effective metric for comparing between energy technologies. For example, LCOE does not account for the time-varying value of electricity. While PV could have a lower LCOE than another technology, PV can also have lower value as it only produces power when the sun is shining. Because both cost and value influence decision making, the LCOE metric alone is not sufficient to predict technology adoption. At present, technology adoption is best treated by detailed capacity expansion models that account for both the cost and value of a technology in projecting deployment. In this paper, we draw on results generated using NREL’s Regional Energy Deployment System (ReEDS) modelReference Eurek, Cole, Bielen, Blair, Cohen, Frew, Ho, Krishnan, Mai and Steinberg13 which incorporates a wide-range of factors, including the value of energy technologies in various time slices, to project the evolution of the U.S. electricity system through 2050 based upon grid balancing requirements and lowest cost optimization for electrical capacity expansion.
The LCOE of PV has fallen dramatically over the past decade. Figure 4 shows the declines from 2010 to 2017 in LCOE across three market segments—residential (i.e., 3–10 kW), commercial (i.e., 10 kW–2 MW), and utility-scale (i.e., greater than 2 MW). The red bars represent LCOE values in a given year, without the ITC or other incentives, across the climatic variation of the United States. The sunniest locations (i.e., Daggett, CA) get the most energy (i.e., they have the highest energy yield) from the same PV system and thus have the lowest LCOE; regions with the least sunlight (i.e., Seattle, WA) have the lowest energy yield and thus the highest LCOE for the same PV system. For better comparison to reported market prices, the blue bars show the LCOE range when including the 30% federal ITC. The white line across each bar shows the value for average U.S. climate represented by Kansas City, MO. The rapid declines in LCOE from 2010 to 2017 were driven by advances in technology, economies of scale resulting from the rapid capacity expansion, and the development of best practices for installation and financing. Modules are the components whose prices have fallen most rapidly over this time period; in 2017, they fell to roughly 15% of their 2010 price.Reference Fu, Feldman, Margolis, Woodhouse and Ardani14
LCOE for PV systems in the United States from 2010 to 2017 across the three PV market segments. Costs shown both with (blue) and without (red) the federal ITC. No other incentives are included. The 5-year Modified Accelerated Cost Recovery System (MACRS) for depreciation accounting is used.15 The bars represent cost variations across the United States as a function of changing climate. The white line across each bar shows the value for average U.S. climate represented by Kansas City, MO, with the white lines across the red horizontal bars representing the SunShot targets, although the largest current markets in the United States are in sunnier regions.Reference Fu, Feldman, Margolis, Woodhouse and Ardani14

CSP costs have also fallen, though not as rapidly as PV costs. From 2010 to 2017, CSP LCOE fell from $0.21/kW h to $0.10/kW h. Declines in CSP LCOE coupled with support from the U.S. Department of Energy’s Loan Guarantee Program enabled 1.3 GW of new CSP plants to be deployed in the United States between 2013 and 2015. Since that time, new CSP capacity in the United States has stalled because of low natural gas prices coupled with falling wind and PV prices.
SunShot cost reduction targets
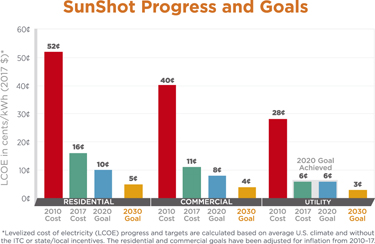
In 2011, the Department of Energy (DOE) launched the SunShot Initiative with the goal to drive down the costs of solar electricity to 6 cents/kW h by 2020 for utility-scale solar power in an average U.S. climate without the federal, state, or local incentives (e.g., the ITC). At the time, this goal was viewed as highly ambitious. It required a factor of four cost reduction in just 10 years, and few people would have believed that the solar industry could achieve the goal ahead of schedule, as was done in 2017.Reference Fu, Feldman, Margolis, Woodhouse and Ardani14 While the LCOE values for commercial and residential systems have also fallen significantly, the SunShot 2020 targets for those sectors are not yet accomplished. Most notably, commercial and residential systems need significant further reductions in the soft costs (i.e., customer acquisition, permitting, installation labor, and interconnection costs) to hit their 2020 targets in the next three years. In 2017 dollars, these targets are 8 cents/kW h for commercial installations and 10 cents/kW h for residential installations (see Fig. 5). Significant further progress is also needed to achieve the SunShot 2020 CSP target of 6 cents/kW h for CSP systems with 12 h of thermal energy storage from the 2017 benchmark of 10 cents/kW h.16
LCOE for PV in 2010 and 2017, and SunShot LCOE targets across residential, commercial, and utility-scale PV sectors. Source: U.S. Department of Energy.
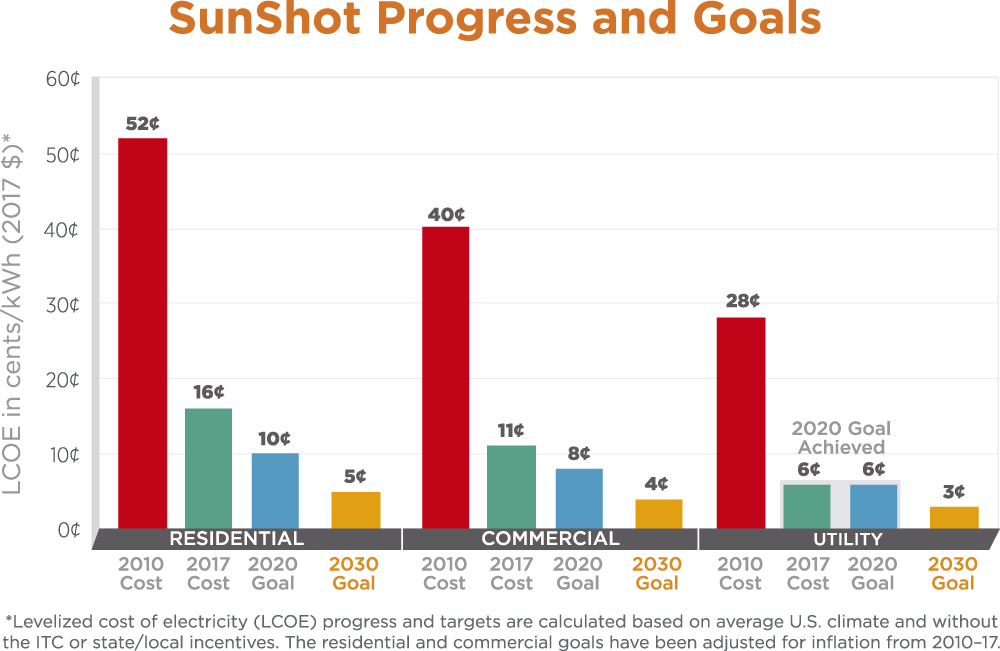
Recognizing the potential for further cost reductions to contribute to lower electricity costs and enable greater solar deployment, DOE recently set LCOE targets for a 2030 time horizon (Fig. 5). These targets are 3 cents/kW h for utility-scale PV without incentives in an average U.S. climate (which corresponds to roughly 2 cents/kW h in the sunniest regions of the country), 4 cents/kW h for commercial PV, and 5 cents/kW h for residential PV systems. At 3 cents/kW h, utility-scale PV electricity would be comparable to or lower than the variable cost of many existing power generators, supporting lower cost electricity prices across a grid mixed with other power generation assets.
For utility-scale CSP systems with at least 12 h of thermal energy storage, the SunShot 2030 cost target is 5 cents/kW h. CSP systems that incorporate thermal energy storage can provide electricity when it is needed, even when the sun is not shining. Thus, this power has a higher value to the electricity system than PV electricity and does not need to have as low of an LCOE target to be competitive.
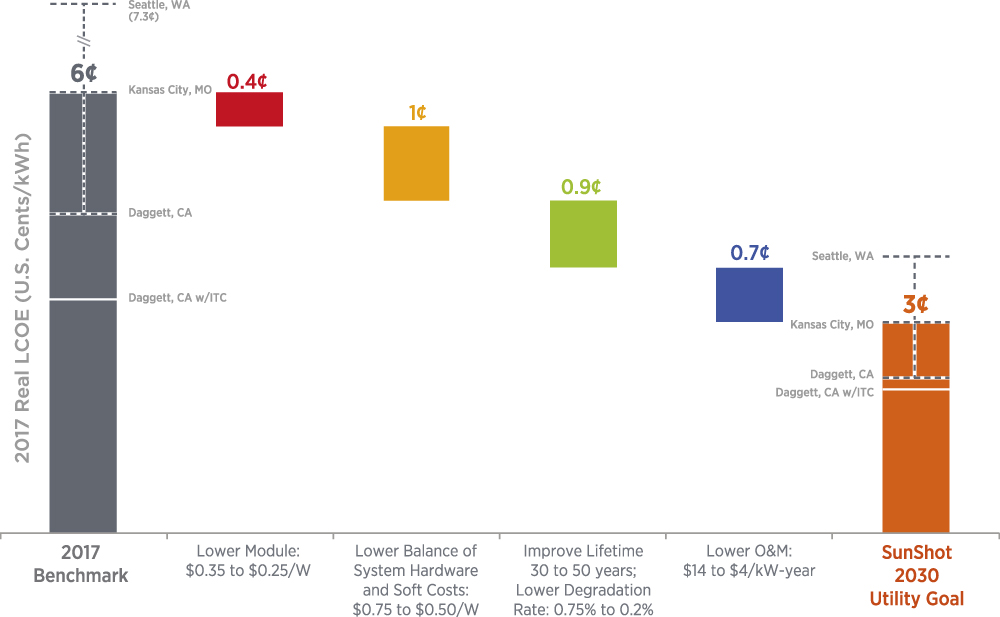
An example pathway to get from 2017 utility-scale PV costs to the 2030 targets is shown in Fig. 6. This example includes a combination of specific LCOE reductions due to reductions in the costs of the PV module and balance of systems (BOS) (which includes hardware costs like the inverter and wiring, as well as soft costs like installation labor, permitting, and interconnection), increases in the system’s lifetime energy production through improvements in reliability and durability, and reductions in operations and maintenance costs. It is important to note that sustainable module price reductions are targeted, meaning that the cost reductions allow for sufficient profit by manufacturers and throughout the supply chain to enable continued growth in production capacity.
One example of cost reductions from the 2017 benchmark of 6 cents/kW h to get to the 2030 goal of 3 cents/kW h for utility-scale PV systems in average U.S. climate without incentives. Other combinations of cost reductions to reach this target are possible. The size of the module price reduction bucket may be larger than shown here if the current 35 cents/W price is not found to be sustainable.
Improvements in module efficiency and energy yield without substantial increases in the manufacturing cost per unit area are one key strategy to enable further reductions in module price. Examples of other opportunities include reductions in silicon wafer cost via thinner wafers or minimized kerf losses as well as lower cost cell processing. Improvements in module and system efficiency also contribute to reductions in the BOS costs per watt, by providing more power from a given set of system components. Other approaches to reduce BOS costs include increasing the speed of interconnection and installation processes and increasing system voltage. Improving system lifetimes and lowering degradation rates can be accomplished through advanced module materials and designs as well as improvements in predictive accelerated test methods. Examples of ways to achieve lower operations and maintenance costs include improvements in power electronics reliability, as well as data analytics and automated characterization tools to better understand and predict overall maintenance needs.
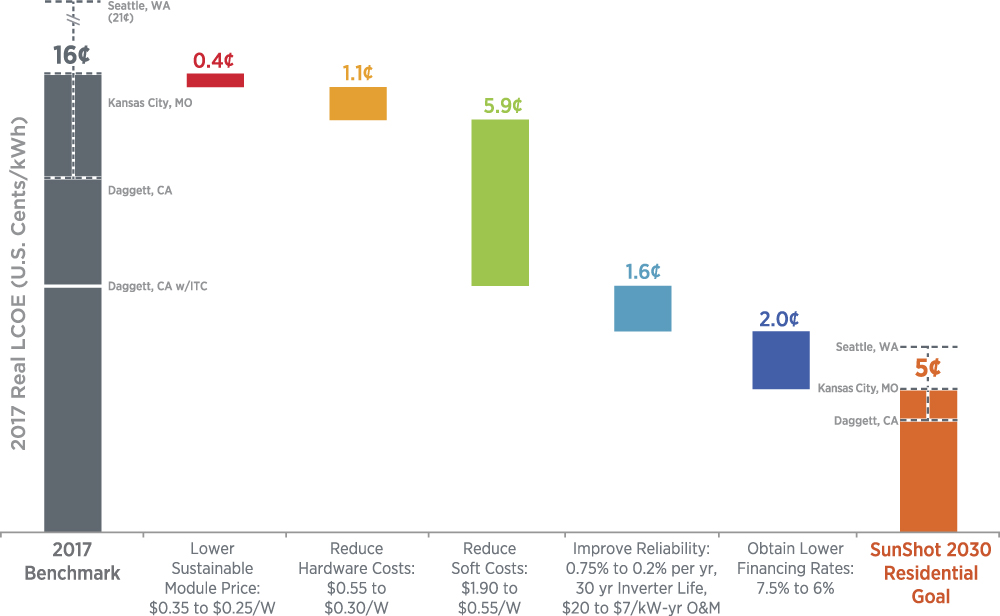
Figure 7 shows one possible pathway for residential systems to reach the 2030 cost target of 5 cents/kW h in average climate and without incentives. Here, the BOS costs are broken into separate hardware and soft costs categories, illustrating the comparatively greater need for reductions in soft costs (e.g., customer acquisition, permitting, interconnection, installation labor, and supply chain costs) as compared to utility-scale systems. The figure also shows the opportunities for reductions in cost of capital to contribute to LCOE reductions. New financing methods and sources of capital, as well as lower perceived technology risk, can contribute to reductions in the cost of capital.
One pathway to the SunShot 2030 residential solar cost target of 5 cents/kW h for average climate and without incentives. Other combinations of cost reductions to reach this target are possible. The ITC is scheduled to phase out for residential systems by 2030, which is why there is no line for Daggett with ITC as in Fig. 6.
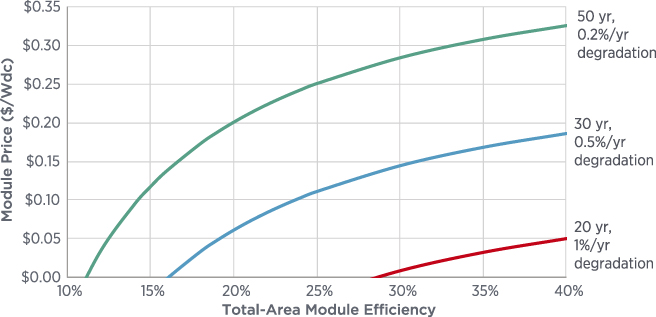
Figures 6 and 7 illustrate one pathway from current costs to the SunShot 2030 PV targets; however, many other combinations of cost reductions could achieve the same goals. A variety of pathways that are possible to achieve LCOE reductions can be illustrated from the perspective of PV module technology pathways. Figure 8 shows the tradeoffs between module price, efficiency, and reliability that can achieve the 2030 cost target of 3 cents/kW h when holding other variables constant. It can be seen that a more efficient module, or one that has a longer lifetime, can cost more than a less efficient or lower lifetime module and still reach the target LCOE. It can also be seen that the case of a 20-year lifetime system with 1%/year performance degradation (i.e., degradation rate) requires a very inexpensive while very efficient module to hit the LCOE target. Any technology pathways that impact other costs, such as BOS costs, will cause a shift in the curves shown in Fig. 8.
iso-LCOE curves showing sets of module price, efficiency, and reliability (i.e., lifetime and degradation rate) that enable the 3 cents/kW h 2030 utility-scale target. All points on each curve hit 3 cents/kW h. Calculations assume 7% weighted average cost of capital, 2.5% inflation rate, $4/kW-yr O&M, and 21% capacity factor. For the 50-year lifetime (green), the total system cost is $0.85/W. The total system cost is $0.69/W and $0.54/W for the blue and red lines, respectively.
While cost reductions remain important, they are no longer the single biggest challenge for PV. Enabling greater PV adoption requires addressing grid integration challenges. As a variable generation source, solar energy is not available at all times of demand for electricity (i.e., it is not available when the sun is not shining) and its availability can vary throughout the day due to changes in the weather and the solar resource. However, through integration with demand side management and storage as well as improvements in the ability to predict solar generation throughout the day, solar-generated power can provide a much better match to electricity load. Another challenge relates to the incorporation of PV generation onto the distribution system. Like other distributed generators, high levels of PV that produce more power than is immediately used can lead to reverse power flows on the distribution system. Advanced inverter capabilities that allow PV systems to support power quality (e.g., through voltage and frequency control) can mitigate some of these challenges and contribute to greater reliability and resilience of the power system.
Grid integration challenges and the synergy between solar and storage
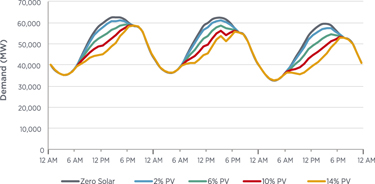
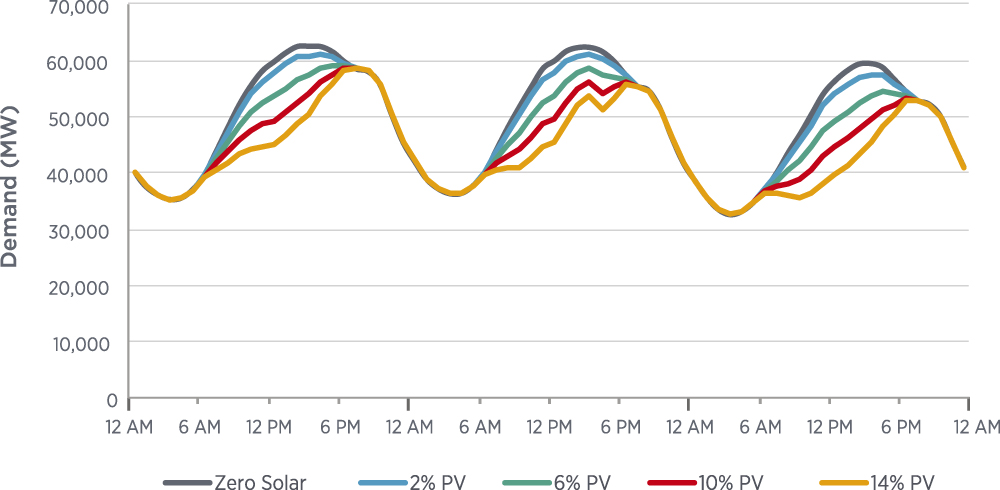
At low deployment levels, solar energy’s availability is typically well-matched to peak electricity demand, and thus electricity from PV has a high energy and high capacity value. As the penetration (i.e., fraction of energy supplied) of PV on the grid increases, however, the value of PV electricity decreases.Reference Mills and Wiser17,Reference Sivaram and Kann18 The capacity value of PV (i.e., the ability of PV to supply electricity during periods of peak demand) drops rapidly as increased PV penetration shifts the net demand peak out to later in the evening during periods of low to no PV output (Fig. 9).Reference Denholm, Clark and O’Connell19 The energy value of PV also drops as penetration increases because new PV competes with less valuable generation resources and because curtailment rates increase as more mid-day generation cannot be used, particularly in the spring. This creates an economic limit to PV deployment, even with very low cost PV, albeit a limit well above current penetration levels in most areas. For example, a study of California found an economic limit for PV of about 20% of electricity supply without changes to grid operation.Reference Denholm, Clark and O’Connell19 In addition, at higher PV penetrations, PV can cause the net electricity load that is met by other electricity generation sources to have steeper ramp rates, as is illustrated by the well-known duck curve, which can provide challenges to grid operators.
Profiles of load (gray, zero solar) and net load (other curves), which is the load profile that remains after the contribution of the load that is met by solar is subtracted, for three high demand days in California in July.Reference Denholm, Clark and O’Connell19 Reprinted with permission from the National Renewable Energy Laboratory. The full report, entitled “On the Path to SunShot: Emerging Issues and Challenges in Integrating High Levels of Solar into the Electrical Generation and Transmission System” is available at www.nrel.gov. This figure may not be used to promote any commercial product or service or to imply an endorsement by NREL, the Alliance for Sustainable Energy, LLC, or the U.S. Department of Energy.
Many options have been proposed or are being deployed that increase the “flexibility” of the grid (i.e., the ability of the grid to accommodate rapid changes in electricity supply and demand) and in turn mitigate the decline in value of PV. These include expanding balancing areas (i.e., the regions in which supply and demand of electricity are balanced), increasing conventional generator ramp rates, and shifting demand of more flexible loads (e.g., air and water heating, air conditioning, and water pumping), as well as using PV to provide grid reliability services.Reference Denholm, Clark and O’Connell19,Reference Gevorgian and O’Neill20 Historically, energy storage has been among the most costly options for increased grid flexibility. However, battery costs have seen significant cost declines in recent years that are projected to continue.Reference Schmidt, Hawkes, Gambhir and Staell21
Cost declines in batteries and other energy storage technologies create significant opportunities for a positive feedback of deployment, greatly increasing the market potential for both PV and storage compared to deployment in isolation. Deploying storage can mitigate the drop in PV value by shifting otherwise curtailed or low value PV to later in the day during demand peaks.
If deployed in isolation, storage also experiences a decrease in value as its penetration increases, limiting its economic potential. Increased storage penetration will change the demand patterns, flattening the net demand for electricity, and eliminating demand peaks. This flattening reduces the value of peak capacity. However, greater penetration of PV reshapes the net demand for electricity, narrowing the net demand profile (Fig. 9) and requiring shorter durations of energy storage to reduce overall peak capacity demands.Reference Denholm, Clark and O’Connell19 This improves the economic potential for storage which could result in greater storage deployment, which in turn provides greater opportunities for PV deployment.
Additional benefits can be achieved by physical integration of solar and storage.Reference Denholm, Eichman and Margolis22 Storage can be co-located with PV, and this can reduce certain engineering, integration, and site development costs. Further cost reductions could be achieved by locating the storage on the DC side of the inverter, eliminating the costs of a second inverter.
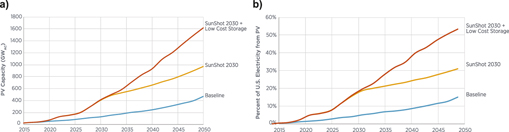
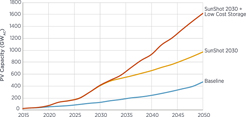
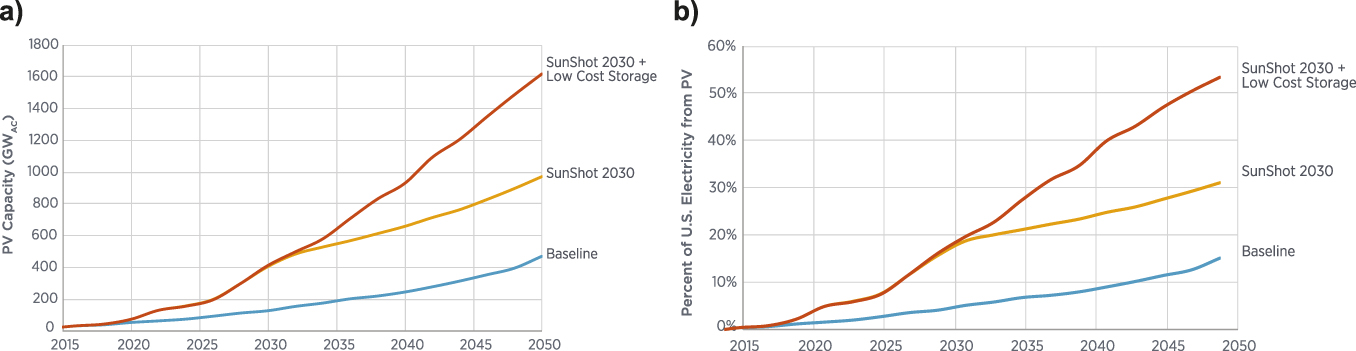
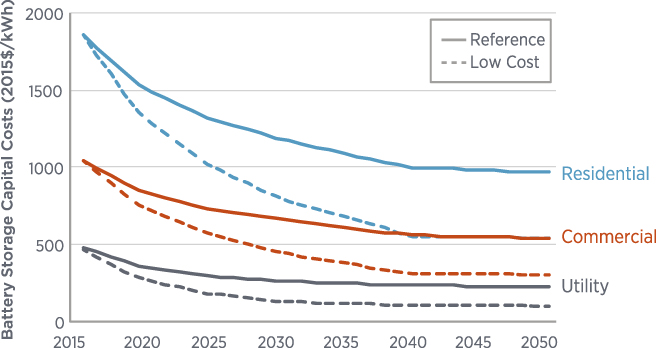
Recent projections from the ReEDS modelReference Cole, Frew, Gagnon, Richards, Sun, Zuboy, Woodhouse and Margolis11 demonstrate the potential impact of low-cost storage on PV deployment and penetration. Figure 10 shows the projected PV deployment in terms of capacity as well as fraction of U.S. electricity supply for a low-battery-cost scenario compared to baseline storage cost assumptions. Figure 11 shows the baseline and low-cost battery storage assumptions used in these projections. Significantly more PV is deployed for the low cost storage scenario (66% additional PV in 2050), showing that low cost storage can enable dramatic increases in PV deployment for the same PV costs. As discussed above, other forms of increasing grid flexibility will also enable greater PV deployment, but low cost energy storage has significant potential to be the largest lever.
PV capacity deployed per year for cases of baseline PV and storage cost assumptions, low cost PV (i.e., SunShot 2030), and low cost PV and low cost storage (i.e., costs as shown in Fig. 11Reference Cole, Marcy, Krishnan and Margolis23) together (a). Fraction of U.S. electricity demand met by PV for the same baseline and low cost cases (b). In the SunShot 2030 cases, utility-scale PV costs decline to reach the 2030 target of 3 cents/kW h and then continue to decline to 2 cents/kW h by 2050, and residential and commercial PV systems have analogous cost reductions. Reprinted with permission from the National Renewable Energy Laboratory. The full report, entitled “SunShot 2030 for Photovoltaics (PV): Envisioning a Low-cost PV Future” is available at www.nrel.gov. This figure may not be used to promote any commercial product or service or to imply an endorsement by NREL, the Alliance for Sustainable Energy, LLC, or the U.S. Department of Energy.
Baseline (solid) and low (dashed) battery capital cost projections for utility, commercial, and residential sectors. The utility-scale batteries are 8-h batteries and the residential and commercial batteries are 3-h batteries.Reference Cole, Marcy, Krishnan and Margolis23 Reprinted with permission from the National Renewable Energy Laboratory. The full report, entitled “Utility-scale Lithium-Ion Storage Cost Projections for Use in Capacity Expansion Models” is available at www.nrel.gov. This figure may not be used to promote any commercial product or service or to imply an endorsement by NREL, the Alliance for Sustainable Energy, LLC, or the U.S. Department of Energy.
The above discussion has focused on the potential benefits of combining PV with energy storage. CSP technology has an inherent ability for coupling with energy storage to realize similar grid integration benefits; however, unlike PV, CSP achieves continued cost reduction with longer-term (e.g., 12 h) storage. Longer-term storage, such as 12 h, could become increasingly important if renewable energy penetration reaches a very significant (>50%) portion of total electricity supply.Reference Fu, Feldman, Margolis, Woodhouse and Ardani14 Ultimately, the benefits of PV and energy storage compared to CSP will depend on the cost points reached by both sets of technologies.Reference Feldman, Margolis, Denholm and Stekli24
The potential for low cost PV
As discussed above (e.g., Fig. 10), achieving the aggressive SunShot 2030 cost reduction targets could lead to significantly more PV deployment compared to baseline expectations; the SunShot 2030 cost targets are roughly half those of the baseline projected costs in 2030. Analysis by Cole et al.Reference Cole, Frew, Gagnon, Richards, Sun, Zuboy, Woodhouse and Margolis11 showed that reaching these targets could more than triple PV deployment by 2030 and more than double deployment by 2050 compared to the baseline case (see Fig. 10). Furthermore, achieving the 2030 cost targets with low-cost storage available could lead to PV deployment in excess of 1600 GWac in 2050, which could serve approximately half of total U.S. electricity demand. Achieving these aggressive cost reductions requires high levels of continued innovation. The remainder of this section discusses what deployment could look like, according to the ReEDS modeling, if the SunShot 2030 cost reduction targets for PV are achieved.
The modeling indicates three stages of PV buildout (Fig. 12). The first stage of build-outs occurs while the solar ITC is still active. The declining costs coupled with the ITC make PV an attractive option. After the step-down or phase-out of the ITC in 2022, PV deployment slows. The second buildout occurs around 2030 as the cost for new PV systems becomes lower than the operating costs of existing generators across many parts of the country, meaning that it is more cost-effective to build a new PV plant than to operate already built generation plants. In the SunShot 2030 scenario, this growth then slows in the mid-2030s as the declining value of PV catches up with deployment. Curtailments and near-zero capacity values reduce the value of new PV systems. The continued deployment through the 2040s occurs to partially replace retiring generators, and as overall electricity demand continues to grow.
Projected annual PV deployment using the ReEDS model for the baseline case (blue), SunShot 2030 PV costs (orange), and SunShot 2030 PV costs with low cost energy storage (gray).Reference Cole, Frew, Gagnon, Richards, Sun, Zuboy, Woodhouse and Margolis11 Reprinted with permission from the National Renewable Energy Laboratory. The full report, entitled “SunShot 2030 for Photovoltaics (PV): Envisioning a Low-cost PV Future” is available at www.nrel.gov. This figure may not be used to promote any commercial product or service or to imply an endorsement by NREL, the Alliance for Sustainable Energy, LLC, or the U.S. Department of Energy.
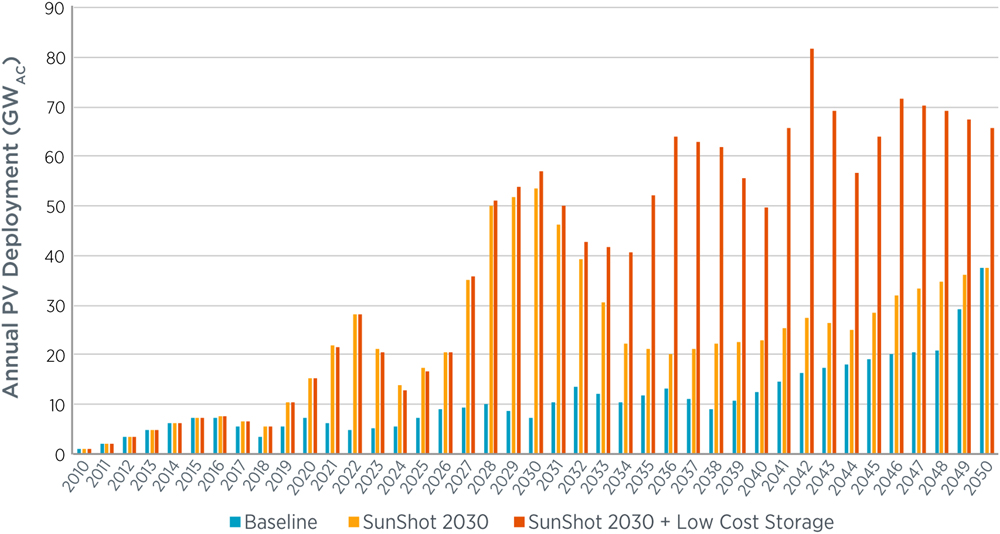
If low-cost storage is available, the slow-down in growth after 2030 is largely eliminated. This is because storage mitigates the declining value of PV by absorbing energy from solar that would have been curtailed during high production hours, and then supplying energy during periods of low or no solar energy production that would otherwise have been provided by other generators. Long-term annual deployment of PV with low-cost storage ranges from 50 to 70 GWac per year.
The buildout of PV shown in Fig. 12 that is enabled by achieving the 2030 cost targets results in PV deployment increasing across the United States. State-level penetration ranges from 3 to 62% across the United States without low-cost storage and 13–81% with low-cost storage.Reference Cole, Frew, Gagnon, Richards, Sun, Zuboy, Woodhouse and Margolis11 Because of the low cost of PV, new PV capacity is not clustered in the highest-quality solar resource areas; instead, it is spread throughout the country.
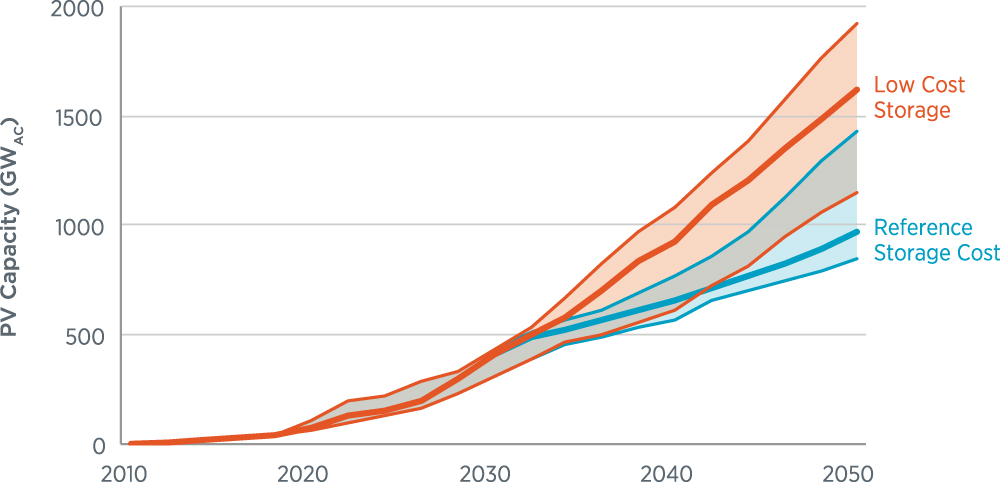
Cole et al.Reference Cole, Frew, Gagnon, Richards, Sun, Zuboy, Woodhouse and Margolis11 also report the range of PV deployment for the SunShot 2030 cost targets under a range of future market conditions that included lower and higher electricity demand growth, lower and higher natural gas prices, accelerated and extended conventional generator lifetimes, lower and higher non-PV renewable energy technology costs, and limitations in the PV supply chain that might restrict the rapid build-out of PV. Across this span of market conditions, which cover many but certainly not a full set of future possibilities, 2030 PV deployment ranges from 307 GWac (13% of electricity demand met by PV) to 435 GWac (18%), and 2050 deployment ranges from 850 GWac (28%) to 1920 GWac (64%). The range is considerably different depending on whether or not low-cost storage is available (see Fig. 13).
Sensitivity analysis of projected PV capacities by year for a range of market conditions. In all cases, PV costs are for the SunShot 2030 scenario. The gray data are for baseline storage costs and orange is the low-cost storage scenario.Reference Cole, Frew, Gagnon, Richards, Sun, Zuboy, Woodhouse and Margolis11 Reprinted with permission from the National Renewable Energy Laboratory. The full report, entitled “Utility-scale Lithium-Ion Storage Cost Projections for Use in Capacity Expansion Models” is available at www.nrel.gov. This figure may not be used to promote any commercial product or service or to imply an endorsement by NREL, the Alliance for Sustainable Energy, LLC, or the U.S. Department of Energy.

Reaching these high levels of PV capacity through aggressive reductions in PV LCOE leads to a variety of impacts on the electricity sector. Electricity prices, system costs, CO2 emissions, and water withdrawals and consumption are all reduced. Transmission capacity increases slightly with the higher PV penetrations.Reference Cole, Frew, Gagnon, Richards, Sun, Zuboy, Woodhouse and Margolis11
The high penetration levels of PV lead to a number of outstanding questions including the impacts on distributed grids, the validity of current utility business models, the impacts on overall electricity consumption, the challenges of having a large fraction of generators be inverter-based, the impact on land use, and the impact on jobs. These issues may be addressed through continued advances in grid integration technology as well as overcoming market barriers.
Conclusion
The past decade has been a time of tremendous advancement for the solar industry. PV system costs have fallen by a factor of 6 and deployment has increased nearly two orders of magnitude, making solar energy a notable electricity source. Yet solar is expected to play an increasingly important role in our energy system going forward. Baseline projections are for solar to supply 5% of U.S. electricity by 2030 and more than 10% by 2050. With increased grid flexibility and more aggressive cost declines in solar and synergistic technologies like energy storage, solar power has the potential to supply a much greater share of U.S. electricity, including the potential to supply more than one-quarter to one-half of U.S. electricity by 2050. While the actual deployment level of solar energy technologies depends on many additional factors, such as the future prices of other electric generation technologies, the rate of change of electricity demand, and policy drivers, the momentum gained during the past decade and prospect for continued advances make it likely that solar will play a significant role in the future electricity mix.
Acknowledgment
We would like to thank Paul Basore for his contributions to the iso-LCOE modeling (Fig. 8).