


1. Introduction
The pulmonary airways are a branching tubular network internally coated with a bi-layer liquid film. The liquid film is susceptible to small perturbations that initiate the Plateau–Rayleigh instability driven by surface tension. When the liquid thickness exceeds a critical value, or the lung volume is below the closing volume, this instability can form liquid plugs occluding the distal airways, and this phenomenon is termed airway closure. Airway closure can occur when the surface tension is too high, airway radii are too narrow, or the liquid film is too thick. These conditions can be met in small airways of a normal lung during expiration, and also in larger airways in pathological conditions, such as respiratory distress syndrome, asthma or pulmonary oedema (Halpern et al. Reference Halpern, Fujioka, Takayama and Grotberg2008). One consequence of airway closure is that the mechanical stresses on the airway wall may reach significant levels (Bian et al. Reference Bian, Tai, Halpern, Zheng and Grotberg2010; Tai et al. Reference Tai, Bian, Halpern, Zheng, Filoche and Grotberg2011; Romanò et al. Reference Romanò, Fujioka, Muradoglu and Grotberg2019, Reference Romanò, Muradoglu, Fujioka and Grotberg2021). These repeated and high stresses are a potential source of injury for the epithelial cells lining the airway wall (Kay et al. Reference Kay, Bilek, Dee and Gaver2004; Huh et al. Reference Huh, Fujioka, Tung, Futai, Paine, Grotberg and Takayama2007). If the airway stiffness is much larger than the surface tension, which is the case in larger airways, then wall deformations are negligible, so the airway closure results in ‘film collapse’ (Kamm & Schroter Reference Kamm and Schroter1989). Another consequence of the instability may be ‘compliant collapse’, which occurs due to the fluid-elastic interactions of the liquid lining and the airway wall, causing the structural instability of the airway cross-section that leads to a multilobed collapse of the airway wall (Kamm & Schroter Reference Kamm and Schroter1989).
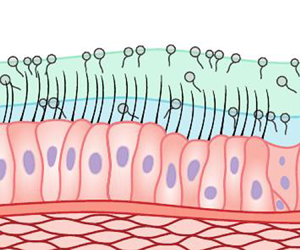
The airways are lined with a two-layer liquid film inside, named the airway surface liquid (ASL), for approximately the first 15 generations (Grotberg Reference Grotberg2011), where the top layer is mucus and the sublayer is serous, also called the periciliary liquid (PCL) (Widdicombe et al. Reference Widdicombe, Bastacky, Wu and Lee1997). On the other hand, the lower airways are covered with a monolayer serous whose properties are comparable to those of water. These distal airways lack cartilaginous support and their ASL may include a layer of surfactant (Bustamante-Marin & Ostrowski Reference Bustamante-Marin and Ostrowski2017), which reduces the surface tension (Grotberg Reference Grotberg2011). The serous layer is assumed to be Newtonian, but there are also indications that its weakly non-Newtonian behaviour might be significant (Randell & Boucher Reference Randell and Boucher2006; Boucher Reference Boucher2007). It plays an essential role for the mucociliary clearance (MCC) system as it maintains the ciliary beating owing to its chemical and physical characteristics. Moreover, it acts as a lubricant for the sliding mucus layer on it (Button et al. Reference Button, Cai, Ehre, Kesimer, Hill, Sheehan, Boucher and Rubinstein2012). On the other hand, it is well known that the airway mucus exhibits highly non-Newtonian characteristics (Lai et al. Reference Lai, Wang, Wirtz and Hanes2009; Balmforth, Frigaard & Ovarlez Reference Balmforth, Frigaard and Ovarlez2014). The mucus fluid mostly consists of water and mucins that are high-molecular-weight glycoproteins and responsible for the non-Newtonian characteristics of the airway mucus (Williams et al. Reference Williams, Sharafkhaneh, Kim, Dickey and Evans2006). Unlike the PCL, the physical properties of mucus can change a great deal depending on various factors, including age, nutrition, health conditions and shear rate (Lai et al. Reference Lai, Wang, Wirtz and Hanes2009; Lee et al. Reference Lee, Jayathilake, Tan, Le, Lee and Khoo2011). Owing to very different mechanical behaviours of serous and mucus fluids, single-layer models based on homogenization of fluid properties fail to capture the actual dynamics of airway closure, which is the main motivation of the present study.
Airway closure occurs in small airways towards the end of exhalation, when airways attain their smallest volume as shown histologically (Hughes, Rosenzweig & Kivitz Reference Hughes, Rosenzweig and Kivitz1970) and by breathing experiments (Burger & Macklem Reference Burger and Macklem1968; Engel, Grassino & Anthonisen Reference Engel, Grassino and Anthonisen1975). This results in ventilation inequalities across the lung (Crawford et al. Reference Crawford, Cotton, Paiva and Engel1989) and depends on several factors such as gender (Bode et al. Reference Bode, Dosman, Martin, Ghezzo and Macklem1976), age (Anthonisen et al. Reference Anthonisen, Danson, Robertson and Ross1969; Mansell, Bryan & Levison Reference Mansell, Bryan and Levison1972), sleeping cycle (Appelberg et al. Reference Appelberg, Pavlenko, Bergman, Rothen and Hedenstierna2007) or anaesthesia (Rothen et al. Reference Rothen, Sporre, Engberg, Wegenius and Hedenstierna1998). The airways in the lower regions of the lung are more prone to liquid plug formation because they are smaller in diameter than the upper ones (Grotberg Reference Grotberg2011). Mechanical ventilation at low lung volumes is also a cause of repetitive airway closure and reopening (Slutsky, Ranieri & Fothergill Reference Slutsky, Ranieri and Fothergill2013).
Pulmonary diseases are another important factor that may lead to airway closure, since they cause a decline in surfactant activity, an increase in airway liquid volume, or a decrease in radii of the airways, leading therefore to an increase of the film-thickness-to-airway-radius ratio (Grotberg Reference Grotberg2011). Surfactants lining the alveolar surface are secreted by type II pneumocytes, and they are transferred to the upper parts of the lung (Podgórski & Gradoń Reference Podgórski and Gradoń1990; Hermans et al. Reference Hermans, Bhamla, Kao, Fuller and Vermant2015). These molecules have several important functions in the lung, such as regulation of surface tension, maintenance of the alveolar fluid balance and host defence (Fehrenbach Reference Fehrenbach2001). They also induce the Marangoni stresses at the surface, which have a stabilizing effect against airway closure (Halpern et al. Reference Halpern, Fujioka, Takayama and Grotberg2008) and decrease the mechanical stresses during liquid plug propagation and airway reopening (Muradoglu et al. Reference Muradoglu, Romanò, Fujioka and Grotberg2019). However, their activity may be compromised due to diseases such as acute respiratory distress syndrome (ARDS) (Gregory et al. Reference Gregory, Longmore, Moxley, Whitsett, Reed, Fowler, Hudson, Maunder, Crim and Hyers1991; Lewis & Jobe Reference Lewis and Jobe1993), viral bronchiolitis (Tibby et al. Reference Tibby, Hatherill, Wright, Wilson, Postle and Murdoch2000) and cystic fibrosis (CF) (Griese et al. Reference Griese, Essl, Schmidt, Rietschel, Ratjen, Ballmann and Paul2004). Surfactant deficiency or loss of its functionality increases the stiffness of the lungs and reduces the protective property of the surfactants during airway closure, liquid plug propagation and airway reopening. Increased liquid volume in airways, which might be due to pneumonia (Lewis Reference Lewis1980), chronic obstructive pulmonary disease (COPD) (Williams et al. Reference Williams, Sharafkhaneh, Kim, Dickey and Evans2006) or CF (Boucher Reference Boucher2007), is also a condition that can facilitate liquid plug formation. Furthermore, Williams et al. (Reference Williams, Sharafkhaneh, Kim, Dickey and Evans2006) and Veen et al. (Reference Veen, Beekman, Bel and Sterk2000) stated that asthma can both increase the liquid volume and decrease the airway radii. These examples demonstrate that airway closure is closely related to pathological conditions within the lungs, so understanding this phenomenon may be instrumental for the development of more sophisticated treatment modalities aiming to decrease closure frequency and resulting wall mechanical stresses.
Beside its possible detrimental effects for the pulmonary epithelium due to high mechanical stresses, airway closure also plays a major role in the transmission of respiratory infectious diseases, such as COVID-19 (Bake et al. Reference Bake, Larsson, Ljungkvist, Ljungström and Olin2019). Depending on physiological and environmental conditions such as humidity and temperature, a turbulent gas cloud and pathogen-bearing droplets from a human sneeze can travel up to 7–8 m in the air (Bourouiba Reference Bourouiba2020). Mittal, Ni & Seo (Reference Mittal, Ni and Seo2020) pointed out two mechanisms that are related to respiratory droplet formation from the fluid film of the pulmonary airways. The first one is the instability induced by the shear forces during breathing on the mucus lining (Moriarty & Grotberg Reference Moriarty and Grotberg1999). The second mechanism is the reopening of the closed airway lumen. The correlation between airway closure and subsequent reopening and aerosol generation has been established through the works of Almstrand et al. (Reference Almstrand, Bake, Ljungström, Larsson, Bredberg, Mirgorodskaya and Olin2010), Johnson & Morawska (Reference Johnson and Morawska2009) and Haslbeck et al. (Reference Haslbeck, Schwarz, Hohlfeld, Seume and Koch2010). Hence it appears that factors that accelerate airway closure also facilitate aerosol generation and disease transmission. However, it should be noted that in this study, we focus on high wall mechanical stresses due to airway closure, rather than modelling aerosol generation and transmission.
A liquid plug formed after airway closure disturbs airway epithelial cells also during its propagation and rupture, which has been studied extensively both numerically and experimentally in the literature. Fujioka & Grotberg (Reference Fujioka and Grotberg2004) investigated the effects of plug propagation speed and plug length on steady plug propagation, and found that plug propagation induces a large increase in wall shear stress and pressure. In Fujioka & Grotberg (Reference Fujioka and Grotberg2005), they included the effects of surfactant and demonstrated that surfactant provides protection for the epithelial cells by reducing the mechanical stresses significantly. The relationship between liquid plug propagation and the flexible nature of the airways has been explored by Zheng et al. (Reference Zheng, Fujioka, Bian, Torisawa, Huh, Takayama and Grotberg2009) numerically and experimentally. They found that the mechanical stresses and stress gradients are reduced by slight wall deformations, but stress gradients are enhanced substantially on highly deformable walls. Muradoglu et al. (Reference Muradoglu, Romanò, Fujioka and Grotberg2019) studied the whole plug propagation and rupture phases computationally for both the clean and contaminated cases, and confirmed the protective effects of surfactant for epithelial cells. Non-Newtonian viscoplastic features of pulmonary mucus are taken into account by Hu, Romanò & Grotberg (Reference Hu, Romanò and Grotberg2020) in a three-dimensional simplified configuration incorporating the Herschel–Bulkley model. They deduced that the yield stress decelerates the rupture process, but its variation has a little effect on the wall shear stresses. It is highly likely that the two-layer structure of ASL also influences plug propagation and rupture processes.
In their experimental studies, Bilek, Dee & Gaver (Reference Bilek, Dee and Gaver2003), Huh et al. (Reference Huh, Fujioka, Tung, Futai, Paine, Grotberg and Takayama2007) and Tavana et al. (Reference Tavana, Zamankhan, Christensen, Grotberg and Takayama2011) examined liquid plug propagation and rupture, and subsequent airway reopening, in both the surfactant-laden and clean environments, and quantified the cellular injury. They showed that mechanical stresses and their gradients can reach fatal levels for airway epithelial cells during these processes. Moreover, it is demonstrated that even repeated exposure to a stress, whose strength is not high enough to cause damage in a single occurrence, can be detrimental to these cells (Kay et al. Reference Kay, Bilek, Dee and Gaver2004). Recently, Grotberg (Reference Grotberg2019) has highlighted that the airway closure and subsequent reopening themselves can be a source of damage for the pulmonary epithelium.
The first studies about the stability of liquid-lined tubes date back to the pioneering works of Goren (Reference Goren1962) and Goldsmith & Mason (Reference Goldsmith and Mason1963). Then Everett & Haynes (Reference Everett and Haynes1972) introduced the critical film thickness notion and studied it by using thermodynamic principles. In order to predict plug formation, Hammond (Reference Hammond1983) and Gauglitz & Radke (Reference Gauglitz and Radke1988) tracked the interface by using different forms of the Young–Laplace equation, and the latter estimated the critical thickness for a clean interface and a single-layer liquid film in a rigid pipe as  $h_c^*/a^*\approx 0.12$, where $h_c^*$ is the critical thickness of the liquid film and $a^*$ is the radius of the pipe. Halpern & Grotberg (Reference Halpern and Grotberg1992) developed a thin film model to examine the effects of airway wall elasticity on airway closure, and they also added effects of surfactant to their model later (Halpern & Grotberg Reference Halpern and Grotberg1993). They found that the critical film thickness, $h_c^*/a^*$, decreases with increasing wall compliance, which is a measure of the lung's stretching and expanding capability, while it increases with the addition of surfactant to the system. Heil, Hazel & Smith (Reference Heil, Hazel and Smith2008) studied the scenarios where an airway might experience a non-axisymmetric collapse due to a fluid-elastic instability. In such cases, the airway volume is reduced greatly, while a small central air core can still remain open, so gas exchange continues although it is substantially diminished. However, they stated that for large values of film thickness or surface tension, the airway can also collapse completely. The interaction between the core flow and the more viscous liquid film is taken into account by Halpern & Grotberg (Reference Halpern and Grotberg2003). They found that the instability can be saturated in a nonlinear fashion by the oscillation of the core flow. Halpern, Fujioka & Grotberg (Reference Halpern, Fujioka and Grotberg2010) examined the effects of mucus viscoelasticity on the closure time and mechanical stresses by using a lubrication approximation, but they considered only pre-coalescence dynamics due to limitations of the lubrication model. The experimental and numerical works of Bian et al. (Reference Bian, Tai, Halpern, Zheng and Grotberg2010) and Tai et al. (Reference Tai, Bian, Halpern, Zheng, Filoche and Grotberg2011), respectively, investigated the flow field and wall shear stress during airway closure. They concluded that the mechanical stresses may reach dangerous levels for the airway epithelium. Song (Reference Song2015) studied the stability of a two-layer Newtonian and immiscible liquid film lining a flexible tube, where the air–mucus interface includes insoluble surfactants, in pre-coalescence phase. The results indicated that surfactants stabilize the system by decreasing the surface tension and introducing a surface stress, but the wall compliance has an accelerating effect on the formation of the liquid plug. In a recent study, Romanò et al. (Reference Romanò, Fujioka, Muradoglu and Grotberg2019) carried out a numerical investigation including the post-coalescence dynamics. They found that the bi-frontal plug growth, occurring just after the topological change, is responsible for the high peaks of both wall shear stress and pressure as well as their gradients, resulting in a potentially lethal or sub-lethal response of the epithelial cells. In a similar setting, Romanò et al. (Reference Romanò, Muradoglu, Fujioka and Grotberg2021) modelled the one-layer liquid as an Oldroyd-B fluid and illustrated the effects of the viscoelasticity on airway closure. They observed a second peak of the wall shear stresses that can be as high as the first one after the coalescence due to an elasto-inertial instability.
The two-layer structure of the liquid lining has been neglected in previous studies, and the liquid film is assumed to contain a homogeneous fluid whose properties are usually determined as a weighted average of the mucus and serous layers using a homogenization procedure (Romanò et al. Reference Romanò, Fujioka, Muradoglu and Grotberg2019), i.e. the viscosity of the one-layer model is taken as the volume-averaged value of the mucus and serous fluid viscosities of the corresponding two-layer model. In this study, we build on our previous work (Romanò et al. Reference Romanò, Fujioka, Muradoglu and Grotberg2019), where we studied the airway closure problem by modelling the ASL as a monolayer Newtonian fluid, and we investigate computationally the effects of the two-layer structure of the liquid film on liquid plug formation in airways using a front-tracking method. We simulate the entire airway closure process, including the pre- to post-coalescence phases, by varying the flow parameters in the ranges of physiological relevance for adult human airways, and focus on the effects of the existence of the second layer on the closure time and mechanical stresses in comparison with the results obtained for the one-layer model. In addition, a linear stability analysis is performed for the two-layer case using the lubrication approximation in the thin film limit, and the results are found to be in good qualitative agreement with the computational simulations. Note that pulmonary surfactants, the non-Newtonian characteristics of the airway mucus, and the fluid–structure interactions are not included in the model to isolate the effects of the second layer.
The rest of the paper is organized as follows. The mathematical formulation and the numerical method are discussed in § 2. The problem is described, including the computational domain, initial and boundary conditions, and parameter intervals, in § 3. In § 4, a linear stability analysis is performed and a parametric study is conducted based on the dispersion relation. The simulation results are presented and discussed in § 5. Finally, a brief summary of the main findings is given in § 6.
2. Formulation and numerical method
The governing equations are described in the context of the finite-difference/front-tracking method (Unverdi & Tryggvason Reference Unverdi and Tryggvason1992). In this approach, a single set of incompressible Navier–Stokes equations is written for the whole computational domain. The effects of surface tension are included as a body force in the momentum equations, and the jumps in the material properties across the interfaces are taken into account using an indicator (colour) function. The equations are solved in their dimensional forms, and the dimensional quantities are denoted by a superscript ’ $^{*}$’. However, the results are presented in terms of non-dimensional quantities. In the front-tracking framework, the Navier–Stokes equations are written as
 $$\begin{gather} \frac{ \partial{\rho^{*} \boldsymbol{u}^*} }{ \partial{t^*} } + \boldsymbol{\nabla}^*\boldsymbol{\cdot} \left(\rho^*\boldsymbol{u}^*\boldsymbol{u}^*\right) ={-}\boldsymbol{\nabla}^*p^* + \boldsymbol{\nabla}^*\boldsymbol{\cdot}\mu^*\left(\boldsymbol{\nabla}^*\boldsymbol{u}^* + \boldsymbol{\nabla}^*{\boldsymbol{u}^*}^T\right)\nonumber\\ + \int_{A^*}{\sigma^*\kappa^*\boldsymbol{n}\,\delta\left(\boldsymbol{x}^* - \boldsymbol{x}_f^*\right)\,{\rm d}A^*}, \end{gather}$$
where  $t^*$ is the time, $\boldsymbol {u}^*$ is the velocity vector, $p^*$ is the pressure field, $\rho ^*$ and $\mu ^*$ are the discontinuous density and viscosity fields, respectively, and $A^*$ is the surface area. The effect of the surface tension is represented as a body force in the last term on the right-hand side, where $\sigma ^*$ is the surface tension coefficient, $\kappa ^*$ is twice the mean curvature, and $\boldsymbol {n}$ is a unit vector normal to the interface. The surface tension acts only on the interface as indicated by the Dirac delta function $\delta$, whose arguments $\boldsymbol {x^*}$ and $\boldsymbol {x}_f^*$ are the points at which the equation is evaluated and the point at the interface, respectively. The gravitational effects are negligible within the asymptotic limit of a negligible static Bond number, i.e. $Bo= g^* {a^*}^2\Delta \rho _{a - m}^*/\sigma _{a - m}^* \ll 1$, where $g^*$ is the gravitational acceleration, $\Delta \rho _{a - m}^*$ is the difference between mucus and air densities, and $\sigma _{a - m}^*$ is the air-to-mucus surface tension. Since the airway flows of interest in the present study fall in such a regime, the gravitational effects are neglected in (2.1).
The flow is assumed to be incompressible, so the mass conservation equation is given as
 \begin{equation} \boldsymbol{\nabla}^*\boldsymbol{\cdot}\boldsymbol{u}^* = 0. \end{equation}
Also, it is assumed that the material properties remain constant following a fluid particle, i.e.
 \begin{equation} \frac{{\rm D}\rho^*}{{\rm D} t^* }=0,\quad \frac{ {\rm D}\mu^*}{ {\rm D} t^* }=0, \end{equation}
where  ${\rm D}/{\rm D}t^* = (\partial /\partial t^*) + \boldsymbol {u}^* \boldsymbol {\cdot } \boldsymbol {\nabla }^*$ is the material derivative. The material properties $\rho ^*$ and $\mu ^*$ vary discontinuously across the interfaces and are given by
 \begin{gather} \rho^* = \left\{ \begin{array}{@{}ll} \rho_m^*\,I(r,z,t) + \rho_s^*\left[1-I(r,z,t)\right], & I(r,z,t) \le 1.0, \\ \rho_a^*\left[I(r,z,t)-1\right] + \rho_m^*\left[2-I(r,z,t)\right], & \text{otherwise}, \end{array} \right. \end{gather}
 \begin{gather} \mu^* = \left\{ \begin{array}{@{}ll} \mu_m^*\,I(r,z,t) + \mu_s^*\left[1-I(r,z,t)\right], & I(r,z,t) \le 1.0, \\ \mu_a^*\left[I(r,z,t)-1\right] + \mu_m^*\left[2-I(r,z,t)\right], & \text{otherwise}, \end{array} \right. \end{gather}
where the subscripts ‘ $m$’, ‘ $s$’ and ‘ $a$’ denote the properties of the mucus, serous and air, respectively, and $I$ is the indicator (colour) function defined as
 \begin{equation} I(r,z,t) = \left\{ \begin{array}{@{}ll} \text{2 in the air core}, \\ \text{1 in the mucus layer}, \\ \text{0 in the serous layer}. \end{array} \right. \end{equation}
In (2.4) and (2.5), the values of the material properties, density and viscosity, are distributed in the computational domain depending on the indicator function, whose value changes across the fluid phases according to (2.6).
The mass transfer due to the evaporation of water content of the mucus, as well as the replenishment, with water, of the mucus layer by epithelial cells and transport by cilia beating, are ignored, so the total mass of each phase is assumed to be conserved.
The flow equations are solved using the front-tracking/finite-difference method (Unverdi & Tryggvason Reference Unverdi and Tryggvason1992). In this method, the flow equations (2.1) and (2.2) are solved on a stationary staggered Eulerian grid while the interface is tracked by a Lagrangian grid. The spatial derivatives are approximated using central differences, and the projection method developed by Chorin (Reference Chorin1968) is used to perform the time integration. The method is first-order accurate in time, but second-order accuracy can be obtained easily by a predictor-corrector method (Tryggvason et al. Reference Tryggvason, Bunner, Esmaeeli, Juric, Al-Rawahi, Tauber, Han, Nas and Jan2001). However, as noted by Muradoglu et al. (Reference Muradoglu, Romanò, Fujioka and Grotberg2019), due to the small time step required by the stability conditions, the time-stepping error is small compared to the spatial error in all the flow conditions of interest for this study.
A Lagrangian grid, formed by marker points, is used to represent the air–mucus and serous–mucus interfaces. A piece between two marker points is called a front element. At each time step, marker points move with the flow velocity interpolated from the stationary Eulerian grid. Also, surface tension is calculated at the centroid of front elements using a third-order Legendre polynomial fit and distributed smoothly onto Eulerian grid points. The information exchange between the Eulerian and Lagrangian grids is accomplished using Peskin's cosine distribution function (Peskin Reference Peskin1977). The surface tension, distributed onto Eulerian grid points, is added to the momentum equations as a body force, as described by Tryggvason et al. (Reference Tryggvason, Bunner, Esmaeeli, Juric, Al-Rawahi, Tauber, Han, Nas and Jan2001).
The Lagrangian grid should be neither too coarse nor too dense in order to avoid inaccuracies or numerical instabilities, respectively. In fact, the former decreases the resolution of the interface due to large elements, and the latter causes unwanted wiggles due to small elements. Therefore, it is important to keep the element sizes comparable to the stationary Eulerian grid size. At each time step, the front is restructured by deleting the elements that are smaller than the prespecified lower limit, and splitting the elements that are larger than the prespecified maximum limit by adding a new point. While adding or deleting a front element, the curvature of the interface is taken into account by using a third-order Legendre interpolation.
The material properties,  $\rho ^*$ and $\mu ^*$, are determined at each time step using the same procedure as described by Tryggvason et al. (Reference Tryggvason, Bunner, Esmaeeli, Juric, Al-Rawahi, Tauber, Han, Nas and Jan2001). For this purpose, unit magnitude jumps are first calculated at the centre of the front elements based on the locations of the marker points, and are then distributed smoothly onto the Eulerian grid. Taking the divergence of the distributed unit jumps results in a separable Poisson equation. Finally, the Poisson equation is solved to determine the indicator function in the entire computational domain. Once the indicator function is known, the material properties are updated according to (2.4) and (2.5). Then the integration is performed using the projection method to calculate the velocity and pressure fields at the new time step.
The flow equations are solved using non-uniform tensor-product structured grids. As the instability grows, more liquid is drained from the film region and pumped into the bulge, resulting in a very thin liquid film, especially in the vicinity of the capillary wave. Thus the grid is stretched near the wall to resolve the flow in the film region.
Unlike some other one-field approaches, such as the volume-of-fluid and level-set methods, topological changes, i.e. breakup and coalescence, are not handled automatically and must be done explicitly in the front-tracking method (see Tryggvason, Scardovelli & Zaleski Reference Tryggvason, Scardovelli and Zaleski2011). In the present simulations, the topological change is achieved using the procedure established by Olgac, Kayaalp & Muradoglu (Reference Olgac, Kayaalp and Muradoglu2006). In this method, the minimum distance between the interfaces and the symmetry axis is monitored at each time step. When the distance is less than a prespecified threshold value,  $l_{th}$, the front element that is closest to the symmetry axis is deleted and the interface is merged to the symmetry axis. In this study, $l_{th}=1.5\Delta r$ is chosen, where $\Delta r$ is the grid size in the radial direction at the centreline. The effect of $l_{th}$ on the results is checked, and it is found that the results are insensitive to this parameter as long as it is of the order of the grid size. We note that the rupture of the serous layer is not allowed in the present simulations because in our parameter space, the air–mucus surface tension drives the instability, and the serous thickness is generally much lower than the mucus thickness. Therefore, a coalescence of the serous–mucus interfaces is not expected. However, in § 5.6, the coalescence of the serous–mucus and air–mucus interfaces is examined.
More details about the front-tracking method can be found in Unverdi & Tryggvason (Reference Unverdi and Tryggvason1992), Tryggvason et al. (Reference Tryggvason, Bunner, Esmaeeli, Juric, Al-Rawahi, Tauber, Han, Nas and Jan2001) and Tryggvason et al. (Reference Tryggvason, Scardovelli and Zaleski2011). The method has been used successfully by Muradoglu et al. (Reference Muradoglu, Romanò, Fujioka and Grotberg2019) to model liquid plug propagation and rupture in the presence of a soluble surfactant. Furthermore, the method has also been validated by Romanò et al. (Reference Romanò, Fujioka, Muradoglu and Grotberg2019) against the volume-of-fluid (VOF) method implemented in basilik (Popinet Reference Popinet2014, http://basilisk.fr) for a one-layer airway closure case.
3. Problem statement
A schematic of the problem is depicted in figure 1. The flow is assumed to be symmetric about the axis of the channel, so the computational domain has length  $L_z^*$ in the axial direction and $a^*$ in the radial direction. The liquid layers, whose undisturbed film thicknesses are $h_s^*$ for the serous layer and ( $h_m^*-h_s^*$) for the mucus layer, are surrounded by air at the core of the channel. The liquid layers are modelled as Newtonian fluids with constant material properties. The air–mucus and serous–mucus surface tensions are $\sigma _{a - m}^*$ and $\sigma _{s - m}^*$, respectively. The subscripts ‘ $m$’, ‘ $s$’, ‘ $a - m$’ and ‘ $s - m$’ denote the properties of the mucus, the serous, the air–mucus interface and the serous–mucus interface, respectively. The airway wall is assumed to be rigid, and the no-slip boundary conditions are applied there. The computational domain is periodic at $z^*=0$ and $z^*=L_z^*$. The fluid interfaces are perturbed from their initial thicknesses to initiate the instability, so their initial radial locations are specified as
 \begin{equation} \left. \begin{aligned} r^* & = R_I^* = a^* - h_m^*\left[1-0.1 \times \cos\left(2 {\rm \pi}z^* / L_z^*\right)\right], \\ r^* & = R_{II}^* = a^* - h_s^*\left[1-0.1 \times \cos\left(2 {\rm \pi}z^* / L_z^*\right)\right], \end{aligned} \right\} \end{equation}
where  $R_I^*$ and $R_{II}^*$ are the radial locations of the air–mucus and serous–mucus interfaces, respectively.
(a) Schematic illustration of part of an airway. (b) Schematic of the computational model. The core fluid is air. The rigid tube is axisymmetric, coated by a two-layer Newtonian fluid inside, and has radius  $a^*$ and length $L_z^*$. The bottom fluid layer is serous (blue) and the top fluid layer is mucus (green), and their undisturbed thicknesses are $h_s^*$ and ( $h_m^* - h_s^*$), respectively. $\sigma _{s - m}^*$ and $\sigma _{a - m}^*$ are the serous–mucus and air–mucus surface tension coefficients, respectively. The radial locations of the air–mucus and serous–mucus interfaces are denoted by $R_I^*$ and $R_{II}^*$, respectively.

The results are presented in non-dimensional form using the capillary scaling, i.e. by non-dimensionalizing length, time, velocity and stresses by  $a^*$, $\mu _m^*a^*/\sigma _{a - m}^*$, $\sigma _{a - m}^*/\mu _m^*$ and $\sigma _{a - m}^*/a^*$, respectively. The relevant non-dimensional parameters for this study can be summarized as
 \begin{equation} \left. \begin{aligned}
La & = \frac{\rho_m^* \sigma_{a - m}^*
a^*}{{\mu_m^*}^2}, \quad \rho=\frac{\rho_m^*}{\rho_s^*},
\quad \mu=\frac{\mu_m^*}{\mu_s^*}, \quad
\sigma=\frac{\sigma_{s - m}^*}{\sigma_{a - m}^*},
\\ \epsilon_m & =\frac{h_m^* - h_s^*}{a^*}, \quad
\epsilon_s=\frac{h_s^*}{a^*}, \quad
\epsilon=\frac{\epsilon_m}{\epsilon_s}, \quad
\lambda=\frac{L_z^*}{a^*}, \end{aligned} \right\}
\end{equation}
\begin{equation} \left. \begin{aligned}
La & = \frac{\rho_m^* \sigma_{a - m}^*
a^*}{{\mu_m^*}^2}, \quad \rho=\frac{\rho_m^*}{\rho_s^*},
\quad \mu=\frac{\mu_m^*}{\mu_s^*}, \quad
\sigma=\frac{\sigma_{s - m}^*}{\sigma_{a - m}^*},
\\ \epsilon_m & =\frac{h_m^* - h_s^*}{a^*}, \quad
\epsilon_s=\frac{h_s^*}{a^*}, \quad
\epsilon=\frac{\epsilon_m}{\epsilon_s}, \quad
\lambda=\frac{L_z^*}{a^*}, \end{aligned} \right\}
\end{equation}
where  $La$ is the Laplace number, which represents the relative importance of the surface tension over the viscous effects, $\epsilon _m$ and $\epsilon _s$ are the non-dimensional film thicknesses of the undisturbed mucus and serous layers, respectively, $\rho$, $\mu$, $\sigma$ and $\epsilon$ are the density ratio, viscosity ratio, surface tension ratio and film thickness ratio, respectively, and $\lambda$ is the airway tube's length-to-radius ratio.
The parameters are selected in such a way that they represent a typical adult human lung airway. Considering the branching structure of the human lungs (Weibel & Gomez Reference Weibel and Gomez1962), airways become small enough to observe airway closure from the ninth or tenth generation on, depending on factors such as age, gender and health (Burger & Macklem Reference Burger and Macklem1968; Breatnach, Abbott & Fraser Reference Breatnach, Abbott and Fraser1984). Accordingly, in this study, ninth-to-tenth generation of a typical human adult lung is considered, so the airway radius is fixed at  $a^* =0.058$ cm (Crystal Reference Crystal1997), and the length-to-radius aspect ratio is $\lambda = 6$ (Kitaoka, Takaki & Suki Reference Kitaoka, Takaki and Suki1999).
The inner wall of the airways is lined with a liquid that consists of two layers for the first 15 generations or so, and one layer afterwards (Grotberg Reference Grotberg2011). According to Guo & Kanso (Reference Guo and Kanso2017), for typical adult human lungs, the length of the cilia is  $h_{cilia}^*\approx 10^{-3}$ cm, and the total ASL thickness is $h_{m}^* + h_{s}^* \approx 2h_{cilia}^*$. The depth of the serous layer is considered to be 40–80 % of the cilia length, for depleted state and healthy conditions, respectively. Therefore, for the base case in our simulations, the mucus-to-serous-layers thickness ratio is taken as $\epsilon =3$. The total ASL thickness is varied as $(\epsilon _m+\epsilon _s)\in [0.15, 0.35]$ to represent pathological conditions of an adult human lung.
In this study, we model the serous layer as a Newtonian fluid whose density and viscosity are  $\rho _s^*=1000\,{\rm kg}\,{\rm m}^{-3}$ and $\mu _s^* = 10^{-3}$ Pa s, respectively. As pointed out by Romanò et al. (Reference Romanò, Fujioka, Muradoglu and Grotberg2019), the densities of the mucus and serous layers are about the same, so we take $\rho _m^* = \rho _s^*$. In all of the simulations, we use $\rho _m^*=\rho _s^*=1000\,{\rm kg}\,{\rm m}^{-3}$ and $\mu _s^* = 10^{-3}$ Pa s. Although it is modelled as a Newtonian fluid here, the airway mucus is actually a very complex material exhibiting non-Newtonian viscoelastic/viscoplastic behaviour (Puchelle, de Bentzmann & Zahm Reference Puchelle, de Bentzmann and Zahm1995). Its viscosity is highly variable and may range over several orders of magnitude depending on various factors (Lai et al. Reference Lai, Wang, Wirtz and Hanes2009). The baseline value of the mucus viscosity is taken as $\mu _m^*=0.01$ Pa s and is varied within the range $\mu _m^* \in [0.01, 0.10]$ Pa s.
For typical adult human lungs, the air–mucus surface tension,  $\sigma _{a - m}^*$, is much lower than that of the clean air–water interface, due mainly to the presence of pulmonary surfactants. The air–mucus surface tension is affected by various factors but it is primarily determined by the amount of the surfactant. Thus the air–mucus surface tension is considered in the interval $\sigma _{a - m}^* \in [0.01, 0.05]\,{\rm N}\,{\rm m}^{-1}$ to represent the healthy and surfactant-deficient conditions (Schürch et al. Reference Schürch, Gehr, Im Hof, Geiser and Green1990; Moriarty & Grotberg Reference Moriarty and Grotberg1999; Romanò et al. Reference Romanò, Fujioka, Muradoglu and Grotberg2019). To the best of our knowledge, there is no measurement for the serous–mucus surface tension and its effect on the airway closure process has not been investigated in the literature. Therefore, this parameter, which is known to be much lower than that of the water–air interface, is investigated in the interval $\sigma _{s - m}^* \in [10^{-3} \times \sigma _{a - m}^*$, $\sigma _{a - m}^*]$. The ranges of parameters used in the simulations are summarized in table 1.
The ranges of the non-dimensional parameters used in the simulations.

4. Linear stability analysis
A linear stability analysis is performed using the lubrication theory in the thin-film limit. A local coordinate system is adopted as shown in figure 2. Using the methodology of Hammond (Reference Hammond1983) and Halpern & Grotberg (Reference Halpern and Grotberg1992), an evolution equation for the air–mucus interface is derived and its linear stability is analysed by using the method of normal modes.
The definition sketch used in the linear stability analysis. The local coordinate  $y$ denotes the distance from the wall. The locations of the serous–mucus and air–mucus interfaces are denoted by $\eta$ and $\zeta$, respectively, and their undisturbed locations are denoted by subscript ‘ $o$’.
$o$’.

Capillary scaling, consistently with (3.2), is used to non-dimensionalize all the quantities as
 \begin{equation} \left. \begin{aligned} r^* & =a^*r, \quad z^*=a^*z, \quad t^*=\frac{\mu_m^* a^*}{\sigma_{a - m}^*}\,t, \\ p_i^* & =\frac{\sigma_{a - m}^*}{a^*}\,p_i, \quad u_i^*=\frac{\sigma_{a - m}^*}{\mu_m^*}\,u_i, \quad w_i^*=\frac{\sigma_{a - m}^*}{\mu_m^*}\,w_i, \end{aligned} \right\} \end{equation}
where  $r^*$ and $z^*$ denote the radial and axial coordinates, respectively, $u^*$ and $w^*$ are the radial and axial components of velocity, and $p^*$ is the pressure in the film. Note that in this equation and in the following ones, $i=1$ and $i=2$ denote the serous and the mucus films, respectively. In the local coordinate system (see figure 2), the locations of the serous–mucus and air–mucus interfaces are denoted by $y=\eta$ and $y=\zeta$, respectively, where the new independent variable $y$ is defined as $y=1-r$. The corresponding undisturbed locations of the interfaces are denoted by $\eta _o$ and $\zeta _o$.
In the lubrication limit, the momentum equations can be written as
 \begin{equation} \mu\frac{\partial p_1}{\partial z}=\frac{\partial^2 w_1}{\partial y^2}, \quad \frac{\partial p_2}{\partial z}=\frac{\partial^2 w_2}{\partial y^2}, \quad \frac{\partial p_i}{\partial y_i}=0. \end{equation}
The continuity equation is given by
 \begin{equation} \frac{\partial u_i}{\partial y}+\frac{\partial w_i}{\partial z}=0. \end{equation}
We remark that in (4.2a–c) and (4.3), the curvature effects do not appear at leading order. This is consistent with the thin-film approximation for  $\zeta _o\ll 1$. The no-slip boundary conditions require $u_1=0$ and $w_1=0$ at $y=0$. At the serous–mucus interface ( $y=\eta$), the jump in the normal stress is neglected since the surface tension between the serous and mucus interface is small. Therefore, the boundary conditions at the serous–mucus interface can be written as
 \begin{equation} \left. \begin{array}{ll} \mu\dfrac{\partial w_2}{\partial y}=\dfrac{\partial w_1}{\partial y}, \quad w_1=w_2 & \text{at}\ y=\eta,\\ u_1(\eta,t)=\dfrac{\partial \eta}{\partial t} + w_1\dfrac{\partial \eta}{\partial z} & \text{at} \ y=\eta,\\ u_2(\eta,t)=\dfrac{\partial \eta}{\partial t} + w_2\dfrac{\partial \eta}{\partial z} & \text{at} \ y=\eta,\\ p_1=p_2 & \text{at} \ y=\eta. \end{array} \right\} \end{equation}
The air–mucus interface is assumed to be shear-free, and the jump in the normal stress is neglected due to the very small surface tension value at the serous–mucus interface. Augmented with the kinematic conditions, the boundary conditions at the air–mucus interface are given by
 \begin{equation} \left. \begin{array}{ll} \dfrac{\partial w_2}{\partial y}=0 & \text{at} \ y=\zeta, \\ u_2(\zeta,t)=\dfrac{\partial \zeta}{\partial t} + w_2\dfrac{\partial \zeta}{\partial z} & \text{at} \ y=\zeta,\\ p_2-p_{air}=1-\zeta-\dfrac{\partial^2 \zeta}{\partial z^2} & \text{at} \ y=\zeta, \end{array} \right\} \end{equation}
where  $p_{air}$ is assumed to be constant owing to the small viscosity of air, and the jump in the normal stress is included as in Hammond (Reference Hammond1983). We stress that the essence of the cylindrical geometry is retained in the last equation in (4.5), where the small-slope approximation is made, assuming ${\partial \zeta }/{\partial z}\ll 1$. Using the boundary conditions, the velocity profiles in the mucus and serous layers can be obtained from the momentum equations (4.2a–c) as
 \begin{equation} \left. \begin{aligned} & w_1(y)=\frac{1}{2}\mu\frac{\partial p_2}{\partial z}\left(y^2-2{\zeta}y\right),\\ & w_2(y)=\frac{1}{2}\frac{\partial p_2}{\partial z}\left[y^2-2{\zeta}y + \left(\mu-1\right)\left(\eta^2-2{\eta}\zeta\right)\right]. \end{aligned} \right\} \end{equation}
Integrating the continuity equations across the liquid layers and using the kinematic and stress boundary conditions, an evolution equation for the air–mucus interface can be obtained as
 $$\begin{gather} \frac{{\partial}\zeta}{{\partial}t} -\frac{1}{3}\frac{\partial}{{\partial}z}\left[\zeta^3\left(-\frac{{\partial}\zeta}{{\partial}z}-\frac{{\partial}^3\zeta}{{\partial}z^3}\right)\right] +\left(1-\mu\right)\frac{\partial}{{\partial}z}\left[\eta\zeta^2\left(-\frac{{\partial}\zeta}{{\partial}z}-\frac{{\partial}^3\zeta}{{\partial}z^3}\right)\right]\nonumber\\ -\left(1-\mu\right)\frac{\partial}{{\partial}z}\left[\zeta\eta^2\left(-\frac{{\partial}\zeta}{{\partial}z}-\frac{{\partial}^3\zeta}{{\partial}z^3}\right)\right] +\frac{\left(1-\mu\right)}{3}\,\frac{\partial}{{\partial}z}\left[\eta^3\left(-\frac{{\partial}\zeta}{{\partial}z}-\frac{{\partial}^3\zeta}{{\partial}z^3}\right)\right]=0. \end{gather}$$
Finally, the linear stability of the air–mucus interface is investigated by using the method of normal modes. Time evolution of small disturbances is given as
 \begin{equation} \zeta=\zeta_o + \hat{\zeta}\,{\rm e}^{ {\alpha}t+{\rm i}kz } \quad \text{and} \quad \eta=\eta_o + \hat{\eta}\,{\rm e}^{ {\alpha}t+{\rm i}kz }, \end{equation}
where  $|\hat {\zeta }|$ $\ll 1$ and $|\hat {\eta }| \ll 1$, $\zeta _o$ and $\eta _o$ are the locations of the undisturbed non-dimensional air–mucus and serous–mucus interfaces, respectively, $k$ is the wavenumber and $\alpha$ is the growth rate of the instabilities. Substituting (4.8a,b) into (4.7) and neglecting the higher-order terms, the dispersion relation for $\alpha$ is obtained as
 \begin{equation} \alpha = \frac{1}{3}k^2\left(1-k^2\right)\zeta_o^3 \left[ 1 +3\left(\mu-1\right)\left(\frac{\eta_o}{\zeta_o}-\left(\frac{\eta_o}{\zeta_o}\right)^2 +\frac{1}{3}\left(\frac{\eta_o}{\zeta_o}\right)^3 \right) \right]. \end{equation}
It is worth noting that the terms in the square bracket on the right-hand side of (4.9) represent the additional effects due to the two-layer model, and the whole expression reduces to its one-layer counterpart for  $\mu =1$ or $\eta _o=0$. It is also interesting to observe that for $\mu > 1$ and $\eta _o > 0$, the term on the right-hand side in the square brackets is always positive, i.e.
 \begin{equation} 3(\mu-1)\left(\frac{\eta_o}{\zeta_o}-\left(\frac{\eta_o}{\zeta_o}\right)^2 +\frac{1}{3}\left(\frac{\eta_o}{\zeta_o}\right)^3 \right) > 0. \end{equation}
Therefore, for  $\mu > 1$ and $\eta _o > 0$, the growth rate of the two-layer case is always larger than that of the corresponding one-layer case. The growth rate is plotted in figure 3 as a function of $k^2$ for various values of the undisturbed locations of the air–mucus $\zeta _o$ and the serous–mucus $\eta _o$ interfaces, and the viscosity ratio $\mu$. Figure 3(a) illustrates that the growth rate, $\alpha$, increases with the increasing mucus layer thickness as expected. The effect of the serous layer thickness is shown in figure 3(b). It can be seen that, for a constant total layer thickness, the growth rate increases monotonically as the serous layer thickness increases, i.e. the serous film has a destabilizing effect and facilitates airway closure. Finally, the effect of the viscosity ratio is shown in figure 3(c). It is seen that the non-dimensional growth rate, $\alpha$, increases with the viscosity ratio. This counter-intuitive behaviour is just an artefact of the non-dimensionalization of the growth rate. In fact, the dimensional growth rate, $\alpha ^*$, decreases with the viscosity ratio as shown in the inset of figure 3(c) where the dimensional growth rate is plotted, i.e. the closure is actually delayed with increasing $\mu$, which is also verified by numerical simulations as discussed in detail in § 5.5.
The amplification factor  $\alpha$ plotted against the square of the wavenumber $k^2$ for various values of (a) the undisturbed location of the air–mucus interface $\zeta _o$ with $\mu =10$ and $\eta _o=0.05$, (b) the undisturbed location of the serous–mucus interface $\eta _o$ with $\mu =10$ and $\zeta _o=0.20$, and (c) the mucus-to-serous viscosity ratio $\mu$ with $\zeta _o=0.20$ and $\eta _o=0.05$. The inset in (c) shows the dimensional amplification factor $\alpha ^*$ vs $k^2$.

5. Results and discussion
Motivated by the linear stability analysis, simulations are performed to examine the effects of mucus and serous film thicknesses, the viscosity ratio and the surface tension coefficients at the air–mucus and serous–mucus interfaces. To facilitate a systematic analysis, a baseline case is designated. A set of simulations is performed by varying a single parameter in the physiological range while keeping the other parameters fixed at their baseline values to demonstrate its sole effects on the airway closure. The baseline case is defined as  $a^*=0.058$ cm, $\lambda = 6$, $\epsilon _m=0.15$, $\epsilon _s=0.05$, $\rho _m^*=1000\ \textrm {kg}\ \textrm {m}^{-3}$, $\rho _s^*=1000\ \textrm {kg}\ \textrm {m}^{-3}$, $\mu _m^*=0.01$ Pa s, $\mu _s^*=0.001$ Pa s, $\sigma _{a- m}^*=0.03\ \textrm {N}\ \textrm {m}^{-1}$ and $\sigma _{s- m}^*=0.003\ \textrm {N}\ \textrm {m}^{-1}$, which corresponds to the non-dimensional quantities $La=174$, $\lambda =6$, $\mu = 10$, $\rho =1$, $\sigma =10$, $(\epsilon _m+\epsilon _s)=0.2$ and $\epsilon =3$. The ranges of the non-dimensional parameters are summarized in table 1.
All the computations are performed using non-uniform tensor-product structured grids. The computational domain is  $L_z^* = 6a^*$ in the axial direction and $a^*$ in the radial direction (see figure 1). The computational grid is uniform in the axial direction but is stretched in the radial direction to resolve the thin-film regions that occur at the shoulders of the bulge as the instability grows. The radial grid size, $\Delta r$, is five times smaller at the tube wall than that at the symmetry line of the tube. A grid convergence study is also conducted to ensure that the results are grid-independent. It is found that a $96 \times 576$ Cartesian grid is sufficient to reduce the spatial error below 5 % for the wall shear stress excursion, $\Delta \tau _w = \max (\tau _w) - \min (\tau _w)$, the wall pressure excursion, $\Delta p_w = \max (p_w) - \min (p_w)$, and the minimum core radius, $R_{min}$. Therefore, this resolution is used in all the simulations presented here.
5.1. Analysis of a typical two-layer airway closure scenario
Simulations are first performed for the baseline case. The evolution of the interfaces and the constant pressure contours are shown in figure 4, including the pre- and post-coalescence phases. The snapshots are taken at  $t=342.7$, $t=536.9$, $t=551.1$, $t=552$, $t=555.2$ and $t=925.3$. Note that the closure time is $t_c=551.4$ for this configuration. The figure shows that the closure occurs in a very similar fashion as in the one-layer case studied by Romanò et al. (Reference Romanò, Fujioka, Muradoglu and Grotberg2019). In the initial stage (see figure 4a), consistent with the lubrication assumption, the pressure is axially distributed in the film region without any significant variation in the radial direction, which induces the drainage of liquid from the film into the bulge. As the liquid volume of the bulge increases (see figure 4b), the pressure starts to vary radially too, and the minimum pressure occurs at the bulge tip. The radial pressure distribution becomes more apparent just before the closure, as shown in figure 4(c). In figure 4(d), it can be seen that the location of the minimum pressure changes, and it occurs at the sides of the liquid plug. This pressure distribution causes a quick acceleration of the fronts resulting in even more drainage from the liquid film, and the two fronts move in opposite directions in a very short time. This process is termed bi-frontal plug growth, and it is responsible for the sharp increases of the pressure and shear stress on the airway wall. Very shortly after the closure, as seen in figure 4(e), sharp pressure gradients inside the plug soften and the entire system starts to relax. In the stationary state (see figure 4f), the plug growth rate is zero, and the pressure field is essentially determined by the Laplace pressure across the interfaces.
(a–f) Evolution of the interfaces (solid magenta lines) with constant contours of the pressure field (right portion) and the velocity vectors (left portion) for the base case. Snapshots are taken at three pre-coalescence ((a)  $t=342.7$, (b) $t=536.9$ and (c) $t=551.1$) and three post-coalescence instants ((d) $t=552$, (e) $t=555.2$ and (f) $t=925.3$). (g) An enlarged view of the vicinity of the capillary wave marked by a cyan ellipse in (f). ( $La=174$, $\lambda =6$, $\mu =10$, $\rho =1$, $\sigma = 10$, $(\epsilon _m+\epsilon _s)=0.2$, $\epsilon =3$.)

Figure 4 shows that liquid accumulation occurs in both the mucus and serous films as a result of the axial pressure distribution, but it is the mucus layer that ruptures. Within our parameter space, this is always the case irrespective of the mucus-to-serous film thickness ratio,  $\epsilon$, as will be discussed later. An enlarged view of the region of the capillary wave is depicted in figure 4(g). As seen, the liquid films become very thin and the interfaces get very close to each other there. The grid is stretched near the wall to resolve this region as mentioned before. This also indicates that the serous–mucus and air–mucus interfaces may coalesce as well, and the mucus layer can be discontinuous along the airway wall. However, we neglect this possibility and focus on the rupture of the air–mucus interface, which is more likely. Therefore, in the present study, the air–mucus and serous–mucus interfaces are not allowed to coalesce in all the results presented in this paper except for the results presented in § 5.6, where the scenario for the coalescence of the air–mucus and mucus-serous interfaces is investigated.
Romanò et al. (Reference Romanò, Fujioka, Muradoglu and Grotberg2019) showed that the airway epithelium is potentially lethally or sublethally damaged due to the presence of high levels of shear stress and wall pressure as well as their gradients. In addition, they also showed that not only the magnitude but also the duration of high mechanical stresses are important. Therefore, it is necessary to quantify the mechanical stresses and their gradients on the airway wall during the entire closure process. In figure 5, the time evolution of these quantities is depicted together with the minimum radial location of the interfaces for the baseline case of both the one-layer and two-layer configurations. The one-layer equivalent of the two-layer configuration is formed by using a homogenization process (Romanò et al. Reference Romanò, Fujioka, Muradoglu and Grotberg2019). Figure 5 shows that the mechanical stresses and their gradients increase sharply during the topological change, and the mechanical stresses reach their maximum values just after the closure. Comparison of the highest peaks of the wall mechanical stress excursions and their gradients reveals that the stress gradients reach higher values than the mechanical stresses. The black dashed lines in figure 5 indicate the closure time,  $t_c$, and the time of the highest peak of the stresses, $t_{peak}$. For the one-layer case, $t_c=3095.8$ and $t_{peak}=3111.9$, corresponding to the dimensional values $t_c^*=0.4638\ \textrm {s}$ and $t_{peak}^*=0.4663\ \textrm {s}$. For the two-layer case, $t_c=551.4$ and $t_{peak}=564$, corresponding to the dimensional values $t_c^*=0.1066\ \textrm {s}$ and $t_{peak}^*=0.1090\ \textrm {s}$. This indicates that the time interval between the closure and the time of the highest peak of the stresses is almost the same for both models. Romanò et al. (Reference Romanò, Fujioka, Muradoglu and Grotberg2019) demonstrated that peak values of mechanical stresses occurring on the airway wall right after the closure due to the bi-frontal plug growth may reach levels that can damage airway epithelial tissue. It is clear from the sharp increase in the monitored parameters that this is also true for the two-layer model.
Time evolutions of the minimum core radius  $R_{min}$, the wall pressure excursions $\Delta p_w = \max (p_w) - \min (p_w)$, the wall shear stress excursions $\Delta \tau _w = \max (\tau _w) - \min (\tau _w)$, the maximum absolute value of the wall pressure gradient $|\partial _z p_w|_{max}$ and the maximum absolute value of the wall shear stress gradient $|\partial _z \tau _w|_{max}$ for (a) the one-layer case and (b) the two-layer case. In both panels, the closure time $t_c$ and the time at which the first peak in stresses occurs after the closure are indicated by the vertical dashed black lines. ( $La=174$, $\lambda =6$, $\mu =10$, $\rho =1$, $\sigma =10$, $(\epsilon _m+\epsilon _s)=0.2$, $\epsilon =3$.)

After such a qualitative comparison, extensive simulations are presented below to quantify the effects of the two-layer model in comparison with the one-layer counterpart in the range of parameters of relevance in the airway closure. The effects of liquid film thickness ratio is examined first. Then the effects of the mucus and serous film thicknesses, the viscosity ratio and the surface tension ratio are investigated.
5.2. Effect of mucus and serous film thicknesses
The mucus and serous film thicknesses and their ratio vary due to airway generation, age and eventual pathological conditions. Using numerical simulations, we examine the effects of each parameter separately. For this purpose, simulations are first performed to investigate the effects of the ratio of the mucus film thickness to the serous film thickness in the range  $1/3\le \epsilon \le 9$ while keeping the other parameters constant at their baseline values.
Time evolutions of the wall shear stress excursions,  $\Delta \tau _w$, the maximum absolute value of the wall shear stress gradient, $|\partial _z \tau _w|_{max}$, the wall pressure excursion, $\Delta p_w$, and the maximum absolute value of the wall pressure gradient, $|\partial _z p_w|_{max}$, are plotted in figure 6 for the two-layer and one-layer configurations. In the one-layer model, the surface tension at the liquid–air interface is equal to $\sigma _{a- m}^*$ of the baseline case of the two-layer model, and the viscosity of the liquid film is determined as a weighted average of the mucus and serous layers. The destabilizing effect of the serous layer is clearly visible in figure 6 as the closure time, $t_c$, appears to be much shorter for all the values of $\epsilon$ in the two-layer model. This behaviour can be explained by the lubricating effect of the serous fluid in the two-layer model, which is previously used to explain the failure of the mucociliary clearance in the depleted state of the PCL in diseased conditions, namely cystic fibrosis. For example, Boucher (Reference Boucher2007) explained that the serous layer separates the mucus layer from the cell surface, and if this layer collapses, then the mucociliary clearance is compromised due to the highly adhesive mucus in diseased state and the absence of the lubricative effect of the PCL. The function of the PCL – that it facilitates ciliary beating and ensures cell-surface lubrication – is also indicated by Button et al. (Reference Button, Cai, Ehre, Kesimer, Hill, Sheehan, Boucher and Rubinstein2012). Apparently in our case too, the mucus layer can slide over a slippery serous layer more easily compared to the one-layer case (which is in direct contact with the wall), and this accelerates the accumulation of mucus in the bulge and consequently the closure of the airway. This result is consistent with the linear stability analysis that predicts amplification of growth rate as the serous film thickness is increased while the total film thickness is kept constant.
The effects of the mucus-to-serous film thickness ratio for the two-layer model (solid lines) and one-layer model (dashed lines). The total ASL thickness is kept constant at its baseline value, and the thickness ratio is varied. Time evolutions are shown of (a) the wall shear stress excursions  $\Delta \tau _w = \max (\tau _w) - \min (\tau _w)$, (b) the maximum absolute value of the wall shear stress gradient $|\partial _z \tau _w|_{max}$, (c) the wall pressure excursions $\Delta p_w = \max (p_w) - \min (p_w)$, and (d) the maximum absolute value of the wall pressure gradient $|\partial _z p_w|_{max}$, for $\epsilon =9, 7, 3, 3/2, 2/3, 1/3$. The non-dimensional time, $t$, is divided by $\sqrt {La}$ to eliminate the effect of viscosity on the time scaling for a better interpretation of the results. ( $La=174$, $\lambda =6$, $\mu =10$, $\rho =1$, $\sigma =10$, $(\epsilon _m+\epsilon _s)=0.2$.)

Figure 6 also shows the protective role of the serous layer for the epithelial cells against the shear stress excursions and shear stress gradients. For the bi-layer case, the peak levels of  $\Delta \tau _w$ and $|\partial _z \tau _w|_{max}$ are lower than that of the single-layer case for all values of $\epsilon$. It is striking to observe that the difference becomes much more dramatic for the more biologically relevant case of $\epsilon =9$, for which the peak levels of these quantities differ by as much as 40 %. The wall pressure excursions seem to be essentially unaffected by the existence of the serous layer, but their peak values decrease slightly with increasing $\epsilon$. On the other hand, the peak values of $|\partial _z p_w|_{max}$ are higher in the two-layer case compared to the one-layer counterpart, but the increase gets smaller as the serous layer thickness is reduced. Romanò et al. (Reference Romanò, Fujioka, Muradoglu and Grotberg2019) reported that $|\partial _z p_w|_{max}$ increases with decreasing liquid viscosity and film thickness in their one-layer model. The difference between the results obtained for the peak levels of $|\partial _z p_w|_{max}$ in the one-layer and two-layer configurations can be explained by the fact that the serous film layer is very thin and its viscosity is much smaller than that of the mucus layer. Furthermore, Romanò et al. (Reference Romanò, Fujioka, Muradoglu and Grotberg2019) argued that the monotonic growth of the wall pressure gradient, $|\partial _z p_w|_{max}$, is related to the local variation of the film thickness. As seen in figure 4, the in-plane curvature of the interfaces increases as more liquid is drawn from the film to the plug in the present two-layer model in a similar fashion as in the one-layer model of Romanò et al. (Reference Romanò, Fujioka, Muradoglu and Grotberg2019). We therefore confirm that the observation of the one-layer model can be generalized to the two-layer case. As a result, after the closure, $|\partial _z p_w|_{max}$ increases monotonically as the plug grows. It is also seen in figure 6 that decreasing the serous layer thickness reduces both the wall pressure and shear stress excursions as well as their gradients, and after $\epsilon =7$, for the thinner serous layer depths, the peak levels of the mechanical stresses essentially remain unchanged. These results suggest that the presence of the serous layer reduces the risk of mechanical-stress-induced epithelial cell damage in the airway epithelium, but the excessive amount of serous might be detrimental as well.
Simulations are then performed to examine the effects of the mucus film thickness  $\epsilon _m$ in the range $0.10\le \epsilon _m \le 0.30$, and the results are shown in figure 7, where the serous layer thickness is fixed at $\epsilon _s=0.05$ and the mucus layer depth is varied. The other parameters are also fixed at their baseline values. In their one-layer model, Romanò et al. (Reference Romanò, Fujioka, Muradoglu and Grotberg2019) reported that the liquid film thickness does not have a significant influence on the mechanical stresses except for the wall pressure gradient, $|\partial _z p_w|_{max}$. However, figure 7 shows that the shear stress excursions increase, while the shear stress gradients decrease as the mucus film thickness increases in our two-layer model. While the peak levels of wall pressure excursions seem to be essentially unaffected, their gradients are reduced significantly as the mucus layer thickness is increased. This is correlated to the relative thickness of the slip serous layer compared to the mucus layer thickness. In this sense, considering the two-layer model provides a leading-order correction of the qualitative dynamics predicted by the one-layer model in terms of stress gradients. The closure time also decreases as the mucus film thickness increases, which is attributed to the increase of the total film thickness and is thus consistent with the prediction by the linear stability analysis.
The effect of mucus film thickness for  $\epsilon _m\in [0.10, 0.30]$. Time evolutions are shown of (a) the wall shear stress excursions $\Delta \tau _w = \max (\tau _w) - \min (\tau _w)$, (b) the maximum absolute value of the wall shear stress gradient $|\partial _z \tau _w|_{max}$, (c) the wall pressure excursions $\Delta p_w = \max (p_w) - \min (p_w)$, and (d) the maximum absolute value of the wall pressure gradient $|\partial _z p_w|_{max}$. The serous film thickness is kept constant at its baseline value, and the mucus thickness is varied. ( $La=174$, $\lambda =6$, $\mu =10$, $\rho =1$, $\sigma =10$, $\epsilon _s=0.05$.)

Figure 7 shows that the critical film thickness for the two-layer model lies in the interval  $0.1125< \epsilon _m < 0.1250$ for the serous thickness $\epsilon _s=0.05$. Note that Gauglitz & Radke (Reference Gauglitz and Radke1988) found the total critical film thickness to be $h_c^*/a^*\approx 0.12$ for a one-layer film lining a clean rigid tube from inside, so the critical film thickness appears to be larger when considering the total film thickness in the two-layer model compared to the single-layer counterpart. Additional simulations are performed to determine the critical film thickness in the interval $0.1125< \epsilon _m < 0.1250$, and the results are plotted in figure 8. The serous layer thickness is kept constant at its baseline value, and the mucus layer depth is increased slightly in order to roughly locate the critical thickness for the two-layer case for $\epsilon _s=0.05$. It can be seen that the critical thickness lies around $(\epsilon _m+\epsilon _s)_{cr}\approx 0.17$. Below this limit, the liquid volume is so small that it cannot form a liquid plug, but forms a so-called unduloid. Dietze & Ruyer-Quil (Reference Dietze and Ruyer-Quil2015) explained a viscous blocking mechanism for the configurations that are too thick to form an unduloid, i.e. the film thickness is just above the critical thickness. In this mechanism, viscous dissipation increases so much that the growth effectively stops, and flooding is delayed for a very long time. Resolving flow in such a thin film is prohibitively expensive computationally even for the present axisymmetric setting.
The effects of a slight perturbation of the mucus film thickness around the critical value. Time evolution of the minimum core radius,  $R_{min}$, is plotted for $\epsilon _m=0.1150, 0.1175, 0.12, 0.1225, 0.1250, 0.15$. The serous film thickness is kept constant at its baseline value, and the mucus thickness is varied. ( $La=174$, $\lambda =6$, $\mu =10$, $\rho =1$, $\sigma =10$, $\epsilon _s=0.05$.)

Finally, we examine the effects of the undisturbed serous film thickness on the mechanical stresses and closure time. For this purpose, simulations are performed by taking its non-dimensional initial thickness in the range  $0.02\le \epsilon _s \le 0.05$ while keeping the mucus layer thickness constant at $\epsilon _m=0.15$. The results are plotted in figure 9. As seen, the peak stresses are not sensitive to the change of the serous thickness in contrast to the mucus film thickness. However, it should be noted here that the serous layer volume is always lower than the baseline case value. In figure 6, the detrimental effect of the excessive serous layer depth has been shown. Additionally, airway closure occurs sooner as the serous thickness increases, as shown by the linear stability analysis. It seems that the critical total thickness for the two-layer model and the mucus thickness $\epsilon _m=0.15$ lies in the interval between the green line, $(\epsilon _m, \epsilon _s)=(0.15, 0.025)$, and the blue line, $(\epsilon _m, \epsilon _s)=(0.15, 0.0275)$ in figure 9. This interval is also higher than the critical thickness of the one-layer case, $h_c^*/a^*\approx 0.12$. By considering both analyses for the serous and mucus film thicknesses, it can be concluded that the critical total thickness of the two-layer model is roughly $(\epsilon _m+\epsilon _s)_{cr}\approx 0.17$.
The effects of the serous film thickness. Time evolutions are shown of (a) the wall shear stress excursions  $\Delta \tau _w = \max (\tau _w) - \min (\tau _w)$, (b) the maximum absolute value of the wall shear stress gradient $|\partial _z \tau _w|_{max}$, (c) the wall pressure excursions $\Delta p_w = \max (p_w) - \min (p_w)$ and (d) the maximum absolute value of the wall pressure gradient $|\partial _z p_w|_{max}$, for $\epsilon _s=0.02, 0.025, 0.0275, 0.03, 0.04, 0.05$. The mucus film thickness is kept constant at its baseline value, and the serous thickness is varied. ( $La=174$, $\lambda =6$, $\mu =10$, $\rho =1$, $\sigma =10$, $\epsilon _m=0.15$.)

5.3. Effect of viscosity ratio  $\mu$
$\mu$

The mucus viscosity may vary by several orders of magnitude (Lai et al. Reference Lai, Wang, Wirtz and Hanes2009) and affects both the viscosity ratio,  $\mu$, and the Laplace number, $La$. In order to determine the effects of the mucus viscosity on the closure time, the mechanical stress excursions and their gradients, the simulations are performed for the pairs of $(La, \mu )=(174, 10), (43.5, 20), (19.33, 30), (10.875, 40), (6.96, 50), (1.64, 100)$, and the results are presented in figure 10. The effect of mucus viscosity, $\mu _m^*$, on the time scaling is eliminated by dividing the non-dimensional time, $t$, by $\sqrt {La}$ to facilitate better interpretation of the closure time for different viscosity ratios. As shown in the inset of figure 3(c), the linear stability analysis predicts that the increasing viscosity ratio abates the growth rate of the instabilities and thus delays the airway closure. Figure 10 shows that increasing the mucus viscosity greatly reduces the stress jumps, smears out the sharp stress peaks on the wall, and makes the relaxation phase smoother. For the single-layer model, Romanò et al. (Reference Romanò, Fujioka, Muradoglu and Grotberg2019) reported that $\Delta p_w$ decreases, $\Delta \tau _w$ increases, and stress gradients grow slightly as the liquid viscosity is increased. In the bi-layer model, except for the wall pressure excursions that seem to be almost insensitive to the mucus viscosity variations, the first peak of all other stress values decreases as the mucus viscosity increases. Therefore, compared to the one-layer model, the effects of the mucus viscosity on the mechanical stresses are more pronounced in the two-layer model. The increase of the serous viscosity is not studied here because its variance has no physiological relevance. Also, higher viscosity ratio cases ( $\mu >100$) are not simulated due to excessive computational cost.
The effects of the mucus viscosity. Time evolutions are shown of (a) the wall shear stress excursions  $\Delta \tau _w =\max (\tau _w) - \min (\tau _w)$, (b) the maximum absolute value of the wall shear stress gradient $|\partial _z \tau _w|_{max}$, (c) the wall pressure excursions $\Delta p_w = \max (p_w) - \min (p_w)$, and (d) the maximum absolute value of the wall pressure gradient $|\partial _z p_w|_{max}$, for the pairs $(La,\mu )=(174,10),(43.5,20),(19.33,30), (10.875,40), (6.96,50), (1.64, 100)$. The serous viscosity is kept constant at its baseline value, and the mucus viscosity is varied. The non-dimensional time, $t$, is divided by $\sqrt {La}$ to eliminate the effect of viscosity on the time scaling. ( $\lambda =6$, $\rho =1$, $\sigma =10$, $(\epsilon _m+\epsilon _s)=0.2$, $\epsilon =3$.)

After observing that increasing mucus viscosity has a more pronounced effect on the stress levels compared to the one-layer system, this phenomenon is investigated more deeply in figure 11. First, the time evolutions of the minimum radial locations of the serous–mucus and air–mucus interfaces,  $R_{min,\,s- m}$ and $R_{min,\,a- m}$, are plotted in figure 11(a) for $\mu =10$, $\mu =20$ and $\mu =30$. Here, right after the closure, a small waviness of $R_{min,\,s- m}$ can be seen, and afterwards, its value relaxes slowly to a steady state. As $\mu$ increases, this waviness is smoothed. Figure 11(b) shows the mucus and serous layer volumes, $V_{m}$ and $V_{s}$, in the plug, i.e. the volumes between the cross-sections at the non-dimensional axial locations $z=1.3$ and $z=4.7$, together with $R_{min,\,a- m}$ for $\mu =10$, $\mu =20$ and $\mu =30$. The volumes of the liquid layers are non-dimensionalized by ${a^{*}}^3$. Here, a similar waviness as in $R_{min,\,s- m}$ can be seen in $V_m$, while $V_s$ increases monotonically. Moreover, the mucus entrainment is much faster than that of the serous layer, and both of the entrainments slow down due to increasing $\mu$. The coloured shaded areas indicate a time scale introduced by the two-layer system, with which the stress rises occurring after the closure can be correlated. The wall stress damping of the two-layer system can be fit in this new time scale introduced right after the closure. Figures 11(a) and 11(b) indicate that the lower stress peaks, observed in the two-layer model with increasing $\mu$, are due to the fact that the mechanical stresses transferred through the serous–mucus interface are damped out by the serous entrainment. As the stress and stress gradient peaks are supposed to appear in a very short time after the closure (rapid bi-frontal plug growth), the ‘cushion’ provided by the serous layer prevents them from being transferred to the wall, and when the serous entrainment dynamics cease, the rapid bi-frontal plug growth already relaxes to softer stress conditions. This mechanism has a very relevant physiological significance, because the rigid wall represents the airway epithelial cells in our model. When the stress damping effect of the serous layer combines with rising $\mu$, they provide an effective cushion for the airway epithelium.
Time evolutions of (a) the minimum core radius of the air–mucus interface  $R_{min,\,a- m}$ and the minimum core radius of the serous–mucus interface $R_{min,\,s- m}$, and (b) the minimum core radius of the air–mucus interface $R_{min,\,a- m}$, the mucus layer volume, $V_{m}$, between the non-dimensional axial locations of $z=1.3$ and $z=4.7$, and the serous layer volume, $V_{s}$, between the non-dimensional axial locations of $z=1.3$ and $z=4.7$, for the viscosity ratios $\mu =10$, $\mu =20$ and $\mu =30$. The closure time for each case is denoted by a black solid line. The coloured shaded areas show the time scale of the two-layer system, which correlates with the stress damping due to increasing $\mu$. ( $\lambda =6$, $\rho =1$, $\sigma =10$, $(\epsilon _m+\epsilon _s)=0.2$, $\epsilon =3$.)

5.4. Effect of surface tension ratio $\sigma$

The surface tension at the air–mucus interface depends on various factors but it is mainly determined by the amount of surfactant released in the lungs. The high values of  $\sigma _{a- m}^*$ correspond to the pathological conditions due to the deficiency or dysfunction of surfactant. The air–mucus surface tension is varied in the physiological limits of the lung to examine its effects on the airway closure and the resultant mechanical stresses on the epithelial cells. The air–mucus surface tension affects both the surface tension ratio, $\sigma$, and the Laplace number, $La$. Simulations are performed for various values of $\sigma _{a- m}^*$ corresponding to the pairs $(La, \sigma )=(58, 0.3), (116, 0.15), (174, 0.1), (232, 0.075), (290, 0.06)$ while keeping the other parameters constant at their baseline values. The results are plotted in figure 12 for $\Delta \tau _w$, $|\partial _z \tau _w|_{max}$, $\Delta p_w$ and $|\partial _z p_w|_{max}$. For a better interpretation of the results, all the stress values and their gradients are multiplied by $La$, and the non-dimensional time is divided by $La$ in order to eliminate the effect of $\sigma _{a- m}^*$ on the scaling. An examination of figure 12 reveals that an increase in $La$ shortens the closure process and raises the peak values of the mechanical stresses. For instance, $\sigma =0.15$ (green line) corresponds to $\sigma _{a- m}^*=0.20\ \textrm {N}\ \textrm {m}^{-1}$, and $\sigma =0.06$ (black line) corresponds to $\sigma _{a- m}^*=0.50\ \textrm {N}\ \textrm {m}^{-1}$. A comparison of these two indicates that in a surfactant-deficient lung, the peak values of the stresses and their gradients reach three to four times those of a healthy one. Figure 12(d) shows that for a high air–mucus surface tension (e.g. $\sigma = 0.06$), the wall pressure gradient undergoes a jump, reaching a peak value right after the coalescence, followed by a relaxation to a lower value, and then increases monotonically due to the propagation of the capillary wave. At a low air–mucus surface tension value (e.g. $\sigma = 0.3$), the wall pressure gradient experiences a sharp increase and keeps increasing monotonically without any visible relaxation phase. Similar behaviour has also been reported for the single-layer case by Romanò et al. (Reference Romanò, Fujioka, Muradoglu and Grotberg2019). These results again confirm that the surfactant delays the airway closure and plays an important role in protecting lung epithelial tissue from high levels of mechanical stresses and stress gradients.
The effects of the air–mucus surface tension. Time evolutions are shown of (a) the wall shear stress excursions  $\Delta \tau _w = \max (\tau _w) - \min (\tau _w)$, (b) the maximum absolute value of the wall shear stress gradient $|\partial _z \tau _w|_{max}$, (c) the wall pressure excursions $\Delta p_w =\max (p_w) - \min (p_w)$, and (d) the maximum absolute value of the wall pressure gradient $|\partial _z p_w|_{max}$, for the pairs $(La,\sigma )=(58,0.3), (116,0.15), (174,0.1), (232,0.075), (290,0.06)$. The serous–mucus surface tension is kept constant at its baseline value, and that of the air–mucus interface is varied. ( $\lambda =6$, $\mu =10$, $\rho =1$, $(\epsilon _m+\epsilon _s)=0.2$, $\epsilon =3$.)

To the best of our knowledge, neither any measurement for the serous–mucus surface tension nor any systematic examination of its effects on the airway closure process has been reported in the literature. However, it is known that its value is very small compared to the air–mucus surface tension, thus its effect on the closure dynamics is expected to be very limited. To demonstrate this, we performed simulations for  $\sigma =1, 0.5, 0.1, 0.01, 0.001$ while keeping $\sigma _{a- m}^*$ constant and varying $\sigma _{s- m}^*$ in a very large interval, and present the results in figure 13. As seen, the results are essentially insensitive to the varying serous–mucus surface tension for both peak stresses and the closure time. It is interesting to see that the closure time does not change and the increase in peak stress value is negligible even for a very exaggerated case of $\sigma =1$. We thus deduce that $\sigma _{s- m}^*$ does not have a significant effect on the airway closure process, and it can safely be neglected in the airway closure models, which also justifies neglecting $\sigma _{s- m}^*$ in the linear stability analysis presented in § 4. This point is especially important, since the measurement of $\sigma _{s- m}^*$ is a challenging task, and the related information is extremely limited. Therefore, this finding may be very useful for the physiologists studying the airway closure problem.
The effects of the serous–mucus surface tension. Time evolutions are shown of (a) the wall shear stress excursions  $\Delta \tau _w = \max (\tau _w) - \min (\tau _w)$, (b) the maximum absolute value of the wall shear stress gradient $|\partial _z \tau _w|_{max}$, (c) the wall pressure excursions $\Delta p_w = \max (p_w) - \min (p_w)$, and (d) the maximum absolute value of the wall pressure gradient $|\partial _z p_w|_{max}$, for $\sigma =1, 0.5, 0.1, 0.01, 0.001$. The air–mucus surface tension is kept constant at its baseline value, and that of the serous–mucus interface is varied. ( $La=174$, $\lambda =6$, $\mu =10$, $\rho =1$, $(\epsilon _m+\epsilon _s)=0.2$, $\epsilon =3$.)

5.5. Growth rate
The growth rates obtained from the linear stability analysis and the simulations are compared in figure 14(a) for the viscosity ratio,  $\mu$, and in figure 14(b) for the thickness ratio, $\epsilon$. The distance of the air–mucus interface from its undisturbed position, $1-\zeta _o-R_{min}$, is used to monitor and quantify the growth of the instabilities for both the linear stability analysis and the simulation results. To facilitate direct comparison and show the influence of $\mu$ and $\eta _o/\zeta _o$ on the growth rate, the linear stability results for the one-layer case are fitted to the corresponding simulation results. For this purpose, the growth rate in (4.9) is written as
 \begin{equation} \alpha = \alpha_{sl} \left[ 1 +3\left(\mu-1\right)\left(\frac{\eta_o}{\zeta_o}-\left(\frac{\eta_o}{\zeta_o}\right)^2 +\frac{1}{3}\left(\frac{\eta_o}{\zeta_o}\right)^3 \right) \right], \end{equation}
where  $\alpha _{sl}= ({1}/{3})k^2(1-k^2)\zeta ^3_o$ is the growth rate for the single-layer case, i.e. for $\mu =1$ and $\epsilon =\infty$. In figure 14, first $\alpha _{sl}$ is determined by fitting it to the simulation results for the single-layer cases, then this value is used to compute the linear stability growth rates for various values of $\mu$ and $\eta _o/\zeta _o$. As seen, the linear stability and simulation results are in very good qualitative agreement, i.e. the trends are well captured by the linear stability analysis even for the relatively thick film thicknesses. In addition, the exponential growth of the instabilities is maintained until the final stage before the coalescence. Although the exact closure time, $t_c$, is different, the effect of $\mu$ and $\epsilon$ on $t_c$ is qualitatively in agreement in both cases; i.e. increasing $\mu$ and $\epsilon$ increases $t_c$ in both predictions. The quantitative limitations of the linear stability analysis are due mainly to the absence of curvature terms in the leading-order approximation as discussed in § 4. This approximation is one of the main reasons for the existing discrepancy between the lubrication model and the numerical simulations. Special attention should be paid to the scaling of time, $\alpha _{sl}$, in figure 14(a). While presenting the simulation results for the effect of the viscosity ratio in figure 10, the non-dimensional time, $t$, is divided by $\sqrt {La}$ to eliminate the effect of the mucus viscosity in time scaling, but in figure 14(a), the same scaling with the linear stability analysis is used in order to directly compare the results. Thus the smallest non-dimensional closure time for $\mu =50$ corresponds to the largest dimensional closure time. In other words, both linear stability analysis and numerical simulations predict the same trend for the effect of the parameters on $t_c$ when the same scaling is used.
Comparison between the linear stability analysis (solid line) and simulation (dashed line) results for (a) the viscosity ratio,  $\mu$, and (b) the thickness ratio, $\epsilon$. The growth of the instability is quantified by $1-\zeta _o-R_{min}$, where $\zeta _o$ is the undisturbed location of the air–mucus interface and $R_{min}$ is the minimum core radius. (a) $\lambda =6$, $\rho =1$, $\sigma = 10$, $(\epsilon _m+\epsilon _s)=0.2$, $\epsilon =3$. (b) $La=174$, $\lambda =6$, $\mu =10$, $\rho =1$, $\sigma =10$, $(\epsilon _m+\epsilon _s)=0.2$.

5.6. Coalescence of the air–mucus and serous–mucus interfaces
Figure 4 shows that after the primary coalescence leading to the airway closure, the two interfaces come very close to each other, which suggests the possibility of a secondary coalescence. This phenomenon has potential to introduce a very interesting fluid mechanics problem because of the three-phase dynamics involved. Therefore, simulations are also performed to investigate this scenario.
In the front-tracking method, topological changes are not handled automatically and must be done manually. In all the results presented so far, only the minimum distance between the air–mucus interface and the symmetry axis is monitored, and only the air–mucus interface is allowed to break up. In other words, a possible coalescence of the air–mucus and serous–mucus interfaces is neglected despite the indications as seen, for instance, in figure 4. To study this phenomenon, the present solver is modified, and the minimum distance between the two interfaces is also monitored. Once this distance is below a prespecified minimum threshold value (i.e.  $h_{th} = \Delta r$), the critical front elements are determined at the two interfaces. Afterwards, the critical element at the air–mucus interface is deleted and its end points are linearly connected to the serous–mucus interface, and the surface tension of this new interface (air–serous) is assumed to be equal to that of the air–mucus interface, $\sigma _{a- m}^*$. No special treatment is applied to the resulting triple points.
The simulations are carried out using the modified code for the  $\epsilon =3$ and $\epsilon =1/3$ cases by following the above procedure, and the snapshots taken during the secondary coalescence are presented in figure 15. As seen in this figure, the secondary coalescence occurs simultaneously on the top and the bottom portions just after the primary coalescence (i.e. airway closure). The region where the secondary coalescence occurs is shaded in the top portion of figure 15. An enlarged view of this shaded region is provided below each corresponding figure to show details of the secondary coalescence. In both cases, a secondary coalescence occurs in the bi-frontal growth phase. It is seen that the triple points move away from each other, and the serous layer is squeezed towards the wall. Moreover, the curvature of the mucus rim becomes quite high near the triple points, indicating the possibility of another sharp stress peak on the airway wall. However, after a short time, the numerical method diverges, due mainly to the sharp increase in pressure and shear stress fields in the vicinity of the triple points, which prevents observation of a long time behaviour.
Double coalescence for (a)  $\epsilon =3$ and (b) $\epsilon =1/3$ cases. In each figure, the evolutions of the interfaces are shown with constant contours of the pressure field (right portion) and the velocity vectors (left portion) from (i) to (iii). Enlarged views of the shaded areas showing the pressure contours are provided below each corresponding figure. ( $La=174$, $\lambda =6$, $\mu =10$, $\rho =1$, $\sigma =10$, $(\epsilon _m+\epsilon _s)=0.2$.)

For completeness of the discussion, the evolutions of  $R_{min}$, $\Delta \tau _w$ and $\Delta p_w$ are presented in figure 16. This figure clearly shows the sharp increase in the mechanical stresses on the airway after the secondary coalescence. Although the divergence of the numerical method does not allow us to draw a precise conclusion, the present results suggest that the vicinity of the triple point can be a source of excessive mechanical stresses on the airway epithelium.
The evolutions of the minimum core radius  $R_{min}$, the wall shear stress excursions $\Delta \tau _w = \max (\tau _w) - \min (\tau _w)$, and the wall pressure excursions $\Delta p_w = \max (p_w) - \min (p_w)$ at (a) $\epsilon =3$ and (b) $\epsilon =1/3$, with and without double coalescence. ( $La=174$, $\lambda =6$, $\mu =10$, $\rho =1$, $\sigma =10$, $(\epsilon _m+\epsilon _s)=0.2$.)

These results demonstrate that the secondary coalescence is a possible outcome of liquid plug formation that should be considered in future studies. The resolution of regions in the vicinity of triple points is a critical factor to pay attention to in this problem because of the complex dynamics of the three-phase region introduced. It should also be noted that the probability of this phenomenon can increase with decreasing mucus-to-serous film thickness ratio and increasing air–mucus surface tension. However, to achieve more conclusive results, clearly, a further investigation is required.
5.7. Medical implications of the results
Airway inflammation is a common symptom in respiratory diseases (Jacquot et al. Reference Jacquot, Tabary, Le Rouzic and Clement2008; Freishtat et al. Reference Freishtat, Watson, Benton, Iqbal, Pillai, Rose and Hoffman2011; Sethi et al. Reference Sethi, Mahler, Marcus, Owen, Yawn and Rennard2012). Huh et al. (Reference Huh, Fujioka, Tung, Futai, Paine, Grotberg and Takayama2007) and Tavana et al. (Reference Tavana, Zamankhan, Christensen, Grotberg and Takayama2011) reported that mechanical stress levels as high as found in our study may damage airway epithelial cells, and, as a result, injured cells can release pro-inflammatory cytokines to induce an inflammatory response, which further narrows down the airways. In their review, Opal & DePalo (Reference Opal and DePalo2000) stated that interleukin (IL)-1 receptor antagonists IL-4, IL-6, IL-10, IL-11 and IL-13 are among the important anti-inflammatory cytokines that have been shown to have major clinical benefits. These have a variety of clinical indications, and IL-10 is related to prevention of acute lung injury. Also, Hoshino et al. (Reference Hoshino, Nakamura, Okamoto, Kato, Araya, Nomiyama, Oizumi, Young, Aizawa and Yodoi2003) carried out an experimental study on thioredoxin (TRX), and showed that this redox-active protein adjusts pulmonary inflammatory responses and can prevent lung injury. It has been suggested that TRX can be beneficial in human interstitial lung diseases. Furthermore, Donnelly et al. (Reference Donnelly, Newton, Kennedy, Fenwick, Leung, Ito, Russell and Barnes2004) examined the anti-inflammatory effects of resveratrol, which is found in the skins of red fruits such as grapes, and suggested that this molecule has novel non-steroidal anti-inflammatory properties, which can make it a potential candidate for the clinical treatments of inflammatory diseases of lung epithelial cells. These anti-inflammatory strategies can be considered for patients experiencing cyclic airway closure and reopening, to reduce the risk of further exacerbations of airway closure.
Our results also indicate that the surface tension at the air–mucus interface plays a critical role on the severity of mechanical stresses, and in surfactant-deficient conditions, these stresses can reach dangerous levels for the airway epithelial cells (Bilek et al. Reference Bilek, Dee and Gaver2003). In pulmonary diseases such as ARDS, both the composition and the quantity of surfactants may change, and these are among the major causes of increased surface tension in the lung (Dushianthan et al. Reference Dushianthan, Cusack, Goss, Postle and Grocott2012). The clinical capabilities of exogenous surfactants to compensate these negativities have been known since Fujiwara et al. (Reference Fujiwara, Chida, Watabe, Maeta, Morita and Abe1980), who studied the effects of surfactants on neonate infants with RDS, and reported improvement in the conditions of the patients. This work motivated more studies on the effects of animal-derived surfactants in pathological conditions of the lung; today, there are many porcine and bovine surfactants available, and they are standard in the treatment of infants with RDS (Sardesai et al. Reference Sardesai, Biniwale, Wertheimer, Garingo and Ramanathan2017). The application of surfactants to ARDS patients is also possible, but so far only limited success has been achieved (Zuo et al. Reference Zuo, Veldhuizen, Neumann, Petersen and Possmayer2008). Recently, Piva et al. (Reference Piva, DiBlasi, Slee, Jobe, Roccaro, Filippini, Latronico, Bertoni, Marshall and Portman2021) carried out a surfactant therapy study on patients suffering from COVID-19-related ARDS, and a reduction in mortality and mechanical ventilation duration has been reported. Moreover, there is a relation between the composition and functional activity of surfactants and the interfacial surface tension Gregory et al. (Reference Gregory, Longmore, Moxley, Whitsett, Reed, Fowler, Hudson, Maunder, Crim and Hyers1991), and the surface tension is largely a function of the surfactant concentration, which can be represented by an equation of state (Muradoglu & Tryggvason Reference Muradoglu and Tryggvason2008). These show that with more sophisticated administration techniques, surfactant therapy can be used as a standard procedure in the future for adult patients as well. It can also be used to regulate the surface tension of the lung to reduce the detrimental effects of the wall mechanical stresses on the airway epithelium during airway closure and reopening.
6. Summary and conclusions
Capillary instability of a two-layer annular film inside a rigid tube is studied computationally as a model for airway closure for the range of parameters of physiological relevance. The computational model takes into account the bi-layer structure of the serous–mucus liquid layer that covers the inner surface of the pulmonary airways. Extensive simulations are carried out to investigate the effects of mucus layer thickness, serous layer thickness, mucus viscosity, and air–mucus and serous–mucus surface tensions. A linear stability analysis is also performed using the lubrication theory in the thin-film limit, and the predictions are compared with the numerical simulation results.
The linear stability analysis demonstrates that the two-layer case is always less stable than the one-layer counterpart; i.e. the growth rate is amplified in the two-layer model, but the critical wavenumber remains the same in both single- and two-layer cases. As a matter of fact, this result is quite important considering the physiology of the upper parts of the lung, where the surface liquid is formed by two layers, the PCL at the bottom and the mucus at the top. Our study indicates that once the necessary conditions are met, plug formation occurs faster in these regions. These results are then elaborated further by performing extensive simulations to investigate the growth rate of the instability and the resulting mechanical stresses on the airway wall.
Simulations are first performed for a typical airway closure scenario. It is found that liquid accumulation occurs in both the mucus and serous layers as the instability progresses, but within our parameter space, it is the mucus layer that ruptures regardless of mucus and serous film thickness ratios. The topological change is followed by a bi-frontal plug growth akin to the single-layer case, and results in large increase in mechanical stresses. It is also found that the mechanical stresses reach their peak values after the rupture, showing the importance of simulating the entire closure process as also reported by Romanò et al. (Reference Romanò, Fujioka, Muradoglu and Grotberg2019). Comparison of the one- and two-layer models reveals that the airway closure occurs sooner in the two-layer model because the serous layer acts as a lubricant and facilitates the accumulation of the mucus layer at the axial location where coalescence occurs. Actually, the lubricative features of the PCL are also used to explain the healthy mucociliary clearance (Boucher Reference Boucher2007; Button et al. Reference Button, Cai, Ehre, Kesimer, Hill, Sheehan, Boucher and Rubinstein2012). Therefore, our finding is in line with this mechanism.
It is also found that the serous layer provides an effective protection for the airway epithelium against the mechanical stresses by reducing the wall shear stress excursions and their local gradients up to 40 %. However, the protection becomes less effective in the case of an excessively thick sublayer. The wall pressure and shear stress excursions and their gradients increase with increasing serous layer thickness when the total ASL thickness is kept constant. In a healthy lung, the PCL depth is comparable to length of cilia ( ${\approx }7\,\mathrm {\mu }\textrm {m}$), and it is regulated by an ion transport mechanism (Widdicombe et al. Reference Widdicombe, Bastacky, Wu and Lee1997; Tarran Reference Tarran2004). By this mechanism, the PCL thickness is kept at an optimum value for cilia beating. The present simulations show that this optimum value ( ${\approx }7\,\mathrm {\mu }\textrm {m}$) is also favourable to reduce the shear stress excursions and their gradients on the airway wall during airway closure.
Simulations are then carried out to investigate the effects of mucus and serous film thicknesses. It is found that the wall pressure excursions are unaffected, but the shear stress excursions increase significantly, and the shear stress and pressure gradients decrease slightly as the mucus layer thickness increases. The growth rate of the instability increases with increasing mucus layer thickness, thus the closure occurs sooner. The mechanical stresses are found to be insensitive, but the closure is delayed when the relative thickness of the serous layer is reduced. The critical thickness for the one-layer case is also determined by the extensive simulations. In the literature, for a one-layer liquid film lining a clean pipe, it was shown that the critical thickness for liquid plug formation is  $h_c^*/a^*\approx 0.12$ (Gauglitz & Radke Reference Gauglitz and Radke1988), but we showed that the critical thickness is higher for the total thickness of the ASL, and the closure occurs when $(\epsilon _m+\epsilon _s)_{cr}\approx 0.17$. This almost 50 % correction to the existing literature indicates that repeated airway closure and reopening in some diseases such as pulmonary oedema and mucus hypersecretion may take place in more severe conditions than previously thought.
The effects of the viscosity ratio are investigated by varying the mucus viscosity and keeping the serous viscosity constant, since the mucus viscosity is very sensitive to physiological conditions, while the serous viscosity remains nearly unaffected. The closure time is delayed by increasing the mucus viscosity as predicted by the linear stability analysis. The jumps in the mechanical stresses in the post-coalescence phase are generally damped significantly as the viscosity ratio increases, but the reduction is more pronounced in the shear stress and its gradient. This phenomenon is further investigated, and it has been shown that the slower entrainment of the serous layer introduces a cushion that prevents the stress and its gradients from being transferred to the wall. This result indicates that increasing mucus thickness and viscosity, which are very common symptoms in pulmonary diseases such as CF (Puchelle et al. Reference Puchelle, de Bentzmann and Zahm1995), have opposite effects on airway closure. The former facilitates airway closure and increases the mechanical stresses on the wall, while the latter slows down the process and reduces the wall shear stress excursions and their gradients.
Next, the air–mucus surface tension is varied to mimic the effects of pulmonary surfactants on airway closure. It is found that the air–mucus surface tension has a significant influence on the mechanical stress excursions and their gradients. Airway closure occurs much sooner and the mechanical stresses increase greatly as the air–mucus surface tension increases. These results confirm the vital protective role of pulmonary surfactants for the healthy operation of the lungs. Afterwards, the effects of serous–mucus surface tension are investigated. It is confirmed that even for an exaggerated value of the serous–mucus surface tension (e.g.  $\sigma =1$), the dynamics of the three-phase system is not significantly affected, so it can safely be neglected in the closure models. Considering the experimental limitations in the lower (small) airways, this finding may be very useful information for physiologists working on airway closure
The computational results are also compared with the linear stability predictions in terms of the growth rate for the viscosity ratio and liquid film thickness ratio. The exponential growth of the instability predicted by the linear stability analysis is verified computationally until the final stage before plug formation. The computational results and linear stability predictions are found to be in good qualitative agreement for the effects of both the viscosity and the film thickness ratios.
Finally, simulations are performed to examine the possibility of secondary coalescence of the air–mucus and mucus–serous interfaces. The preliminary results confirm that the airway mucus can be discontinuous on the serous layer along the airway, and show that this secondary coalescence can be a source of another disturbance for the ASL by inducing excessive mechanical stresses on the airway wall. The prediction of the secondary coalescence sheds light on a new mechanism of possible airway damage during closure due to the excessive shear stress and pressure gradient in the vicinity of triple points created by the secondary coalescence. However, to obtain more conclusive results, this problem should be studied more thoroughly by resolving the regions in the vicinity of triple points better, and investigating the effects of the individual parameters on the mechanical stresses on the airway wall more deeply.
We believe that the quantification of a relevant time scale for liquid plug formation is of crucial importance. Even when the liquid film thickness exceeds the critical value, airway closure occurs only when the closure time is shorter than the breathing cycle. Otherwise, the ‘butter knife effect’ (Halpern & Grotberg Reference Halpern and Grotberg2003) that occurs due to the airflow circulation rather redistributes the mucus layer along the airway wall, preventing the closure. Hence our study presents, among other valuable results summarized above, that the single-layer model over-predicts the closure time so it is too conservative. Furthermore, the classical single-liquid-layer prediction of the critical film thickness has been corrected by about 50 % compared with the present double-layer model, the possible protective role of the serous layer over the pulmonary epithelium has been demonstrated, and the possibility of a secondary coalescence is highlighted.
Funding
Support from the Scientific and Technical Research Council of Turkey (TUBITAK), grant number 119M513, and National Institutes of Health (NIH), grant number HL136141, is kindly acknowledged.
Declaration of interests
The authors report no conflict of interest.


 Open access