


Coping, (mal)adaptive personality, and identity are well-known, interrelated constructs within the field of psychology (Connor-Smith & Flachsbart, Reference Connor-Smith and Flachsbart2007; Erikson, Reference Erikson1950; Folkman & Lazarus, Reference Folkman and Lazarus1985), yet questions remain regarding their best conceptualization as well as to what extent each construct exists independently from one another. This study employs network analysis, a state-of-the-art alternative to latent variable modeling that allows one to visualize and estimate associations between constructs like coping, (mal)adaptive personality, and identity, without assuming an underlying dimensional structure (Borsboom, Reference Borsboom2008), to help unravel those questions.
Coping, (mal)adaptive personality, and identity
Coping is often defined as the “constantly changing cognitive and behavioral efforts, employed to master, reduce or tolerate a troubled person-environment relationship” (Lazarus & Folkman, Reference Lazarus and Folkman1984 p. 152). When confronted with stress or a difficult situation, how we cope with that situation, can mean the difference between a good or bad outcome. While many definitions of coping exist, researchers generally agree that (1) coping strategies can be clustered into a distinct number of coping factors; (2) coping strategies can be cognitive or behavioral; and (3) the interaction between coping strategies and situation characteristics is important in understanding coping behavior and its outcome (De France & Hollenstein, Reference De France and Hollenstein2022; Sveinbjornsdottir & Thorsteinsson, Reference Sveinbjornsdottir and Thorsteinsson2008).
Within the literature on coping, consensus about how to best conceptualize or measure the central constructs in the field is lacking. Among the different models that have been used to describe the structure of coping, models on problem-focused versus emotion-focused, engagement versus disengagement, or primary versus secondary control coping, are the most commonly used (Compas et al., Reference Compas, Connor-Smith, Saltzman, Thomsen and Wadsworth2001; Skinner et al., Reference Skinner, Edge, Altman and Sherwood2003). While each model has it is own peculiarities, important similarities between these models exist (Compas et al., Reference Compas, Connor-Smith, Saltzman, Thomsen and Wadsworth2001). That said, confirmatory factor analyses have shown no single distinction so far adequately reflects the actual structure of coping (e.g., Connor-Smith et al., Reference Connor-Smith, Compas, Wadsworth, Thomsen and Saltzman2000). Skinner et al. (Reference Skinner, Edge, Altman and Sherwood2003) suggest the fundamental issue with identifying an adequate coping model is that “coping” or “coping behavior” cannot be observed unequivocally, as it is a construct that incorporates a broad range of cognitive and behavioral responses used to deal with stress or stressful circumstances. Coping strategies are neither good nor bad – whether certain strategies are helpful or effective depends on the context and the goal at the hand (Blanke et al., Reference Blanke, Brose, Kalokerinos, Erbas, Riediger and Kuppens2020; Koval et al., Reference Koval, Kalokerinos, Greenaway, Medland, Kuppens, Nezlek, Hinton and Gross2022; Lazarus & Folkman, Reference Lazarus and Folkman1984).
Personality is often defined as a characteristic pattern of thoughts, emotions, and behaviors thought to be stable over time and across situations and to predict future behavior and overall well-being (e.g., Anglim et al., Reference Anglim, Horwood, Smillie, Marrero and Wood2020). In other words, personality, or adaptive personality, refers to a pattern of unique, relatively permanent characteristics that gives both consistency and individuality to a person’s behavior. Similarly, maladaptive personality is often defined as an enduring pattern of thoughts, emotions, and behaviors that negatively affect a person’s adaptation and are thought to involve dysfunctions of the self and dysfunctions in one’s ability to relate to others (Altschuler & Krueger, Reference Altschuler and Krueger2021; Clark & Watson, Reference Clark and Watson2022; Roberts et al., Reference Roberts, Kuncel, Shiner, Caspi and Goldberg2007). Both adaptive and maladaptive personality are influenced by a complex interplay of transactions with the environment, including evocative, reactive, and passive person–environment interactions (e.g., Caspi & Shiner, Reference Caspi and Shiner2006).
Among the different models that have been used to describe the structure of adaptive personality, McCrae and Costa’s Five-Factor Model (FFM) and Goldberg’s Big Five are arguably the most dominant models of adaptive personality (De Pauw, Reference De Pauw and Widiger2017; Goldberg, Reference Goldberg1990; McCrae & Costa, Reference McCrae and Costa1987; Roberts et al., Reference Roberts, Kuncel, Shiner, Caspi and Goldberg2007). The FFM was originally derived through empirical studies of the English language and later on confirmed in subsequent lexical studies on a wide range of additional languages (e.g., although Ashton & Lee, Reference Ashton and Lee2020; Peabody & De Raad, Reference Peabody and De Raad2002). The FFM includes five domains of general personality functioning, also referred to as the “Big Five”: (1) Extraversion, (2) Agreeableness (also known as Benevolence), (3) Conscientiousness, (4) Emotional Stability (versus Neuroticism), and (5) Openness to Experience (also Intellect or Imagination). Research suggests all five domains are rooted in biological structures and processes are relatively stable across age groups and cultures (Costa et al., Reference Costa, McCrae and Löckenhoff2019; although Laajaj et al., Reference Laajaj, Macours, Hernandez, Arias, Gosling, Potter, Rubio-Codina and Vakis2019). Along those lines, different models have been developed to capture the structure of maladaptive personality. The most popular model on maladaptive personality to date is the hierarchical Big Four model (for an overview, see Widiger & Simonsen, Reference Widiger and Simonsen2005), which comprises maladaptive variants of the Big Five personality traits, minus Openness to Experience, namely: (1) Introversion, (2) Disagreeableness, (3) Compulsivity, and (4) Emotional Instability (e.g., Watson et al., Reference Watson, Clark and Chmielewski2008).
Identity is often defined as a set of beliefs about oneself, the world, and others around us or as “the perception of sameness and continuity of one’s own person despite the passage of time” (Erikson, Reference Erikson1950). In its most general terms, identity can be defined as one’s subjective response to the question “Who am I?” Identity synthesis, integrating all aspects of the self, is thought to be one of the core developmental tasks of adolescence (e.g., Klimstra, Hale, et al., Reference Klimstra, Hale, Raaijmakers, Branje and Meeus2010; Klimstra, Luyckx, et al., Reference Klimstra, Luyckx, Hale, Frijns, van Lier and Meeus2010).
Among the different models of identity that have been developed, the model of identity exploration and commitment by Marcia (Marcia, Reference Marcia and Adelson1980), translating Erikson’s theory into measurable constructs, is considered the most prominent. According to Marcia’s model, a combined process of (1) identity exploration and (2) identity commitment is necessary for adolescents to form an identity (Marcia, Reference Marcia and Adelson1980). Based on one’s level of exploration and commitment, one’s identity can be classified into one of four distinguishable identity statuses: diffusion, foreclosure, moratorium, and achievement. An important critique of Marcia’s model is that the model presents a static rather than dynamic picture of identity development (Côté & Levine, Reference Côté and Levine1988). More contemporary models of identity formation distinguish four processes subsumed under two complementary cycles. This first cycle contains the processes of exploration in breadth and commitment making. The second identity cycle captures the processes of exploration in depth and identification with commitment. In line with Marcia’s model, Luyckx et al. (Reference Luyckx, Schwartz, Berzonsky, Soenens, Vansteenkiste, Smits and Goossens2008) developed a more dynamic, five-dimensional model of identity or “dual-cycle model,” which includes the four processes just mentioned as well as a risk factor, referred to as ruminative exploration. Luyckx and colleagues’ five-dimensional model of identity development has proven fruitful in developmental research, allowing for a better understanding of theoretically relevant relations in identity development (Crocetti et al., Reference Crocetti, Albarello, Meeus and Rubini2022; Luyckx, Schwartz, et al., Reference Luyckx, Schwartz, Berzonsky, Soenens, Vansteenkiste, Smits and Goossens2008).
Pieces to a puzzle
Over the years, potential associations between coping, adaptive and maladaptive personality, and identity have been addressed by both conceptual and empirical research. At a conceptual level, a first notable approach is the metatheoretical framework for personality theory as defined by McCrae and Costa (Costa et al., Reference Costa, McCrae and Löckenhoff2019; McCrae & Costa, Reference McCrae, Costa and Wiggins1996), which distinguishes between “basic tendencies” (personality capacities and dispositions), “characteristic adaptations” (acquired skills, habits, attitudes and relationships), “self-concept” (knowledge views, and evaluations of the self), “objective biography” (actions, thoughts, and feelings), and “external influences.” As such, their model situates personality traits (as captured by FFM) at the level of basic tendencies, coping strategies (conceptualized as schemas and strategies) as characteristic adaptions, whereas implicit and explicit views of self and identity are situated at the level of self-concept. Somewhat similar, a more recent conceptual model by McAdams and Pals (Reference McAdams and Pals2006) which distinguishes between dispositional traits, characteristic adaptations, and personal narratives, situates personality traits at the basic level of “basic tendencies,” coping strategies (although not explicitly mentioned) at the level of “characteristic adaptations” (which are more situation-specific, tendencies to act in a specific way) and how people make sense of themselves and their identities at the top level of the pyramid of “self-defining life narratives” or “narrative identities.” As such, McAdams and Pals integrate personality and identity dimensions in a more explicit, pronounced manner. Other conceptual models like the Whole Trait Approach by Fleeson et al. (Reference Fleeson, Furr, Mneimne, Arnold, Samuel and Lynam2019) and the TESSERA framework by Wrzus and Roberts (Reference Wrzus and Roberts2017) relate more to the trait-state discussion, highlighting how personality traits (and identity aspects, although not specifically mentioned) exist at (mostly) the trait level, yet translate into daily behavior and interact with socio-cognitive aspects of functioning, like coping or emotional regulation, referencing to more state- than trait-like characteristics. Unfortunately, more theoretical and empirical work is needed to evaluate the complex nomological network among coping, personality, and identity.
At an empirical level, most attention to date has gone to either the association between coping and personality or coping and identity, while less work has attempted to link personality and identity (Klimstra, Hale, et al., Reference Klimstra, Hale, Raaijmakers, Branje and Meeus2010; Luyckx et al., Reference Luyckx, Goossens and Soenens2006, Reference Luyckx, Klimstra, Duriez, Schwartz and Vanhalst2012, Reference Luyckx, Teppers, Klimstra and Rassart2014; Penley & Tomaka, Reference Penley and Tomaka2002). Most empirical research, however, involves top-down investigations using correlations, regressions, or joint factor analyses, while a more bottom-up approach like network analysis has not been employed yet.
Regarding coping and personality, in line with the conceptual models, empirical evidence suggests that personality can affect coping, both directly, with personality constricting or facilitating the use of certain coping strategies, and indirectly, with personality influencing the nature of the stress or effectiveness of the employed strategies (Carver & Connor-Smith, Reference Carver and Connor-Smith2010; Connor-Smith & Flachsbart, Reference Connor-Smith and Flachsbart2007; Hughes et al., Reference Hughes, Kratsiotis, Niven and Holman2020). Moreover, similarities between coping and adaptive personality have been explored using joint factor analysis, indeed, indicating conceptual links between the two (Ferguson, Reference Ferguson2001). Researchers have also identified a shared genetic basis for coping and adaptive personality (Kato & Pedersen, Reference Kato and Pedersen2005), with correlations between the two often exceeding .60 (e.g., Ficková, Reference Ficková2001). For instance, empirical research investigating the relationship between coping and adaptive personality as captured by the FFM has found Neuroticism to predict more emotion-focused coping, more active coping, and more social support as well as less problem-focused coping (Hughes et al., Reference Hughes, Kratsiotis, Niven and Holman2020; Kobylińska & Kusev, Reference Kobylińska and Kusev2019; Vollrath & Torgersen, Reference Vollrath and Torgersen2000), Extraversion to predict more active coping and social support and less emotion-focused coping (Hughes et al., Reference Hughes, Kratsiotis, Niven and Holman2020; Watson & Hubbard, Reference Watson and Hubbard1996), and Conscientiousness to predict more problem-focused coping and less emotion-focused coping (Fickova, Reference Fickova2009; O’Brien & DeLongis, Reference O’Brien and DeLongis1996; Penley & Tomaka, Reference Penley and Tomaka2002). Agreeableness and Openness to Experience tend to show only a small regulating effect on coping (O’Brien & DeLongis, Reference O’Brien and DeLongis1996; Watson & Hubbard, Reference Watson and Hubbard1996). Research investigating the relationship between coping and maladaptive personality indicates low social support seeking and an excess of avoidant coping constitute the proximal cause of psychological distress in people suffering from a particular personality disorder (Bijttebier & Vertommen, Reference Bijttebier and Vertommen1999). Taken together, however, an actual integration of the coping and personality in terms of their conceptualization or operationalization is lacking. Confusion about conceptualization, subdimensions, or subtypes and a growing number of (sometimes questionable) measures, has hindered the synthesis and integration of findings (Compas et al., Reference Compas, Jaser, Bettis, Watson, Gruhn, Dunbar, Williams and Thigpen2017). While there is clear evidence for an association of domains, factors, and strategies of coping and personality, to date, the magnitude and direction of correlations between the two tend to vary across studies (e.g., Horner, Reference Horner1996; Ireland et al., Reference Ireland, Brown and Ballarini2006), suggesting a more modest or more complicated relationship between the two than is often argued for (for reviews, see Compas et al., Reference Compas, Jaser, Bettis, Watson, Gruhn, Dunbar, Williams and Thigpen2017; and Connor-Smith & Flachsbart, Reference Connor-Smith and Flachsbart2007).
Looking at coping and identity, empirical work suggests coping strategies and identity processes influence one another over time (Luyckx et al., Reference Luyckx, Klimstra, Duriez, Schwartz and Vanhalst2012, Reference Luyckx, Teppers, Klimstra and Rassart2014). As such, coping strategies are suggested to be determining factors in how one handles identity-related struggles (Seiffge-Krenke et al., Reference Seiffge-Krenke, Aunola and Nurmi2009), whereas identity processes are suggested to affect how one copes with stressful life events (Berzonsky, Reference Berzonsky1992; Luyckx, Seiffge-Krenke, et al., Reference Luyckx, Seiffge-Krenke, Schwartz, Goossens, Weets, Hendrieckx and Groven2008). Luyckx and colleagues have suggested that the development of a strong sense of identity during adolescence is associated with more adaptive and less dysfunctional coping strategies (2008). Empirical work linking exploration and commitment processes to coping has found Exploration in Breadth to predict more problem-solving, Exploration in Depth to predict more problem-solving and social support, Ruminative Exploration to predict more avoidance, and Identification with Commitment to predict less avoidance, though more (longitudinal) research is necessary to evaluate the exact interplay (Luyckx et al., Reference Luyckx, Klimstra, Duriez, Schwartz and Vanhalst2012).
Regarding personality and identity, researchers have evaluated to what extent personality development occurs in tandem with identity development. For instance, empirical research investigating the relationship between FFM and identity has found Conscientiousness and Openness to Experience to be the most important determinant of individual differences in identity exploration (e.g., Klimstra et al., Reference Klimstra, Luyckx, Goossens, Teppers and Fruyt2013; Topolewska-Siedzik et al., Reference Topolewska-Siedzik, Cieciuch and Strus2019). Moreover, distinct facets of personality have been found to associate with different identity dimensions in distinct ways, some predicting both a proactive and weakened sense of identity, sketching a complicated picture (Klimstra et al., Reference Klimstra, Luyckx, Goossens, Teppers and Fruyt2013). Longitudinal research using cross-lagged models also provides evidence for clear bidirectionality during early and middle adolescence (Hatano et al., Reference Hatano, Sugimura and Klimstra2017). More theoretical investigations of the relationship between maladaptive personality and identity have also identified important links (Tackett et al., Reference Tackett, Balsis, Oltmanns and Krueger2009). For instance, disruptions in identity consolidation, an important task in adolescent development, have been linked to the development of cluster B and C personality pathology, as these disorders are often associated with identity diffusion or identity fragmentation (Fonagy & Bateman, Reference Fonagy and Bateman2008). Last but not least, more contemporary theories on personality have been linking personality and identity formation more explicitly, describing the self as a multilayered construct with two important layers: a first layer that includes dispositional personality traits and a second layer related to agency and identity (Costa et al., Reference Costa, McCrae and Löckenhoff2019; Luyckx et al., Reference Luyckx, Teppers, Klimstra and Rassart2014; McAdams & Pals, Reference McAdams and Pals2006). As such, these two interconnected layers of the self mark the “having” and the “doing” sides of personality – or how proactive identity formation, that is, making motivated choices, planning your lives, and striving for certain goals, is related to the “doing” side of personality.
Network analysis
To date, the relationships between coping, adaptive and maladaptive personality, and identity have not yet been evaluated using network analysis. Network analysis or psychological network modeling is considered an important alternative to latent variable modeling (e.g., Borsboom & Cramer, Reference Borsboom and Cramer2013). Network analysis assumes a psychological phenomenon can be conceptualized as a network of symptoms or behaviors (or overlapping networks), instead of assuming a latent entity that gives rise to a set of symptoms or behaviors. Each network consists of nodes (i.e., symptoms, behaviors, items of a questionnaire) and the pairwise relations between the nodes (edges or associations) that take into account all other pairwise interactions within the network (so-called partial correlation). Symptoms or behaviors are not conceptualized as interchangeable indicators of an underlying reflective latent variable that causes covariation, for example, “one needs five or more symptoms of X to qualify for a diagnosis of X.” Moreover, symptoms are not reflective of an underlying disorder or construct; that is, depression does not cause sad mood, anhedonia, or insomnia instead, the associations among symptoms, that is, suffering from sad mood, anhedonia and insomnia altogether, constitute the psychological phenomenon itself (Fried, Reference Fried2015; Fried & Cramer, Reference Fried and Cramer2017). Based on the pairwise relations between the nodes, the importance of individual nodes in a (sub)network is expressed via (bridge) network parameters, like node strength, node closeness, node betweenness, bridge strength, or bridge expected influence (for more detailed information, see Epskamp, Reference Epskamp2017; and Jones et al., Reference Jones, Ma and McNally2021).
Network analysis poses a range of unique and important benefits to the study of complex psychological phenomena. For instance, network analysis allows one to investigate distinct phenomena through a bottom-up analysis of the different symptoms or behaviors and their associations with each other (Borsboom, Reference Borsboom2008; Cramer et al., Reference Cramer, Waldorp, van der Maas and Borsboom2010). In doing so, it creates a shift in focus (and information gathering) from phenomena or large constructs to the individual symptoms or behaviors and their associations. In addition, network analysis allows for a better understanding of covariance or comorbidity, as associations between all symptoms or behaviors are investigated, unhindered by any presuppositions, and visualization of specific associations between subnetworks is possible (Cramer et al., Reference Cramer, Waldorp, van der Maas and Borsboom2010). By investigating (bridge) network parameters, influential (bridge) symptoms or behaviors are identified that may be particularly informative in guiding future interventions (Opsahl et al., Reference Opsahl, Agneessens and Skvoretz2010). As such, network analysis may prove uniquely beneficial when wanting to unravel the complex nomological network underlying the coping–personality–identity constructs.
The present study aims to conduct an exploratory investigation of coping, adaptive and maladaptive personality, and identity and their relationships in a large sample of young adults using network analysis. In many Western societies, emerging adulthood is considered one of the most challenging and unstable times of human development (Arnett et al., Reference Arnett, Žukauskienė and Sugimura2014). Today’s so-called “millennials” encounter major life decisions with regard to stable work, marriage, and parenthood. As such, emerging adulthood constitutes a particularly interesting developmental period to investigate the intersection between coping, (mal)adaptive personality, and identity. First up, we aim to investigate the structure of coping, adaptive personality, maladaptive personality, and identity by estimating individual partial correlation networks. Next, we aim to investigate the relationship between these constructs as combined within one complex psychological network.
Method
Participants
This study uses data from the Flemish Study on Parenting, Personlaity, and Development (FSPPD; Prinzie et al., Reference Prinzie, Onghena, Hellinckx, Grietens, Ghesquière and Colpin2003; 1999-current) http://zotero.org/users/438308/items/Z4R8NCPT. At the time of the first data collection, a proportional stratified sample of elementary-school-aged children (aged, 4, 5, 6, or 7 years old) attending regular schools was randomly selected. Strata were constructed according to geographical location, sex, and age. All participants gave written informed consent. For the current study, a total of 457 participants, of which 215 males and 242 females (47% vs. 53%; mean age = 18.85 years, SD = 1.14 years, range 15.9 years–21.3 years at Time 1) were included. All participants completed questionnaires on adolescent personality, personality pathology, identity development (7th wave, Time 1, 2012; aged 17–20 years old), and coping behaviors (8th wave, Time 2, 2015; aged 20–23 years old; not included prior). Note, data on personality (pathology) and identity development were collected 3 years prior to data collection on coping behaviors yet, are considered within the same analysis (see Discussion for a more detailed argumentation).
Measures
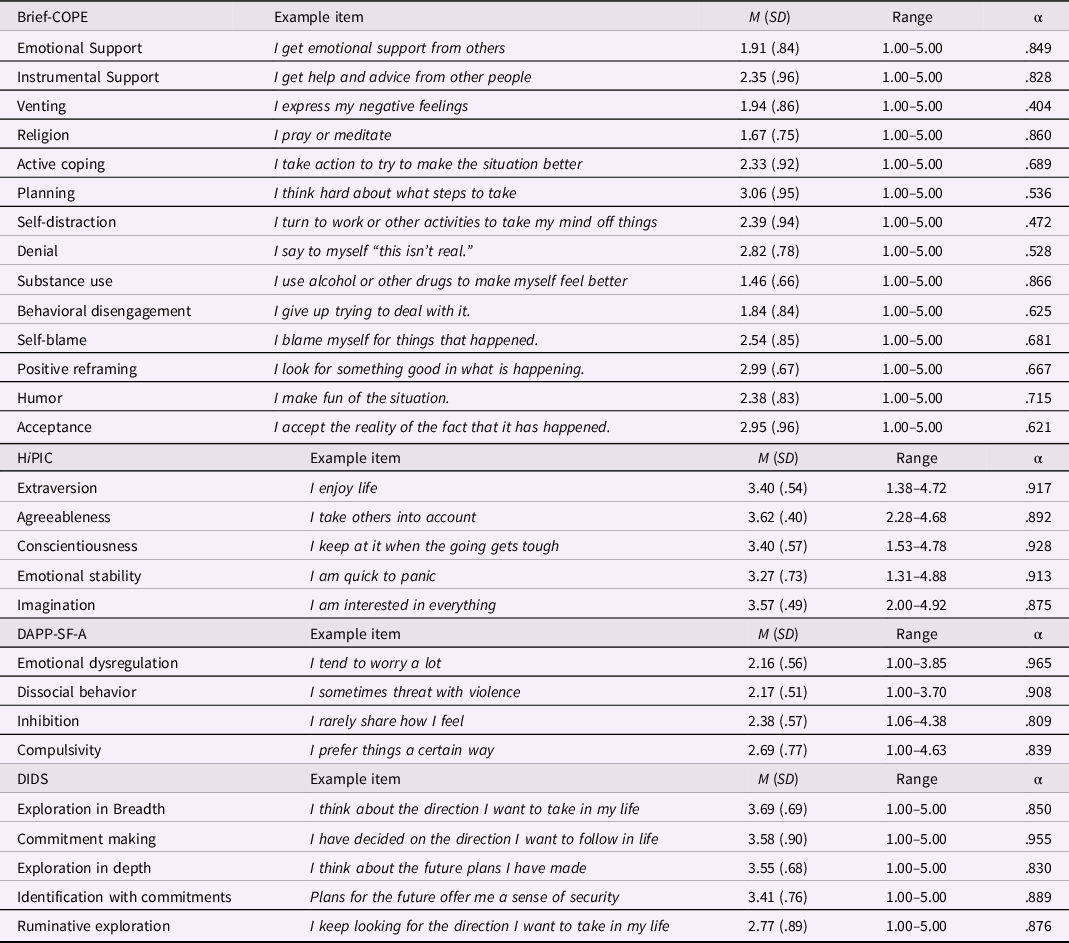
The FSPPD dataset includes one measure of coping behaviors, one measure of adaptive personality, one measure of maladaptive personality, and one measure of identity, here included. See Table 1 for means (M), standard deviations (SD), range, Cronbach’s alphas, and example items, per measure and subscale.
Overview of Brief-COPE, HiPIC, DAPP-SF-A, and DIDS
Brief-COPE
The Brief-COPE, a brief version of the Coping Orientation to Problems Experienced (COPE; Carver, Reference Carver1997), a self-report questionnaire developed to assess how people respond when they are confronted with difficult or stressful events in their lives. The Brief-COPE includes 14 two-item scales: Self-Distraction, Active Coping, Denial, Substance Use, Use of Emotional Support, Use of Instrumental support, Behavioral Disengagement, Venting, Positive Reframing, Planning, Humor, Acceptance, Religion, and Self-Blame. Each item of the Brief-COPE is rated on a 4-point scale, ranging from 1 “I haven’t been doing this at all”, to 4 “I’ve been doing this a lot.” For convenience, the Brief-COPE will be referred to as “COPE” throughout the Data Analysis and Results section.
Hierarchical Personality Inventory for Children
The Hierarchical Personality Inventory for Children (HiPIC; Mervielde & De Fruyt, Reference Mervielde, De Fruyt, Deary, De Fruyt and Ostendorf1999) is a personality questionnaire designed to assess childhood and adolescent personality according to the FFM. The HiPIC inventory includes 18 facets, each facet assessed by 8 items, which are hierarchically structured under five domains: (1) Extraversion, (2) Agreeableness, (3) Conscientiousness, (4) Emotional Stability, and (5) Imagination. The HiPIC domains Extraversion, Conscientiousness, and Emotional Stability are similar in content to their adult Big Five counterpart, hence, received a similar label. HiPIC’s Agreeableness domain is related to the FFM domain of Agreeableness but includes a broader set of traits like traits linked to the “easy–difficult” child temperament concept. HiPIC’s Imagination domain is associated with the FFM Openness to Experience domain, but includes both Intellect and Openness to Experience items, blending the two FFM alternative labels (De Fruyt et al., Reference De Fruyt, Bartels, Van Leeuwen, De Clercq, Decuyper and Mervielde2006). Each item of the HiPIC is rated on a 5-point scale, ranging from 1 “Almost not characteristic” to 5 “Very characteristic.”
Dimensional Assessment of Personality Disorders – Short Form for Adolescents
The Dimensional Assessment of Personality Disorders – Short Form for Adolescents (DAPP-SF-A; Tromp & Koot, Reference Tromp and Koot2008), a shortened version of the Dimensional Assessment of Personality Pathology – Basic Questionnaire (DAPP-BQ; Livesley & Jackson, Reference Livesley and Jackson2009), is a self-report questionnaire that assesses maladaptive personality traits. The DAPP-SF-A consists of 144 items, 136 content items, and 8 validity items, and is comprised of 18 personality dimensions which are hierarchically structured under four domains: (1) Emotional Dysregulation, (2) Dissocial Behavior, (3) Inhibition, and (4) Compulsivity. As such, the DAPP domains are sometimes considered extremes of their FFM counterparts (Krueger, Reference Krueger2005). Each item of the DAPP-SF-A is rated on a five-point Likert scale, ranging from 1 “Very unlike me” to 5 “Very like me.” For convenience, the DAPP-SF-A will be referred to as “DAPP” throughout the Data Analysis and Results section.
Dimensions of Identity Development Scale
The Dimensions of Identity Development Scale (DIDS; Luyckx, Schwartz, et al., Reference Luyckx, Schwartz, Berzonsky, Soenens, Vansteenkiste, Smits and Goossens2008; Luyckx et al., Reference Luyckx, Schwartz, Goossens, Beyers, Missotten, Schwartz, Luyckx and Vignoles2011) is a 25-item self-report questionnaire developed to assess five identity dimensions. The DIDS’ five identity dimensions include (1) Exploration in Breadth, (2) Commitment Making, (3) Exploration in Depth, (4) Identification with Commitments, and (5) Ruminative Exploration. Each item of the DIDS is rated on a 5-point Likert scale, ranging from 1 “Strongly disagree” to 5 “Strongly agree.”
Data analysis
All analyses were run in R 3.5.2 using R-packages qgraph, bootnet, and networktools (Epskamp, Reference Epskamp2017). First, individual partial correlation networks per construct were estimated and evaluated. Next, a combined partial correlation network including all constructs was estimated and evaluated. By constructing the individual partial correlation networks first, (changes to) the network structure of each domain within the combined network can be better evaluated. Networks were estimated using Gaussian Markov random field estimation using graphical Least Absolute Shrinkage and Selection Operator to reduce the number of edges and therefore create a parsimonious model. The optimal regularization parameters were selected using the extended Bayesian information criterion. Node centrality measures, that is, node strength, node closeness, and node betweenness, were estimated to determine the relative importance of each node within the network. Bridge centrality measures, that is, bridge strength, bridge expected influence (1-step), and bridge expected influence (2-step), were estimated to determine the bridge quality of each node given the four distinct subnetworks. Stability of the centrality indices was evaluated using a case-dropping subset bootstrap (1000 iterations), with CS-coefficients = .25 acceptable and CS-coefficients >= .50 preferable (Epskamp, Borsboom, et al., Reference Epskamp, Borsboom and Fried2018). For more background information on network analysis, (bridge) centrality measures and procedures to evaluate stability, see tutorials by Epskamp et al. (Reference Epskamp, Waldorp, Mõttus and Borsboom2018) and Jones et al. (Reference Jones, Ma and McNally2021). All analyses include the leading level of analysis for each of the four measures, that is, the 14 subscales of the Brief-COPE, the five subdomains of the HiPIC, the four subdomains of the DAPP-SF-A, and the five dimensions of the DIDS. The data and analysis script that support the findings of this study are available from the corresponding author upon reasonable request.
Results
Individual networks
To investigate the structure of coping as measured by the COPE, adaptive personality as measured by the HiPIC, maladaptive personality as measured by the DAPP-SF-A, and identity as measured by the DIDS, four partial correlation networks were estimated. Visualizations of these estimated partial correlation (pr) networks including all edges and edge weights are shown in Figure 1.
Estimated partial correlation networks of the COPE (A1-A14), the HiPIC (B1-B5), the DAPP-SF-A (C1-C4), and the DIDS (D1-D5). Blue lines represent positive connections, red lines represent negative connections. The thickness and brightness of an edge indicate the association strength, the edge weight is reported on the edge itself. The absence of edges between nodes implies statistical independence or insufficient power to detect an association between these nodes.

For the COPE network, most coping styles proved positively associated with each other, with 14 nodes connected by 19 positive associations. Overall, Emotional Support (A1) proved particularly well connected with associations with Instrumental Support (.22; A1-A2), Venting (.12; A1-A3), Active Coping (.13; A1-A5), Substance Use (.19; A1-A9), Behavioral Disengagement (.19; A1-A10), and Self-Blame (.14; A1-A11). In addition, Active Coping (A5), associated with Emotional Support (.13; A5-A2), Behavioral Disengagement (.24; A5-A10), Self-Blame (.20; A5-A11), and Acceptance (.17; A5-A14), and Self-Distraction (A7), associated with Instrumental Support (.15; A7-A2), Venting (.17; A7-A3), Religion (.19; A7-A4), and Humor (.16; A7-A13), also proved well-connected. Interestingly, Positive Reframing (A12) was not connected to any other node within the network.
For the HiPIC network, all five personality domains proved positively associated with one or two nodes within the network, with 5 nodes connected by 4 large associations (pr > .28). Extraversion (B1) was associated with both Emotional Stability (.33; B4-B1) and Imagination (.36; B5-B1), whereas Conscientiousness (B3) was associated with both Agreeableness (.31; B2-B3) and Imagination (.28; B5-B3).
For the DAPP network, all four maladaptive personality factors were positively connected within the network, with 4 nodes connected by 3 large associations (pr > .29). In fact, positive associations emerged between Emotional Dysregulation (C1) and each of the remaining nodes, that is Dissocial Behavior (.35; C1-C2), Inhibition (.35; C1-C3), and Compulsivity (.29; C1-C4).
For the DIDS network, all five identity dimensions were interconnected within the network, with 5 nodes connected by 7 positive and 2 negative associations. Commitment Making (D1), Exploration in Breadth (D2), Identification with Commitments (D4), and Exploration in Depth (D5) showed (strong) positive associations with each other, while Ruminative Exploration (D3), the so-called “risk factor” to the second developmental cycle of identity formation, distinguished itself from the crowd with strong, negative associations with Commitment Making (-41; D3-D1) and Identification with Commitments (-.29; D3-D4).
To investigate node centrality, a node’s relative importance within a network, node strength, node closeness, and node betweenness were estimated. Visualizations of the centrality measures for each of the four networks are shown in Figure 2. Evaluating the node centrality measures shows node strength is the most stable centrality measure across all networks (CS(cor = 0.7) = 0.595–0.751), yet for the DAPP network node strength should be interpreted with care (CS(cor = 0.7) = 0.361). For the COPE network, node strength was highest for Emotional Support (A1), Venting (A3), Religion (A4), and Behavioral Disengagement (A10), whereas node betweenness and node closeness were highest for Emotional Support (A1) and Behavioral Disengagement (A10). Overall, Emotional Support (A1), Religion (A4), and Behavioral Disengagement (A10) appear most dominant in shaping the COPE network. For the HiPIC network, node strength, node betweenness, and node closeness were highest for Extraversion (B1), Conscientiousness (B3), and Imagination (B5). For the DAPP network, node strength, node betweenness, and node closeness were highest for Emotional Dysregulation (C1), suggesting Emotional Dysregulation plays a pivotal role when capturing maladaptive personality. For the DIDS network, node strength was low for Exploration in Breadth (D2), while node betweenness and node closeness were highest for Identification with Commitments (D4).
Centrality indices of node strength, closeness, and betweenness for the estimated shown left-to-right and top-to-bottom. Bridge centrality indices of bridge expected influence (1-step), bridge expected influence (2-step), and bridge strength for the all-combined network, shown bottom row. All indices are shown as standardized Z-scores. See Figure 1 and Figure 3 for the descriptions of the shortcodes.

Combined network
To investigate the relationship between coping as measured by the COPE, adaptive personality as measured by the HiPIC, maladaptive personality as measured by the DAPP-SF-A, and identity as measured by the DIDS, a complex partial correlation network was estimated. The all-combined network shows the COPE, HiPIC, and DAPP as intertwined subnetworks, while the DIDS presents as a largely distinct subnetwork. Of the 50 pairwise associations that emerged in total, the strongest associations (|pr| > .20), namely 21 positive associations and 6 negative associations, will be considered here. Visualization of the estimated partial correlation network including all edges and edge weights is shown in Figure 2. For detailed information on the (partial) correlations between all nodes see Table 2.

Within the subnetworks, positive associations (pr > .20) between Venting and Religion (.30; A3-A4), Religion and Substance Use (.26; A4-A9), Extraversion and Imagination (.30; B1-B5), Conscientiousness and Imagination (.21; B3-B5), Emotional Dysregulation and Dissocial Behavior (.33; C1-C2), Commitment Making and Identification with Commitments (.45; D1-D4), Exploration in Breadth and Exploration in Depth (.35; D2-D5), and Identification with Commitments and Exploration in Depth (.33; D4-D5), and negative associations (pr < -.20) between Commitment Making and Ruminative Exploration (-.42; D1-D3) and Ruminative Exploration and Identification with Commitments (-.24; D3-D4), emerged. In other words, within-subnetwork associations were mostly strong for the DIDS, less so for the three other subnetworks.
Between subnetworks, positive associations (pr > .20) between Emotional Dysregulation (C1) on the one hand and Emotional Support (.21; A1-C1), Instrumental Support (.29; A2-C1), Venting (.25; A3-C1), Self-Distraction (.34; A7-C1), Humor (.29; A13-C1), emerged. Moreover, Inhibition was strongly associated with Active Coping (.26; A5-C3) and Self-Blame (.29; A11-C3) while Dissocial Behavior was strongly associated with Denial (.25; A8-C2), Extraversion (.24; B1-C2), and Emotional Stability (.34; B4-C2). Finally, Planning was associated with Compulsivity (.70; A6-C4), Behavioral Disengagement with Compulsivity (.29; A10-C4), and Conscientiousness with Compulsivity (.29; B3-C4). In terms of negative associations (pr < -.20), Extraversion was strongly associated with both Active Coping (-.26; A5-B1) and Inhibition (-.28; B1-C3), while Agreeableness was negatively associated with Dissocial Behavior (-.42; B2-C2), and Emotional Stability with Emotional Dysregulation (-.31; B4-C1). In other words, high Emotional Dysregulation (C1) was associated with high Emotional (A1) and Instrumental Support (A2), Venting (A3), Self-Distraction (A7), Humor (A13), and low Emotional Stability (B4), high Dissocial Behavior (C2) was associated with high Extraversion (B1) and Emotional Stability (B4), and low Agreeableness (B2), high Inhibition (C3) was associated with high Active Coping (A5) and Self-Blame (A11) and low Extraversion (B1), high Compulsivity (C4) was associated with high Planning (A6), Behavioral Disengagement (A10), and Conscientiousness (B3), and high Active Coping (A5) was associated with low Extraversion (B1). As such, the COPE and HiPIC subnetwork only share one |pr| > .20 association (-.26; A5-B1). Beyond that, both subnetworks are mostly connected as a result of numerous associations between the HiPIC and the DAPP. The COPE and DAPP subnetwork are connected through a multitude of direct associations, in particular via Emotional Dysregulation (C1; 16 pairwise associations), suggestive of a pivotal role for Emotional Dysregulation (C1) in bridging (mal)adaptive personality and coping. The DIDS is only connected to the other subnetworks via one (weak) association between Emotional Dysregulation and Commitment Making (.07; C1-D1).
To investigate bridge centrality, a node’s relative importance in connecting two or more subnetworks, bridge strength, bridge expected influence (1-step), and bridge expected influence (2-step) were estimated. Visualizations of the bridge centrality indices for the combined network are shown in Figure 3. Evaluating these bridge centrality measures suggests bridge strength and bridge expected influence are stable centrality measures (CS(cor = 0.7) = 0.751). Across all indices, Emotional Dysregulation (C1), Inhibition (C3), and Compulsivity (C4), followed by Planning (A6) and Dissocial Behavior (C2), have the highest values of all nodes, thus exerting the most bridging influence over the network. As such, a dominant role for the DAPP nodes is revealed.
Estimated partial correlation network of the COPE-HiPIC-DAPP-DIDS. Blue lines represent positive connections, red lines represent negative connections, and the thickness and brightness of an edge indicate the association strength. The absence of edges between nodes in the panel on the right implies statistical independence or insufficient power to detect an association between these nodes. For detailed information on the (partial) correlations between all nodes see Table 2.

Discussion
The present study aimed to investigate coping, adaptive and maladaptive personality, and identity and their relationships in a large community sample of young adults using exploratory network analysis. First, we investigated the structure of coping, adaptive and maladaptive personality, and identity within individual networks and evaluated the node centrality of each node within those networks. Second, we investigated the relationship between these constructs as combined within one network and evaluated the bridge centrality of each node within that network. Overall, results indicate clear associations between coping as measured by the COPE, and (mal)adaptive personality as measured by the HiPIC and DAPP, suggesting coping and personality are distinct, yet highly related constructs, whereas associations with identity as measured by the DIDS remained limited. Overall, Emotional Dysregulation (DAPP), Emotional Support (COPE), Planning (COPE), Behavioral Disengagement (COPE), Inhibition (DAPP), and Compulsivity (DAPP) were identified as important nodes in bridging coping, adaptive, and maladaptive personality.
Individual networks
For the individual networks, the networks on coping (Brief-COPE), (mal)adaptive personality (HiPIC or DAPP-SF-A), and identity (DIDS) indicate (mostly) positive pairwise associations within each network. Regarding coping, most coping styles proved positively associated with each other, with 14 nodes connected by 19 associations. Overall, Emotional Support, Active Coping, and Behavioral Disengagement proved most dominant in shaping the COPE network. As such, these three may prove of great importance in improving one’s ability to cope with difficulties or stress in general. Positive Reframing was not associated with any other node within the network, suggestive of statistical independence or a symptom of insufficient power to detect an association (although a large sample was employed). Follow-up research into the network structure of the Brief-COPE could shed more light on the (in)dependence of Positive Reframing as a node within the network. The current network analysis suggests Emotional Support, Active Coping, and Behavioral Disengagement are central to the structure of the model. The heterogeneous clusters present within the network, which each grouping/cluster including some pro-social, some passive, and some more active coping strategies, suggest individuals present with a variety of coping strategies enabling them to employ their coping strategies adaptively in line with the specific demands of situations at hand (Bonanno & Burton, Reference Bonanno and Burton2013; Cheng et al., Reference Cheng, Lau and Chan2014).
Regarding (mal)adaptive personality, notable differences emerged between the network as measured by the HiPIC and the network as measured by the DAPP-SF-A. For the HiPIC network, all five personality domains proved positively associated with at least one or more nodes within the network. Moreover, Extraversion, Conscientiousness, and Imagination were connected to two other nodes within the network, whereas Agreeableness and Emotional Stability were only connected to one other node within the network. Therefore, depending on whether one is interested in shared or unique loadings, it may be more interesting to focus on the first three versus the latter two. Interestingly, Agreeableness and Emotional Stability have been suggested as most clinically relevant when measuring personality in relation to maladaptive functioning and well-being (for a meta-analysis, see Malouff et al., Reference Malouff, Thorsteinsson and Schutte2005; Ode & Robinson, Reference Ode and Robinson2009). For the DAPP-SF-A network, Emotional Dysregulation presented itself at the center of the network with positive associations with Dissocial Behavior, Inhibition, and Compulsivity. To some extent, this suggests that when investigating maladaptive personality traits, one’s level of emotional dysregulation is most informative as high emotional dysregulation was associated with high dissocial behavior, inhibition, and compulsivity (and the reverse). The difference in node dominance and network shape between the HiPIC and DAPP-SF-A networks is striking given that both include similar scales, yet their respective networks were dominated by different content scales. Based on the structure of networks, HiPIC’s measurement of adaptive personality is more balanced, with each dimension accounting for a distinct subaspect, whereas DAPP-SF-A’s measurement of maladaptive personality is centered around Emotional Dysregulation. This insight may prove important in understanding the difference between adaptive and maladaptive personality, how they each develop, and the role of Emotional Dysregulation therein.
Regarding identity, all five identity dimensions were interconnected within a rather tight-knit, balanced network, with 5 nodes connected by 7 positive and 2 negative associations. Commitment Making, Identification with Commitments, and (their negative associations to) Ruminative Exploration proved most central to the DIDS network. This is in line with the dual-cycle model developed by Luyckx et al. (Reference Luyckx, Schwartz, Berzonsky, Soenens, Vansteenkiste, Smits and Goossens2008); a first cycle which focuses on the formation of identity commitments, including Exploration in Breadth and Commitment Making, and a second cycle which focuses on the evaluation of commitments, including Exploration in Depth and Identification with Commitments, whereas difficulties with or within cycles in terms of maladaptive development or exploration are captured by Ruminative Exploration, as seen within the network model (Luyckx, Schwartz, et al., Reference Luyckx, Schwartz, Berzonsky, Soenens, Vansteenkiste, Smits and Goossens2008).
Combined network
For the combined network, which included coping (Brief-COPE), (mal)adaptive personality (HiPIC and DAPP-SF-A), and identity (DIDS), results indicate a wide range of (in)direct associations between coping and both adaptive and maladaptive personality, whereas associations with identity remained limited.
Looking at coping in relation to both adaptive and maladaptive personality, significant associations were revealed, suggesting coping and personality – whether conceptualized as adaptive or maladaptive personality – are distinct, yet highly related constructs. Using the four domains of the DAPP-SF-A, located at the heart of the combined network, results indicate (1) Emotional Dysregulation is positively associated with Emotional and Instrumental Support, Venting, Self-Distraction, and Humor, and is negatively associated with Emotional Stability, (2) Dissocial Behavior is positively associated with Extraversion, and Emotional Stability, and negatively associated with Agreeableness, (3) Inhibition is positively associated with Active Coping and Self-Blame and negatively associated with Extraversion, and (4) Compulsivity is positively associated with Planning, Behavioral Disengagement, and Conscientiousness. Interestingly, coping and adaptive personality seem connected mostly as a result of the numerous associations between coping and maladaptive personality and between maladaptive and adaptive personality. In other words, coping, which is problem-oriented (“I blame myself for things that happen”), seems to link to adaptive personality (“I enjoy life”), via maladaptive personality, which is about personality in relation to difficulties (“I tend to worry a lot”). This may come as no surprise, given adaptive personality is considered more dispositional, related to temperament (Cloninger, Reference Cloninger1994), while coping and maladaptive personality are more at the level of specific thoughts, actions, and emotions in response to stressors in the external words (Bijttebier & Vertommen, Reference Bijttebier and Vertommen1999). Moreover, maladaptive personality has been associated with significant distress and impairment previously, which in turn is related to maladaptive coping (e.g., Ireland et al., Reference Ireland, Brown and Ballarini2006). In line with that is the relative importance of Emotional Dysregulation within the combined network, as references to coping seem inherent to common descriptions of the Emotional Dysregulation factor itself: that is, low scores on Emotional Dysregulation suggest one experiences emotional and behavioral difficulties in (dealing with) stressful situations (e.g., emotionality, frustration, distress, anxiety, and aggression) and how items are formulated (Livesley & Jackson, Reference Livesley and Jackson2009).
Previous research suggests one’s personality affects one’s coping preferences, both directly, with personality constraining or facilitating the use of specific strategies, and indirectly, with personality influencing the nature and severity of stressors experienced or the effectiveness of certain coping strategies (Carver & Connor-Smith, Reference Carver and Connor-Smith2010; Hughes et al., Reference Hughes, Kratsiotis, Niven and Holman2020). Empirical research investigating the relationship between coping and FFM has found clear associations for Emotional Stability, Extraversion, and Conscientiousness, while less so for Agreeableness and Openness to experience (e.g., Fickova, Reference Fickova2009; Penley & Tomaka, Reference Penley and Tomaka2002). When translating our findings regarding adaptive and maladaptive personality (HiPIC and DAPP-SF-A, respectively) using the respective FFM scales, our analyses show (1) Emotional Stability to be negatively associated with Instrumental Support, Venting, Self-Distraction, and Humor, (2) Extraversion to be negatively associated with Active Coping, Self-Blame and Positive Reframing, (3) Conscientiousness to be positively associated with Planning and Behavioral Disengagement, and (4) Agreeableness to be negatively associated with Denial. In part, this is in line with previous research where Emotional Stability was found to predict more emotion-focused coping, active coping, and social support as well as less problem-focused coping (e.g., Vollrath & Torgersen, Reference Vollrath and Torgersen2000), Extraversion to predict more active coping and social support and less emotion-focused coping (Watson & Hubbard, Reference Watson and Hubbard1996), Conscientiousness to predict more problem-focused coping and less emotion-focused coping (e.g., Fickova, Reference Fickova2009; Penley & Tomaka, Reference Penley and Tomaka2002) and personality pathology to predict less social support seeking and more avoidance (Bijttebier & Vertommen, Reference Bijttebier and Vertommen1999; Ireland et al., Reference Ireland, Brown and Ballarini2006). However, combining our findings for adaptive and maladaptive personality using the respective FFM scales warrants cautiousness. Relationships between both constructs are not exactly in line with what one would expect based on their FFM profile. In theory, Emotional Dysregulation is to resemble Emotional Stability, Dissocial Behavior is opposite to Agreeableness, Inhibition is opposite to Extraversion, Compulsivity is to resemble FFM’s Compulsivity, and Openness to Experience is not captured by the DAPP. Looking at our findings, our results match up for Agreeableness and Conscientiousness, as a strong negative association between Agreeableness and Dissocial Behavior and a positive association between Conscientiousness and Compulsivity emerged. Moreover, Openness to Experience indeed did not link to any of the DAPP scales. However, not for Emotional Stability and Extraversion, as a negative association emerged between Emotional Stability and Emotional Dysregulation and between Extraversion and Inhibition, yet positive associations emerged between Emotional Stability and Dissocial Behavior and Extraversion and Dissocial Behavior. In line with that, Tackett et al. (Reference Tackett, Herzhoff, Reardon, Smack and Kushner2013) and De Pauw (Reference De Pauw and Widiger2017) have suggested that mapping different FFM-like questionnaires might not prove so straightforward. Previous research looking into the relationship between adaptive and maladaptive personality has indicated that mapping of these constructs based on theoretical assumptions or semantic similarities of scale labels tends to leave a messy overall picture, with some overlapping and some nonoverlapping variance, especially for Emotional Stability, Extraversion, and Dissocial Behavior (De Pauw, Reference De Pauw and Widiger2017; Tackett et al., Reference Tackett, Herzhoff, Reardon, Smack and Kushner2013).
Regarding identity, the combined network shows that identity, as measured by the DIDS, remains relatively unchanged in the presence of coping, adaptive, and maladaptive personality, suggesting that identity is a more distinct construct and is not easily predicted by coping strategies or (mal)adaptive personality traits (Klimstra, Hale, et al., Reference Klimstra, Hale, Raaijmakers, Branje and Meeus2010; Marcia, Reference Marcia and Adelson1980). Whereas previous nomological or longitudinal research looking at coping, personality traits, and identity did reveal significant associations such as Exploration in Breadth to predict more problem solving, Exploration in Depth to predict more problem solving and social support, Ruminative Exploration to predict more avoidance, Identification with Commitment to predict less avoidance (Luyckx et al., Reference Luyckx, Klimstra, Duriez, Schwartz and Vanhalst2012; Luyckx, Seiffge-Krenke, et al., Reference Luyckx, Seiffge-Krenke, Schwartz, Goossens, Weets, Hendrieckx and Groven2008), and Conscientiousness and Openness-to-Experience be the most important determinant of individual differences in identity exploration (e.g., Klimstra et al., Reference Klimstra, Luyckx, Goossens, Teppers and Fruyt2013; Topolewska-Siedzik et al., Reference Topolewska-Siedzik, Cieciuch and Strus2019), the current analyses found limited associations along those lines. Within the combined network, the DIDS was only connected to the other subnetworks via one (weak) association between Emotional Dysregulation and Commitment Making. In a way, identity’s relative independence within the combined network may be somewhat in line with the conceptual approaches by McCrae and Costa (Costa et al., Reference Costa, McCrae and Löckenhoff2019; McCrae & Costa, Reference McCrae, Costa and Wiggins1996) and McAdams and Pals (Reference McAdams and Pals2006), where aspects related to identity and the self are positioned at distinct levels of the respective models as well. It is important to note, however, that as identity development entails a process where structural aspects of one’s identity may undergo continual development across the life span (Luyckx et al., Reference Luyckx, Goossens and Soenens2006; Luyckx, Seiffge-Krenke, et al., Reference Luyckx, Seiffge-Krenke, Schwartz, Goossens, Weets, Hendrieckx and Groven2008), identity may intertwine differently with coping or (mal)adaptive personality at different time points in life. As such, current findings regarding identity and emerging adulthood may not directly translate to other developmental stages.
Implications, limitations, and future directions
The current study has clear implications for both research and clinical practice. By visualizing the structure of coping, (mal)adaptive personality and identity and their relationships, as well as identifying the most central nodes within each construct and key bridge nodes linking these constructs, these results allow for new insights into coping, (mal)adaptive personality, and identity as interrelated constructs. For instance, coping, adaptive, and maladaptive personality proved to be distinct, yet highly related constructs, whereas identity presented as a tight-knit, distinct construct. In addition, Emotional Dysregulation, alongside Emotional Support, Planning, Behavioral Disengagement, Inhibition, and Compulsivity were identified as central (bridge) nodes within and/or between both constructs. As such, one can argue that, if such relationships are also evident following longitudinal and/or within-person investigations, these nodes hold particular promise for the design of intervention and prevention programs and new research on coping and personality in general. In fact, emotional regulation has been investigated in recent years concerning the development of fitting interventions to treat those suffering from mental illness (e.g., Dadomo et al., Reference Dadomo, Panzeri, Caponcello, Carmelita and Grecucci2018). However, two important remarks need to be considered.
Firstly, the present study employed a cross-sectional rather than longitudinal design. This means that, although networks based on cross-sectional data can generate insights into the constructs of investigation and hypotheses about directed, causal or predictive relationships between different nodes (Epskamp, Waldorp, et al., Reference Epskamp, Waldorp, Mõttus and Borsboom2018), the data does not allow to draw such formal conclusions, also given the exploratory nature of the research design. Moreover, cross-sectional data cannot account for potential developmental patterns either. Nodes that are central to a network or seem to function as a bridge node between two subnetworks like, for instance, Emotional Dysregulation, may hold great potential regarding treatment or intervention yet, additional data, albeit longitudinal or time-series data, is required to put those hypotheses to the test (Fried et al., Reference Fried, Eidhof, Palic, Costantini, Huisman-Van Dijk, Bockting, Engelhard, Armour, Nielsen and Karstoft2018). Moreover, the presented networks include aggregated, group-level data rather than individualized, person-specific networks. While networks of aggregated data help ensure adequate stability and replicability of the estimated network, heterogeneity at the level of the individual is likely to get lost in that process (Fried & Cramer, Reference Fried and Cramer2017).
Secondly, the present study assessed coping, (mal)adaptive personality, and identity in a non-clinical community sample of young adults using self-report questionnaires. Each construct was measured using one questionnaire only – and coping was assessed at a later stage than the others. Accordingly, the current data and the networks estimated based on this data may not be entirely representative of coping, personality, and identity development for distinctly different datasets, say a different age group or a population with (sub)clinical psychopathology. While previous research suggests coping behavior to be relatively stable within early adulthood (Jenzer et al., Reference Jenzer, Read, Naragon-Gainey and Prince2019; Kirchner et al., Reference Kirchner, Santacana, Amador-Campos and Muñoz2010), different (or stronger) associations may be revealed in case all data is collected at one timepoint only or in the case of observer-rated measures rather than self-report measures or in. While it is important these constructs and their relationships are evaluated within a typically developing sample, current estimations are best replicated with the inclusion of different (sub)samples and observers to explore its generalizability and/or developmental nature.
To conclude, the current study, based on data from the FSPPD study, investigated coping, (mal)adaptive personality, and identity and their relationship in young adults, using network analysis. Overall, results indicate clear associations between coping as measured by the Brief-COPE, adaptive personality as measured by the HiPIC, and maladaptive personality as measured by the DAPP-SF-A, suggesting that coping, adaptive, and maladaptive personality are distinct, yet highly related constructed, whereas associations with identity as measured by the DIDS, remained limited. Emotional Dysregulation, alongside Emotional Support, Planning, Behavioral Disengagement, Inhibition, and Compulsivity were identified as important nodes in bridging coping, (mal)adaptive personality, and identity. Future research may seek to continue this line of investigation and aim to replicate the current networks using longitudinal data, individualized networks, or distinctly different samples.
Funding statement
This research received no specific grant from any funding agency, commercial, or not-for-profit sectors.
Conflicts of interest
None.


 Open access