

INTRODUCTION
In the acquired reading disorder of letter-by-letter reading, words can only be pronounced after each letter is identified individually. Theories of the cognitive deficit underlying this disorder vary widely. At one extreme is the orthographic hypothesis in which letter-by-letter reading is considered to be a consequence of an impairment specific to letters and/or words, such as in processing abstract identities of letters (Arguin & Bub, 1993, 1994; Miozzo & Caramazza, 1998), word-form representations (Warrington & Langdon, 1994; Warrington & Shallice, 1980), or in accessing phonological codes (Arguin et al., 1998, 2002; Bowers et al., 1996). At the other extreme is the visual hypothesis in which letter-by-letter reading is proposed to result from disturbances in basic visuoperceptual mechanisms that are not specific to orthographic materials. Such deficits have been found using a variety of different types of stimuli, including object drawings (Behrmann et al., 1998; Friedman & Alexander, 1984; Kinsbourne & Warrington, 1962) and geometric forms (Farah & Wallace, 1991; Kinsbourne & Warrington, 1962; Sekuler & Behrmann, 1995). One of the most common visuoperceptual impairments has been seen in the rapid processing of multiple visual stimuli presented either simultaneously (Farah & Wallace, 1991; Kinsbourne & Warrington, 1962; Levine & Calvanio, 1978) or in close temporal proximity (Behrmann & Shallice, 1995; Ingles & Eskes, 2007; Kinsbourne & Warrington, 1962). It is thought that this deficit prevents patients from processing the multiple letters in words simultaneously and that they develop a letter-by-letter strategy to compensate.
The orthographic and visual hypotheses have strong implications for understanding the neural representations of reading. While the orthographic hypothesis considers the brain to contain systems dedicated to reading that can be selectively damaged, the visual hypothesis assumes that reading relies on neural systems that are responsible for processing a range of visuoperceptual stimuli. Obtaining conclusive evidence in favor of either of these hypotheses has been challenging. This finding has been due, at least in part, to the fact that letter-by-letter readers typically have extensive left occipitotemporal lesions that would be expected to impair multiple processes, and it has been difficult to determine which impairments are causal to the dyslexia, as opposed to associative. However, there is good evidence from functional brain imagery in normal subjects for some neural specificity in that certain occipitotemporal regions respond more to letters and/or words than to other types of visual stimuli, such as faces, objects, or digits (e.g., Cohen et al., 2000; Gauthier et al., 2000; Ishai et al., 1999; James et al., 2005; Polk et al., 2002; Puce et al., 1996). Importantly though, the orthographic activations tend to be relative, not absolute, and other perceptual stimuli activate the same areas to a lesser extent (Cohen & Dehaene, 2004). These types of data suggest that the orthographic and visual hypotheses of letter-by-letter reading may not be mutually exclusive and that lesions to an “orthographic” area may also impair processing of other types of visual stimuli.
Consequently, Farah (1999) rejected the extreme versions of the orthographic and visual hypotheses and instead proposed a theory in which letter-by-letter reading results from a general visuoperceptual impairment that may affect multiple types of stimuli, but that is most severe for orthography. Polk and Farah (1995, 1998) also developed a computational model to demonstrate how a normal brain could acquire an area specialized for letters but able to process, to some extent, other types of stimuli, in particular digits. Farah (1999) postulated that, if this letter area of the brain was then damaged, especially poor performance on letter tasks, with milder reductions on digit tasks, would be found, and a letter-by-letter strategy might be used in reading to help compensate for this deficit. Farah did not have patient data to support her theory, however.
Processing of digits in letter-by-letter readers has been studied relatively infrequently. Some studies have shown that letter-by-letter readers were impaired at matching digit strings (Farah & Wallace, 1991; Levine & Calvanio, 1978). Others have observed that reading single-digits was better than multidigits (Cohen & Dehaene, 1995; Dejerine, 1892; Holender & Peereman, 1987; McNeil & Warrington, 1994), much like the superior reading of single letters relative to multiletter words. Despite these findings, direct comparisons of digit and letter processing in the same individual have not yet been conducted. As noted by Farah (1999), the lack of studies contrasting digits and letters in letter-by-letter reading is surprising given the considerable relevance of this comparison to the issue of orthographic specificity in this disorder. Digits have similar visual characteristics to letters and are also visually arbitrary, symbolic forms, but are nonorthographic. Indeed, systematic comparisons of letter and digit processing are scarce even in the larger field of acquired language disorders (Denes & Signorini, 2000; Seron, 2001).
The present study directly compared visual processing of letters and digits in a letter-by-letter reader using an RSVP task and a speeded matching task. Comparisons were made to a group of six brain-damaged individuals without reading impairments. This methodology allows for impaired measures of performance in the experimental tasks to be more confidently interpreted as related to the reading deficit, rather than due to nonspecific effects of brain damage. Similar patterns of impairment with letters and digits in G.M., relative to the controls, would support the visual hypothesis of letter-by-letter reading. Impairment with letters but not digits would be consistent with the orthographic hypothesis. A disproportionate impairment with letters over digits, but with both stimuli types more impaired than controls, would support Farah's (1999) theory of this disorder.
SUBJECTS
Full details of G.M.'s medical history and results of neuropsychological testing were provided previously (Ingles & Eskes, 2007). Briefly, at age 37, G.M. suffered a cerebral hemorrhage as a result of a ruptured arteriovenous malformation. A computed tomography report at that time indicated that he had a 4-cm hyperdense lesion in the occipitotemporal region of the left cerebral hemisphere. He is right-handed and has a grade 10 education. The current data were collected 4 years following his cerebral hemorrhage. At that time, his cognitive deficits included letter-by-letter reading, surface dyslexia and dysgraphia, and anomia.1
G.M. was able to provide accurate verbal descriptions of all objects that he was unable to name, indicating that he recognized the objects perceptually and had access to related semantic information (Ingles & Eskes, 2007).
Six individuals who had previously experienced a stroke (five infarcts, one hemorrhage; three in left-hemisphere, three in right-hemisphere) served as controls (for details, see Ingles & Eskes, 2007). Subjects were approximately matched to G.M. in age (ranged from 37–58 years) and education (ranged from 10–12 years). Their level of cognitive functioning varied, but all performed in the average range on the Wide Range Achievement Test reading subtest (Wilkinson, 1993). The study was conducted in accordance with standards of the university and hospital ethics committees and the Helsinki Declaration.
Complete descriptions of the oral reading protocol and performance were provided previously (Ingles & Eskes, 2007). Briefly, G.M. and controls were tested with a set of 240 individual words in which the variables of word length (4, 5, 6, and 7 letters), frequency [high: > 100; medium: 20–99; low: < 20; (Kucera & Francis, 1967)], and regularity (regular, irregular) were manipulated. G.M.'s reading latencies were very slow and dramatically increased as word length increased. A regression line plotted with reaction time (RT) against word length revealed a linear fit (r = .94; p < .06) with a slope of 1230 ms/letter. This word length effect is the defining characteristic of letter-by-letter reading. In contrast, the reading RTs of the controls were not affected by word length. In addition, the accuracy of G.M.'s reading was strongly affected by word regularity; he had more difficulty reading irregular words (62% correct) than regular words (90% correct). This accuracy pattern is consistent with a diagnosis of surface dyslexia, which accompanies letter-by-letter reading in some cases (e.g., Bowers et al., 1996; Friedman & Hadley, 1992; Patterson & Kay, 1982).2
Other aspects of G.M.'s performance were consistent with diagnoses of surface dyslexia and dysgraphia (Ingles & Eskes, 2007). In tests of reading, his performance was worst with low frequency irregular words. In lexical decision tasks, he made more errors with irregular words than regular words and tended to accept pseudohomophones as words. In both reading and writing, his errors consisted primarily of regularizations.
EXPERIMENT 1: IDENTIFICATION OF LETTERS AND DIGITS IN RSVP
Letter-by-letter readers commonly have difficulty with rapid processing of multiple visual stimuli (Behrmann & Shallice, 1995; Farah & Wallace, 1991; Ingles & Eskes, 2007; Kinsbourne & Warrington, 1962; Levine & Calvanio, 1978). We recently demonstrated that G.M. was impaired on a temporal processing task known as RSVP (Ingles & Eskes, 2007). In this particular RSVP task (referred to as a “stream” task), two letters were embedded at varying temporal positions in a stream of rapidly presented digits. After each stream, the letter identities were reported. G.M. required an extended period of time after he had processed one letter before he was able to reliably identify a second letter, relative to brain-damaged controls. As well, his report of the second letter was most impaired when it immediately followed the first letter, a pattern not seen in the controls, indicating that G.M. had particular difficulty processing the two items together. His ability to identify rapidly presented letters, regardless of the interval between them, was also worse than the controls, suggesting a deficit in the visuoperceptual processing of letters. However, because G.M. was tested only with letter stimuli, we were unable to determine whether his RSVP deficits were observable with nonorthographic stimuli such as digits.
In the current experiment, we compared G.M.'s letter and digit processing using an RSVP paradigm in which there was no distractor stream. Each trial consisted of two successively presented targets, each followed by a pattern mask, and the intertarget interval was varied (referred to as a “target mask-target mask” task). This RSVP paradigm was selected as a simple approach for assessing rapid temporal processing of the targets without the additional demands of screening the distractors. Stream and target mask–target mask paradigms are considered to assess the same temporal processing functions (Duncan et al., 1994; McLaughlin et al., 2001; Ward et al., 1997).
Method
The experiment was run on a Macintosh Powerbook computer using custom software (Raymond et al., 1992). The first target (T1) was presented for 100 ms, followed by a 100-ms pattern mask. For G.M., the second target (T2) was then presented randomly at 1 of the 10 stimulus onset asynchronies (SOA) that followed T1 (200 to 1100 ms) and was also followed by a 100-ms pattern mask. For controls, only seven SOAs followed T1 (200 to 800 ms), due to the limited time that they were available for testing. The two targets presented on a given trial were randomly selected from sets of eight upper-case letters (Z, B, A, R, G, L, S, P) or eight single digits (0 and 1 excluded). These particular letters were selected to match the visual features of the digits as closely as possible. Items were presented in a simple, block-style font. The letter and digit conditions were alternated in their order of administration (i.e., ABAB design). G.M. completed 20 trials at each of the 10 SOAs in each of the letter and digit blocks (for a total of 400 trials per condition). The controls completed 15 trials at each of the 7 SOAs in each of the letter and digit blocks (for a total of 210 trials per condition). Subjects initiated a trial by pressing a computer mouse button. This press caused a central fixation point to disappear and the sequence of stimuli to be displayed. Subjects were instructed to report the two targets aloud at the end of the trial. After the experimenter entered the responses into the computer, the fixation point returned and subjects could initiate the next trial when ready. The trials in each block were presented in random order. In one control subject, this experiment was discontinued due to illness and her data are excluded from the following analyses.
Results
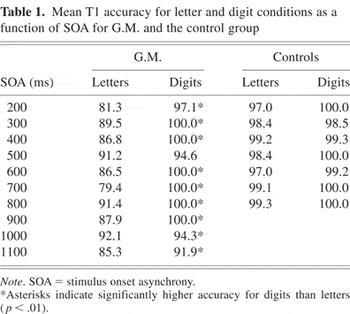
Following typical RSVP procedure, we analyzed both T1 accuracy and T2 accuracy, including only those trials in which T1 was correctly reported (T2IT1) to ensure that subjects were attending to the trial. T1 accuracy for letter and digit conditions as a function of SOA for G.M. and controls is provided in Table 1. Figure 1 displays, for G.M. and controls, T2IT1 accuracy as a function of SOA. T1 and T2IT1 accuracy were each analyzed in a three-way analysis of variance (ANOVA) with SOA (200 to 800 ms) and item type (letters, digits) as within-subject factors and group (G.M., controls) as a between-subject factor. This analysis method allows for a direct comparison between the single-case and control data and calculates the error term from the control group variability (Mycroft et al., 2002).
Mean T1 accuracy for letter and digit conditions as a function of SOA for G.M. and the control group
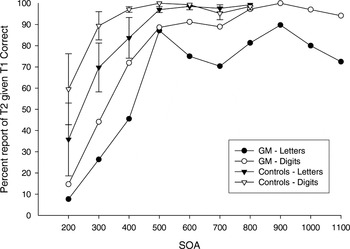
Percentage of rapid serial visual presentation (RSVP) trials in which the second item (T2) was correctly reported, given that the first item (T1) was correctly reported, as a function of increasing stimulus onset asynchrony (SOA) for the letter and digit conditions for G.M. and the control group. Error bars on control group data represent standard errors of the mean.
In the analysis of T1 accuracy, there was an SOA by item type by group interaction [F(6,24) = 3.59; p < .02]. Analysis of the simple interaction effects revealed that the SOA by item type interaction was significant for G.M. [F(6,24) = 4.35; p < .01] but not for the controls (p > .5). Pairwise comparisons of the letter and digit conditions at each SOA in G.M. showed that T1 accuracy was significantly higher for digits than for letters at all SOA conditions (p < .01 for all comparisons) except for the 500-ms SOA (p > .20; see Table 1). In contrast, examination of the control data showed that T1 accuracy for both letters and digits was at ceiling for each individual subject.
In the analysis of T2IT1 accuracy, there was a main effect of SOA [F(6,24) = 10.20; p < .001]. As shown in Figure 1, T2IT1 accuracy increased as SOA increased with performance reaching a maximal asymptote by the 500-ms SOA. This general pattern was evident in both G.M. and the controls, for both the letter and digit conditions. There was a main effect of item type with greater accuracy in the digit condition (81% correct) relative to the letter condition [70% correct; F(1,4) = 21.31; p < .01]. Although the group by item type interaction was nonsignificant (p > .2), visual inspection of Figure 1 shows that accuracy of both the letter and digit conditions in the controls reached a ceiling level by the 500-ms SOA, whereas in G.M., letter accuracy tended to be worse than digit accuracy at most SOA conditions. This letter worse than digit pattern was observed even when G.M.'s letter and digit functions are examined at the 900 to 1100-ms SOA conditions, which were not administered to the controls and therefore not included in the statistical analysis. The group main effect did not obtain statistical significance (p = .10) but, as shown in Figure 1, overall T2IT1 accuracy tended to be greater for controls (87% correct) than for G.M. (64% correct).
Discussion
G.M. had increased difficulty reporting the identity of T1 when it was a letter, as compared with a digit, at almost all SOA conditions. In contrast, his accuracy of identifying T1 digits was at ceiling and equivalent to the controls' accuracy. T2IT1 accuracy was lower overall with letters, compared with digits, for both G.M. and controls. However, this letter–digit difference was evident at all SOA conditions for G.M. but only at conditions less than 500-ms for controls. G.M.'s T2IT1 accuracy for both letters and digits fell below that of the control group.
These results suggest that G.M. had more difficulty identifying letters than digits, as compared with the controls, and that his processing of digits was also impaired to a lesser extent. This conclusion is complicated by the fact that T1 accuracy and the asymptotic T2IT1 accuracy for controls for both item types were at ceiling. Thus, it is possible that the letter–digit difference was not proportionately greater in G.M., but rather was more apparent in his data than in controls because his overall levels of accuracy were lower.
G.M. and controls both had difficulty reporting the identity of T2 when it was presented in close temporal proximity to T1, in both the letter and digit conditions. Their performances then improved progressively as the interval between T1 and T2 increased until the functions reached a maximal level of accuracy by the 500-ms SOA. This transitory processing deficit is referred to as the “attentional blink” (Raymond et al., 1992; Shapiro et al., 1997). The attentional blink duration, that is, the amount of time required after the first target item was encoded before the second target was able to be reliably identified, did not differ between G.M. and controls, and was similar for letters and digits.
The similar attentional blink duration in G.M. and controls in the present target mask–target mask paradigm contrasts with our previous finding that G.M. had a prolonged attentional blink in a stream task (Ingles & Eskes, 2007). This difference suggests that processing a stream of digit distractors and selecting the letter targets among them was particularly challenging for G.M. and may have increased his attentional blink in this task. Indeed, increasing the perceptual similarity of targets and distractors in tests with normal subjects results in a greater attentional blink (Maki et al., 2003). Thus, G.M.'s pattern of results across the two RSVP tasks is consistent with a deficit in the visuoperceptual processing of letters and, to a lesser extent, digits. His attentional blink was likely prolonged in the stream task, but not in the target mask–target mask paradigm, because the perceptual processing demands were greater (i.e., targets needed to be distinguished from distractors).3
Unlike the pattern of results in the previous stream task (Ingles & Eskes, 2007), neither G.M. nor control subjects displayed a phenomenon known as lag-1 sparing in the target mask–target mask task, in which report of T2 is relatively high when it immediately follows T1 (i.e., when it is in the lag-1 position). This finding is consistent with normal studies that have used target mask–target mask paradigms (Duncan et al., 1994; McLaughlin et al., 2001; Ward et al., 1997) and is thought to occur because the lag-1 position in these tasks is always occupied by the mask, whereas in the stream paradigm, T2 can be presented in the lag-1 position.
It is important to recognize that the difference between letters and digits in G.M.'s performance may have been increased due to top-down, set size effects (i.e., 10 digits vs. 26 letters), as opposed to differential degrees of impairment in the underlying perceptual mechanisms for these stimuli. Indeed, letter–digit differences were evident in the controls' T2IT1 accuracy at SOA conditions less than 500-ms. Although we used a restricted letter set to match the number of digits, subjects were not told and, thus, were likely not aware of this manipulation; therefore less perceptual information may have been required for the identification of digits than letters. Although our stimuli were blocked for ease of task comprehension, potential set size effects would have been exacerbated by presenting the letters and digits in blocks, rather than intermixed.
EXPERIMENT 2: SPEEDED MATCHING OF LETTERS AND DIGITS
Experiment 1 suggested that G.M. had increased difficulty with the visuoperceptual processing of letters, relative to digits, although digit perception also appeared impaired, to a lesser degree, relative to controls. The results were complicated, however, by the control group's accuracy reaching ceiling levels, which may have obscured potential differences between their letter and digit conditions, as well as the blocked presentation of the letters and digits, which would have increased the effects of set size.
Experiment 2 compared further the visuoperceptual processing of letters and digits using a physical identity matching task. This task required items to be matched strictly on the basis of their physical characteristics and identification was not required. Response latencies, which may be a more sensitive measure than accuracy, were recorded. To minimize the effects of set size, letters and digits were intermixed. Previous letter-by-letter readers have been found to perform physical identity matching of letters more slowly than normal controls (Behrmann & Shallice, 1995; Hanley & Kay, 1996; Kay & Hanley, 1991; Reuter-Lorenz & Brunn, 1990), although comparisons with digit matching, and with brain-damaged control subjects, have not been made.
Method
The experiment was run on a Macintosh Powerbook computer using Superlab software. In each trial, two horizontally adjacent items appeared simultaneously and remained on the screen until a response was made. Items were either two upper-case letters (from a set of eight) or two digits (from a set of eight) and were the same as in Experiment 1. Items were presented in a simple, block-style font (i.e., bold Geneva 24-point) to minimize visual differences between the letters and digits. Items were combined to form 64 letter pairs and 64 digit pairs. Half of the pairs were “same” pairs and were composed of four pairings of each item within the letter set (e.g., AA) and the digit set (e.g., 22). Half of the pairs were “different” pairs and were composed of all possible pairings of the items within the letter set (e.g., AB) and the digit set (e.g., 24) for a total of 28 pairings per set, plus an additional four pairings in each set that were repeated to make an equivalent number of trials as in the “same” condition. Thus, 128 trials were administered (i.e., 32 “same” matches and 32 “different” matches in each letter and digit set). The items were presented in two blocks with each containing an equal number of letter/digit matches and same/different trials. Items were presented in random order within each block. Subjects indicated whether the items were the same or different, as quickly as possible, by manual key presses. Subjects used the index and middle finger of their right hand to press the “n” key for one response choice and the “m” key for the other response choice on an external keyboard. Accuracy and RT from the onset of each item were measured by the computer.
Results
G.M. and controls made few matching errors (<1% of trials). Figure 2 shows the mean RTs for correct trials for same and different matches in letter and digit conditions for G.M. and controls. The RT data were analyzed in a three-way ANOVA with item type (letters, digits) and match type (same, different) as within-subject factors and group (G.M., controls) as a between-subject factor. There was a significant interaction between item type and group [F(1,5) = 19.29; p < .01], with longer RTs for letters than digits in G.M. but not in controls. The group main effect was marginally significant [F(1,5) = 5.88; p = .06] with longer mean RTs in G.M. (1027 ms) compared with controls (739 ms).
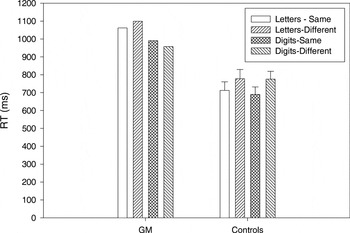
Mean reaction time (RT) for correct trials for same and different matches in letter and digit conditions for G.M. and the control group. Error bars on control group data represent standard errors of the mean.
Discussion
The finding that G.M. took longer to match letters than digits on the basis of their physical characteristics further suggests that he has more difficulty processing letters than digits. Because identification of items was not required, the performance difference between the two stimuli types were more likely due to differences in visuoperceptual encoding rather than in processes related to stimulus recognition or identification. The controls, by contrast, showed no RT difference in their matching of the two item types. It is important to note, though, that G.M. took considerably longer to match both stimuli types relative to controls. Therefore, it is possible that his letter–digit RT difference resulted because his overall RTs were so much slower and not because of a fundamental difference in the way he processed these two stimuli types relative to the controls. That is, a potential difference in the processing of letters and digits may not have been as evident in controls because their overall RTs were faster.
Salthouse and Hedden (2002; see also Chapman et al., 1994) discussed this type of scaling problem as it applies to between-group RT comparisons and described an analysis method using regression-based residuals to minimize the effect of correlations between difference scores and baseline RT values. Thus, we adopted a similar approach for data examination here. First, the letter–digit RT differences for the individual subjects were plotted as a function of overall RT (i.e., RT collapsed across same–different, letter–digit conditions; see Figure 3). A regression line based on the control subjects' data revealed a positive linear relationship between the letter–digit difference scores and overall RT (r = 0.70; p < .06). The value of the residuals (i.e., the difference between the observed letter–digit RT difference and that predicted by the regression equation) were then compared between G.M. and controls using an ANOVA with group (G.M., controls) as the between-subject factor. As seen in Figure 3, G.M.'s residual (54 ms) was significantly greater than those of the controls [F(1,5) = 7.0; p < .05; the largest residual of a control subject was 20 ms]. This analysis therefore indicates that, although the letter–digit RT differences in the controls increased as their overall RTs increased, G.M. was disproportionately slowed on letter matches, over digit matches, even based on that predicted from his overall slower RT.
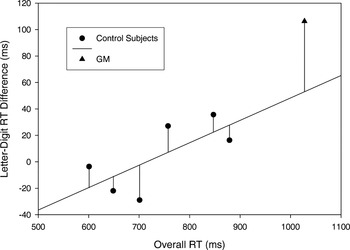
Letter–digit reaction time (RT) differences as a function of overall RT for individual control subjects and G.M. The line of best fit is based on the control subject data. Residual values are represented by lines extending from the individual data points to the line of best fit.
Because letters and digits were intermixed in this task, effects of set size were likely reduced as compared with the RSVP experiment. Although we attempted to control for visual differences between the stimuli by pairwise matching of the letters and digits (e.g., Z–2; L–7), it is still possible that subtle differences in their physical characteristics contributed to the pattern of results. For example, if the “different” letter pairs were more visually similar than the “different” digit pairs, the decision time for letters might be longer than for digits. We addressed this issue by constructing an index of visual similarity for all of the “different” letter and digit pairs.4
To construct a visual similarity index, we enlarged all of the letter and digit stimuli to 550-point font and plotted them on 64 units per square inch grids. The number of common grid units between each of the “different” letter and digit pairs was then calculated. The index ranged from low similarity (i.e., 73 common units for A–L; 114 common units for 4–7) to high similarity (i.e., 514 common units for B–R; 478 common units for 6–8).
Visual similarity did not differ between the letter and digit pairs (i.e., means of 280 vs. 284 common grid units) and did not significantly correlate with the “different” decision RTs for either G.M. (r = .13) or controls (r = .20). These analyses support the notion that G.M.'s inferior performance with letters, relative to digits, was due to impaired visuoperceptual encoding.
GENERAL DISCUSSION
Our study provides the first direct comparison of letter and digit processing in a letter-by-letter reader. Results of both the RSVP and matching tasks suggested that G.M. has a visuoperceptual encoding deficit that particularly affects letters, but also extends to processing of digits to a lesser extent. This deficit could potentially underlie his letter-by-letter reading in that it would make rapid processing of multiple letters in words difficult. As a result, G.M. might compensate by focusing his resources serially on the individual constituent letters.
G.M.'s pattern of results provides direct support for Farah's (1999) theory of letter-by-letter reading in which the disorder results from a general visual impairment that may affect multiple types of stimuli, but that is most severe for orthography. Polk and Farah (1995, 1998) proposed that the normal brain acquires, through Hebbian learning mechanisms, an area specialized for processing letters. However, because this area develops out of a general visuoperceptual region, it is also able to process digits, although less efficiently than letters. Indeed, in functional neuroimaging studies (James et al., 2005; Polk et al., 2002), an area in the left fusiform gyrus responded more to letters than digits, but it also tended to respond to digits to a lesser degree. This area was near the so-called “visual word-form area” that has been found to be activated more by words and pseudowords than consonant strings (Cohen et al., 2000). The proximity of these areas is consistent with a hierarchical occipitotemporal network underlying visual word recognition (Pugh et al., 2001). The evidence for a specialized digit area is less clear, but a homologous area in the right hemisphere seemed to respond to digits, but not letters (Polk et al., 2002). This finding is in keeping with the right-hemisphere advantage for digits over letters in disconnection syndromes (Teng & Sperry, 1973). Although we lack detailed neuroimaging data for G.M., his large left occipitotemporal lesion may well have encompassed this specialized letter area, causing especially poor performance with letters and milder reductions with digits. Some visual processing of digits may still have been performed by his intact right hemisphere, accounting for his relatively better performance with these stimuli.
According to Farah's (1999) theory, letter-by-letter readers can show varying degrees of orthographic versus general visuoperceptual deficits depending on the extent of damage beyond the specialized letter area; however, a letter deficit should always be accompanied by a nonorthographic deficit, even if it is very subtle. Further testing of the basic visual processes that may underlie G.M.'s letter and digit perception (e.g., contrast sensitivity, shape discrimination) would be helpful in this regard. It is also essential to study other cases to examine the range of letter and digit processing deficits that can accompany letter-by-letter reading. Assessment of “pure” letter-by-letter readers will be particularly important, because G.M. also had symptoms of surface dyslexia that may have affected the results. Although surface dyslexia is usually associated with higher-level orthographic or semantic deficits, such deficits might reduce top–down processing effects that normally facilitate letter perception.
Even though we attempted to control for effects of set size and visual complexity, these factors may still have contributed to the letter–digit performance differences in G.M. Using a letter set composed of the first eight letters of the alphabet and making participants aware of this restricted set might help to minimize the effects of set size in future experiments, although this would interfere with the visual matching of letters and digits. Visual complexity might be controlled in further RSVP experiments by presenting items that are physically identical but that can belong to either a letter or digit set depending on task instructions (e.g., O referred to as “oh” or “zero”). The attentional blink is attenuated in normals when two targets (Taylor & Hamm, 1997) or targets and distractors (Dux & Coltheart, 2005) are perceived as members of different categories. Examining the extent of this “different category attenuation” with the letter versus digit instructional set might be interesting to examine in letter-by-letter readers. As well, it will be important in future work to control for the frequency of use of letters and digits as this may affect the identification process.5
We are not aware of data that compare the written frequency of single letters and digits, although the written and spoken frequency of letters (e.g., Baddeley et al., 1960) and spoken frequency of digits (Dehaene & Mehler, 1992) have been examined previously.
In most previous investigations of letter-by-letter reading, only a few normal individuals have been tested as controls (but see Ingles & Eskes, 2007; Kinsbourne & Warrington, 1962). Unfortunately then, the deficits cannot be assumed to be uniquely associated with the disorder as they could simply reflect general effects of brain damage (e.g., slowed RTs). Given our comparison to a brain-damaged control group, we can more confidently assume that G.M.'s letter processing deficit is uniquely associated with his dyslexia. In addition, we demonstrated a simple method of determining whether the difference between two experimental conditions is meaningful when the baseline RT values differ between a single-case and control group (i.e., our use of regression-based residuals in Experiment 2). Replications of our findings in other letter-by-letter readers, especially in studies that combine behavioral and neuroimaging protocols, are clearly important for understanding the nature of the impairments that may underlie this disorder.
ACKNOWLEDGMENTS
These data were collected while the first author was supported by a Studentship Award from the Medical Research Council of Canada, an Izaak Walton Killam Memorial Scholarship from Dalhousie University, and a grant from the Dalhousie Research Development Fund. We thank Drs. Norman Park and Guy Proulx for the introduction to G.M. and for the use of facilities at the Baycrest Centre for Geriatric Care, and Drs. Stephen Phillips and Richard Braha for the referral of control patients. We thank Dr. Kimron Shapiro for providing the RSVP software. We thank Drs. Ray Klein and Patricia McMullen for reviewing the first author's Ph.D. dissertation, from which this manuscript was derived. We thank Dr. Karalyn Patterson and two anonymous reviewers for helpful comments on a previous version of this manuscript. We are very grateful to G.M. and the six other participants for their time and involvement in this study. The information in this manuscript and the manuscript itself are new and original and have never been published either electronically or in print. There are no financial or other relationships that could be interpreted as a conflict of interest affecting this manuscript.


