Introduction
Effective management of invasive plant species requires an understanding of ecological and biological potential and how these change under varying levels of mitigation and management efforts (Carlton Reference Carlton2003; Finnoff et al. Reference Finnoff, Shogren, Leung and Lodge2005; Keller et al. Reference Keller, Lodge, Lewis and Shogren2009). With the objective of population reduction and/or eradication, the problem becomes one of minimizing management costs given current and potential spread of the species. Despite the increased practice of invasive plant management across landscapes around the world, little is known regarding the expected costs, returns, and outcomes of control operations (Kerr et al. Reference Kerr, Baxter, Salguero-Gómez, Wardle and Buckley2016; van Wilgen et al. Reference van Wilgen, Fill, Baard, Cheney, Forsyth and Kraaij2016; Wagner et al. Reference Wagner, Antunes, Irvine and Nelson2017).
Advances in theoretical invasive species management include conditions for eradication (Olson and Roy Reference Olson and Roy2002); policy options under uncertainty (Horan et al. Reference Horan, Perrings, Lupi and Bulte2002); and integrated detection, prevention, and control (Burnett et al. Reference Burnett, D’Evelyn, Kaiser, Nantamanasikarn and Roumasset2008, Reference Burnett, Pongkijvorasin and Roumasset2012; Leung et al. Reference Leung, Lodge, Finnoff, Shogren, Lewis and Lamberti2002; Mehta et al. Reference Mehta, Haight, Homans, Polasky and Venette2007). There are a limited number of case studies from around the world estimating total economic implications, including management costs and damages (Pimentel Reference Pimentel2011; Pimentel et al. Reference Pimentel, Zuniga and Morrison2005), and bioeconomic analyses have been developed to predict economic implications with more limited data (Cook et al. Reference Cook, Thomas, Cunningham, Anderson and De Barro2007; Eiswerth and Van Kooten Reference Eiswerth and Van Kooten2002; Frid et al. Reference Frid, Knowler, Myers, Scott and Murray2013), including a stage matrix simulation model applied to the eradication of a miconia (Miconia calvescens DC) infestation in Queensland, Australia (Hester et al. Reference Hester, Brooks, Cacho and Panetta2010). In similar fashion, we will explore some of the critical life-history traits of M. calvescens by using management data in the East Maui Watershed (EMW) from 1991 to 2016 and develop bioeconomic comparisons of management options.
Miconia calvescens is a midstory canopy species native to South and Central America, classified among the “100 of the world’s worst invasive alien species” by the IUCN (Lowe et al. Reference Lowe, Browne, Boudjelas and De Poorter2000). It is a forest ecosystem modifier in many tropical regions of the Pacific Rim (Medeiros et al. Reference Medeiros, Loope, Conant and McElvaney1997; Meyer and Florence Reference Meyer and Florence1996; Nanko et al. Reference Nanko, Giambelluca, Sutherland, Mudd, Nullet and Ziegler2015). Miconia calvescens is shade tolerant and able to displace native plant communities, transforming diverse forests into dense monospecific canopies, which can impoverish understory vegetation and expose the soil surface below the canopy (Meyer and Florence Reference Meyer and Florence1996). Miconia calvescens has large, elliptical leaves (i.e., up to 2,400 cm2; Meyer Reference Meyer1998) that create coalesced water drops with high-impact throughfall, accelerating localized soil erosion (Giambelluca et al. Reference Giambelluca, Sutherland, Nanko, Mudd and Ziegler2009; Nanko et al. Reference Nanko, Watanabe, Hotta and Suzuki2013, Reference Nanko, Giambelluca, Sutherland, Mudd, Nullet and Ziegler2015). This species has been observed with a disproportionately large canopy supported by a shallow root system, which, along with its propensity to colonize steep slopes, may increase landslides, as observed in Tahiti (Gagné et al. Reference Gagné, Loope, Medeiros and Anderson1992).
Miconia calvescens is a major threat to the EMW, an ~50,000-ha forested landscape on the windward slope of Haleakala Volcano extending from coastline to crater, with an elevation gradient from sea level to 3,055 m above sea level (m a.s.l.). The EMW provides critical habitat to more than 100 threatened and endangered species and annually recharges more than 1.135 trillion liters of fresh groundwater (Shade Reference Shade1999) that represent vital ecosystem services for life and agriculture on Maui. This area is climatically diverse, with wide mean annual temperature gradients (midday 9 to 26 C) and precipitation (652 to 10,271 mm). Much of the landscape is inaccessible to ground operations, with 72 separate drainage basins, all having slopes>30°, relegating much of the current M. calvescens management strategy to aerial operations, the focus of this paper.
Miconia calvescens was introduced to Hana, Maui, as an ornamental specimen (i.e., founder population) in the early 1970s and not identified as a major invader of the EMW until two decades later, when active management commenced (see Medeiros et al. Reference Medeiros, Loope, Conant and McElvaney1997). The first volunteer effort, in 1991, removed 9,320 M. calvescens plants around the original point of introduction (Gagné et al. Reference Gagné, Loope, Medeiros and Anderson1992). With plant maturity achieved in as little as 4 yr (Meyer and Malet Reference Meyer and Malet1997), we assume that several generations were reproduced within that 20-yr period leading up to the first harvest. In 2001, the National Park Service mobilized their Pacific Islands Exotic Plant Management Team in collaboration with the Maui Invasive Species Committee to accelerate a more comprehensive eradication strategy to reduce the core infestation and intercept satellite plants (Figure 1). Both ground and aerial operations ensued. The program was able to maintain strong efforts until 2012, resulting in more than 1 million plants eliminated (Figure 1B). In 2012, herbicide ballistic technology (HBT) was introduced to eliminate satellite M. calvescens more efficiently, with long-range precision and accuracy (Leary et al. Reference Leary, Mahnken, Cox, Radford, Yanagida, Penniman, Duffy and Gooding2014). Adoption of HBT coincided with strategic support falling below thresholds to achieve comprehensive eradication, effectively transitioning to containment with HBT helicopter operations targeting the most remote populations. From 2012 to 2016, more than 116 missions (with 377 h of operational flight time) have resulted in the elimination of more than 21,000 M. calvescens occupying more than 30% of the EMW. As a result of this shift to containment, fruiting trees in the core infestation area (~2,000 ha) surrounding the point of introduction are coalescing into monotypic stands “saturating” the landscape. Strategic support continues to decline, pushing the notion that effective containment of such a large area cannot be sustained either.
(A) Comprehensive eradication (1991–2016; n=1,516,727; gray) and containment via herbicide ballistic technology (2012–2016; n=21,072; red). (B) The number of eliminated Miconia calvescens recorded each year. (C) The frequency distribution of range distances from the founder population. Note the location of the founder population and first volunteer removal effort (yellow diamond in A). Note contour line intervals at ~150 m a.s.l. (i.e., 500 feet a.s.l.).

Cacho et al. (Reference Cacho, Wise, Hester and Sinden2008) presented a decision model determining when it is optimal to switch from eradication to containment and, further, when it is optimal to terminate management. As stated earlier, eradication and comprehensive containment of M. calvescens in the EMW may no longer be viable strategies. However, conservation of this small, but highly productive ecosystem is a high priority for local stakeholders, particularly the mitigation of invasive plant species (Loope and Mederios 1994; Mederios et al. 1995). Thus, we seek to examine a management alternative to full program termination with a focus on protecting priority ecosystem assets via local eradication of M. calvescens satellites and incipient populations. Beyond evaluating the services provided, we must understand the cost to locally manage these remote, satellite invaders and further determine what level of protection is secured by excluding M. calvescens from a priority asset area. It is important to measure this spatially and temporally. To answer these questions, we deploy methods to estimate critical life-history traits for propagule dispersal and persistence exhibited in the EMW, using a 25-yr management data set identifying the location and time of each M. calvescens individual eliminated. From there we simulate the development of an incipient population started by a single new, mature M. calvescens and estimate the sustained level of management needed to locally eradicate this incipient population. Finally, we evaluate cost-effectiveness of eliminating juvenile M. calvescens before they reach maturity with a return equivalent to avoid the future management costs incurred eliminating their progeny. (Box 1)
Management Implications
Historical management data, containing spatial and temporal attributes of where and when target invaders were eliminated, can be used to profile life-history traits of an invasive plant species. Here, we describe the dispersal range and persistence (i.e., kernels) of propagules derived from a 25-yr record of management in a strategy that is ongoing and transitioning. The basic feature critical to deciphering these patterns is the distinction of targets as mature or juvenile, which establishes distance and time associations of juvenile recruitment from the maternal source. Here, optimal efforts to eliminate all juvenile recruits before reaching maturity presents the best outcome to protect local area assets. Moreover, excess effort to prevent maturity is likely to be more practical and economical than suboptimal efforts allowing a mature Miconia calvescens to expand the range and extend persistence of the invasion. In spite of the unique qualities of this management scenario, the approach to consistently record data for every target plant treated (e.g., GPS) is universally translatable to most field-level operations. Beyond historical perspective, new intelligence can be effective in projecting future tactical decisions. Administrative interpretation of future cost avoidance (i.e., resulting from juveniles reaching maturity) could further facilitate a prioritization process for assigning limited resources that offer the best returns in asset protection or informing new strategy to establish resource thresholds in order to succeed in more comprehensive containment and eradication.
Materials and Methods
Estimating Miconia calvescens Life-History Traits
Miconia calvescens is a highly fecund, autogamous (self-fertile) species. Trees reach maturity in 4 yr (or longer; see Murphy et al. Reference Murphy, Hardesty, Fletcher, Metcalfe, Westcott and Brooks2008) and usually only produce two panicles in the first year of reproduction (Meyer Reference Meyer1998; Murphy et al. Reference Murphy, Hardesty, Fletcher, Metcalfe, Westcott and Brooks2008). In Tahiti, Meyer (Reference Meyer1998) reports an average of 210 fruits infructescence−1 and 195 seeds fruit−1. Thus, a single M. calvescens has the potential to produce more than 80,000 seed propagules when it first reaches maturity and further produces millions of seed in more advanced stages of maturity. Meyer (Reference Meyer1998) determined three flowering periods per year, but a single plant is typically observed to flower once annually (Hardesty et al. Reference Hardesty, Metcalfe and Westcott2011; Hester et al. Reference Hester, Brooks, Cacho and Panetta2010). Ellison et al. (Reference Ellison, Denslow and Loiselle1993) measured up to 0.4% progeny survivorship for other species of Melastomataceae, possibly due to cohort competition, pathogenesis, or herbivory. In this study, we assume this “penalty” on a first mature M. calvescens, such that it only produces 320 surviving progeny capable of succeeding to maturity. Given that adult M. calvescens become sympodial (Meyer and Malet Reference Meyer and Malet1997), we assume for this study a successive doubling in fecundity every year after maturity.
We have an almost complete 26-yr history of M. calvescens management in the EMW with time-stamped, georeferenced locations of targets eliminated by ground and aerial operations from 1991 to 2016 (n=114,953 representing 1,516,727 M. calvescens individuals), including mature targets (n=9,153), and aerial operations deploying HBT from 2012 to 2016 (n=21,072). A dispersal kernel is a two-dimensional probability density function (PDF) describing the distribution of progeny relative to the maternal source (Klein et al. 2013). Here, we use these spatiotemporal data to develop PDFs (i.e., kernels) for both range distances and time intervals based on the nearest maternal source. The Near Analysis tool (ArcGIS v. 10.2.2, Esri, Redlands, CA) was used to create a table matching all M. calvescens target points to the nearest 50 mature target points with corresponding distance and time attributes (i.e., with ~6 million matches). This overabundant, point-match database was then queried with Access (Microsoft, Redmond, WA) to select the match with the closest mature point that was at least 1 yr older. This minimum 1-yr time separation was assumed to be when juvenile recruits may reach detectable size. Here, we interpret the distance as dispersal range and the time interval as recruitment. The PDFs were displayed from 10 m and yearly bins for distances and time intervals, respectively, creating dispersal and persistence kernels.
A Simple Stage Matrix Model for Miconia calvescens
A stage matrix model projects populations over time. A simplified three-stage matrix model was developed based on methods used by Buhle et al. (2005), Hester et al. (Reference Hester, Brooks, Cacho and Panetta2010), and Cacho et al. (Reference Cacho, Hester and Spring2007), citing Caswell (2001). Here, we describe an incipient invasion starting with an initial cohort of propagules (x i=320) succeeding to juveniles, then matures, managed annually as a harvest rate proportional to the number of recruits:
 $$L{\equals}\left[ {\matrix{ 0 & 0 & f \cr {p_{{pr}} } & {p_{{pr,jv}} } & 0 \cr 0 & {p_{{jv,mt}} } & {p_{{mt}} } \cr } } \right]\,;\ \,{\rm }x_{i} {\equals}{\rm }\left[ {\matrix{ {320} \cr 0 \cr 0 \cr } } \right]$$
The propagule bank (pr) at time (t) is determined by a first-order exponential decay (i.e., recruitment) of the preexisting bank at t−1 and augmented by the fecundity (f) of future mature cohorts (mt) at t; arbitrarily limiting fecundity to a census≥0.5:
 $$pr_{t} {\equals}pr_{{\left( {t{\minus}1} \right)}} e^{{{\minus}r}} {\plus}\mathop{{\lim }}\limits_{{mt\to0.5}} mt_{t} f_{t} $$
where juveniles (jv t ) are a composite of new juvenile recruits of pr (t − 1) and the surviving (i.e., undetected) residents (jv (t−1)) remaining after harvest (h):
 $$jv_{t} {\equals}(pr_{{\left( {t{\minus}1} \right)}} \left( {1{\minus}e^{{{\minus}r}} } \right){\plus}jv_{{\left( {t{\minus}1} \right)}} )(1{\minus}h)$$
Here, we assume maturity is achieved on the fourth year for juveniles remaining after three successive harvests; arbitrarily limiting the transition of fourth-year juveniles to maturity at a census≥0.5:
 $$mt_{t} {\equals}\mathop{{{\rm lim}}}\limits_{{jv\to0.5}} \mathop \sum\limits_{i{\equals}3}^n {\rm }jv_{{\left( {t{\minus}i} \right)}} (1{\minus}h)^{i} $$
Fecundity doubles each year after first maturity (x i=320):
 $$f_{t} {\equals}\mathop \sum\limits_{i{\equals}1}^n mt_{t} {\times}320e^{{0.6931(t{\plus}i)}} $$
The asymptotic growth rate (λ), also referred to as the dominant eigenvalue of the matrix model, is the ratio of total populations between successive annual time steps:
 $${\rm \lambda }_{t} {\equals}{{x_{t} } \over {x_{{(t{\minus}1)}} }}$$
This metric is a simple determination of population growth (λ>1), containment (λ=1), or suppression (λ<1).
Individual-based Models Developed to Inform Miconia calvescens Management
While the stage matrix model measured population dynamics over time, an individual-based model was developed to track the management efforts over space required to eliminate all colonizing progeny of a single satellite M. calvescens reaching maturity. Spatially, point density raster annuli were created from M. calvescens point locations by decimally binned radial (i.e., near) distances calculated from the dispersal PDF described earlier (Figure 2A). Hence, each annular ring contained 32 progeny (e.g., 1% of the total). The probability of detection (p d) of a M. calvescens target was based on a random search effort described previously by Cacho et al. (Reference Cacho, Hester and Spring2007) and later adopted by Leary et al. (Reference Leary, Mahnken, Cox, Radford, Yanagida, Penniman, Duffy and Gooding2014) and the probability of no detection (p nd) of M. calvescens as the inverse of p d (see Supplementary Figure S1):
 $$p_{{\rm d}} {\equals}1{\minus}e^{{{\minus}c}} \,;\,p_{{{\rm nd}}} {\equals}e^{{{\minus}c}} $$
where p d is an imperfect process asymptotically approaching unity with increasing coverage (c), and p nd approaches zero with increasing c (see Supplementary Figure S1). The resulting probabilities of presence/absence qualify our confidence in search effort. Coverage was based on surveillance operations from a helicopter with a three-person crew at speeds<8 m s−1 with flight lines parallel to contour and normal to terrain aspect with a mean sight range of 16 m (Rodriguez et al. Reference Rodriguez, Jenkins, Leary and Mahnken2016) creating an oblique view for the observers with a central macular field of view of ~100 m2, which is approximate to the pixel dimensions of most GIS rasters (i.e., 10 m pixel). In this model, we estimate coverage to equal a search encounter of 1 s pixel−1. Thus, spatially complete search coverage is the combination of encounters finding all of the targets, complemented by added search to confirm no targets in the previously occupied and unoccupied areas.
 $${\rm c}_{{{\rm pixel}}} {\equals}{\minus}((\ln (1{\minus}p_{{\rm d}} ){\times}\rho _{{target}} ){\plus}{\rm }\ln p_{{{\rm nd}}} )$$
(A) Dispersal and (B) propagule bank persistence (recruitment) kernels displayed from histograms of progeny distances and time intervals, respectively, from the nearest mature predecessor (n=114,953). Each distribution is described with a first-order negative exponential function (black lines; R2=0.982 and 0.997, respectively) with 95% confidence intervals (red-dashed line).

where coverage of a pixel area (c pixel) is dependent on target density (ρtarget), and spatially all pixel areas are obligated to some level of coverage. Optimal coverage is proportional to known recruitment rates over time. Methods to treat M. calvescens are highly reliable and effective (e.g., >98%), thus, making M. calvescens elimination practically dependent on detection achieved by search effort (Leary et al. Reference Leary, Mahnken, Cox, Radford, Yanagida, Penniman, Duffy and Gooding2014).
Variable Costs of HBT Operations for Miconia calvescens Management
As described earlier, the basic tactics are to search, detect, and eliminate M. calvescens from a helicopter platform. Previous studies have determined that operations are target-density dependent with strong linear fits for search effort (i.e., flight time) and herbicide use rate (Leary et al. Reference Leary, Mahnken, Cox, Radford, Yanagida, Penniman, Duffy and Gooding2014). Utility helicopter services on Maui have been contracted at US$1,200 h−1, which translates to US$0.33 s−1 pixel−1. The mean dose per target is 23.3 projectiles, with a projectile price point of US$0.31 for an individual treatment cost of US$7.22. We have estimated flight time to engage target at 39.6 s for an added cost of US$13.07, bringing the total cost of eliminating one M. calvescens plant to US$20.29 (unpublished data).
Prioritizing Protection of EMW Assets
To consider a strategic transition from containment to asset protection in the EMW, we established the upper catchment basins above 400 m a.s.l. as a first-priority asset, which was based on the contour where the irrigation diversion system is installed and also where endemic plant communities are higher density (Gingerich Reference Gingerich2005; Shade Reference Shade1999). The upper boundary of this 20,863-ha area was delineated at 1,220 m a.s.l., which is surmised to be the approximate threshold for M. calvescens habitat suitability (Pouteau et al. Reference Pouteau, Meyer and Stoll2011). The second- (3,379 ha) and third-priority (5,554 ha) containment areas were extended below the 400 m a.s.l. contour, based on the ranges for 0.99 and 1.0 percentiles of the dispersal kernel, described earlier, where proportionally up to 50% and<1% of dispersed progeny could colonize the upper catchment asset area, respectively. All HBT operations data (i.e., operational flight time and treated M. calvescens targets from 2012 to 2016) were retroactively superimposed to these buffer areas and assigned a treatment cost, described earlier. We assumed impact of a newly invaded area to be created by a single, juvenile M. calvescens succeeding to first maturity, with the life-history traits spatially and temporally applied. The impact area was calculated as a composite of annular density rasters radially determined by decimal proportions of the dispersal PDF. For instance, a first-mature M. calvescens producing 320 progeny will disperse 3.2 of those in each of the 100 annular rings of varying areas. When a M. calvescens plant is eliminated before maturity, it is assumed that future costs are avoided to extinguish a newly established propagule bank.
Software and Descriptive Statistics
GPS data were compiled and analyzed using ArcGIS (v. 10.2.2, Esri) and Access and Excel (Microsoft). The XLSTAT add-in (v. 19.5, Addinsoft, New York, NY) was used for nonlinear regression analyses of the best-fit first-order negative exponential functions for dispersal and persistence kernels.
Results and Discussion
Shigesada et al. (Reference Shigesada, Kawasaki and Takeda1995) describe three stages of an invasion: incipient establishment, range expansion, and habitat saturation. The hypothetical invasion curve (depicted in Figure 3; adopted from Chippendale Reference Chippendale1991; Hobbs and Humphries Reference Hobbs and Humphries1995) intuitively uses the logistic growth function for determining strategic goals to eradicate a population, contain an invasion, and protect assets, dependent on the level of succession. All of these strategic phases will deploy tactical countermeasures to pace recruitment, limit dispersal, and preempt fecundity (Cacho et al. Reference Cacho, Hester and Spring2007; Hauser and McCarthy Reference Hauser and McCarthy2009; Hauser et al. Reference Hauser, Giljohann, Rigby, Herbert, Curran, Pascoe and Moore2016; Hester et al. Reference Hester, Brooks, Cacho and Panetta2010; Leung et al. Reference Leung, Cacho and Spring2010; Mehta et al. Reference Mehta, Haight, Homans, Polasky and Venette2007). What is inherent to this process is the knowledge of life-history traits of the target species (propagule dispersal, persistence, mature fecundity, etc.).
The hypothetical invasion curve depicted by a logistic growth function to determine effective management countermeasures.

Spatial ecology of seed dispersal is critical to understanding community dynamics, succession, and especially nonnative invasions (Clark et al. Reference Clark, Silman, Kern, Macklin and HilleRisLambers1999; Murphy et al. Reference Murphy, Hardesty, Fletcher, Metcalfe, Westcott and Brooks2008; Nathan and Muller-Landau Reference Nathan and Muller-Landau2000; Shigesada et al. Reference Shigesada, Kawasaki and Takeda1995). The M. calvescens dispersal kernel created in the EMW (Figure 2A) was a leptokurtic distribution described by a first-order negative exponential function (R2=0.946), characterized by a sharp central peak and fat-tail of rare, long-distance events (Clark et al. Reference Clark, Silman, Kern, Macklin and HilleRisLambers1999; Nathan and Muller-Landau Reference Nathan and Muller-Landau2000). Ninety-nine percent of the recruitment observed was confined to 549 m, with the remaining 1% of recruitment events measured out to 1,636 m. Half of the recruitment was confined to 37.3 m of the presumed maternal sources (i.e., sharp central peak), denoting the possibility of unconsumed fruit drop with short-range dispersal aided by features of the landscape (e.g. slope, gravity, and hydrology; Murphy et al. Reference Murphy, Hardesty, Fletcher, Metcalfe, Westcott and Brooks2008). Otherwise, we expect most dispersal to be facilitated by endozoochory of avian generalists consuming these small, fleshy fruits (ca. 6 mm) packed with even smaller seed (ca. 0.6 mm), where range distance is determined by gut retention or home range (Dennis and Westcott Reference Dennis and Westcott2007; Meyer Reference Meyer1998; Murphy et al. Reference Murphy, Hardesty, Fletcher, Metcalfe, Westcott and Brooks2008; Spotswood et al. Reference Spotswood, Meyer and Bartolome2012, Reference Spotswood, Meyer and Bartolome2013). There were 81 points with range distances extending beyond 2,000 m with a maximum distance of 7,738 m (unpublished data). Many of these were validated as stochastic, human-mediated events, but it does suggest that dispersal could extend beyond the maximum range distance used here. The dispersal kernel developed by Murphy et al. (Reference Murphy, Hardesty, Fletcher, Metcalfe, Westcott and Brooks2008) estimated a maximum dispersal range of 1,750 m in North Queensland, Australia. The EMW dispersal kernel matched with this kernel (root mean-square error [RMSE]=0.007), where the largest residuals were at the central peak (unpublished data). The isotropic impact area in the EMW created by the maximum dispersal distance (i.e., 841 ha) is a conservative estimate. However, this homogenous display is independent of the landscape, where habitat, topography, and avifaunal behaviors may all contribute to actual distribution patterns (Murphy et al. Reference Murphy, Hardesty, Fletcher, Metcalfe, Westcott and Brooks2008; Spotswood et al. Reference Spotswood, Meyer and Bartolome2013). In management decision making, this translates into substantial unknown risk and still obligates surveillance to the entire buffer, particularly in the fat-tail regions where autogamous M. calvescens present the greatest risk of expansion into uninvaded areas (Hardesty et al. Reference Hardesty, Metcalfe and Westcott2011; Murphy et al. Reference Murphy, Hardesty, Fletcher, Metcalfe, Westcott and Brooks2008). Autogamy is a facultative trait for satellite pioneers to achieve reproductive success when isolated from cohorts (Baker Reference Baker1965; Meyer Reference Meyer1998). Thus, it is justifiable to assume all propagules may establish and succeed to maturity within the kernel, autonomous of cohorts.
Physiological seed dormancy has been reported in several Miconia spp., including M. calvescens (Dalling et al. Reference Dalling, Swaine and Garwood1998; Ellison et al. Reference Ellison, Denslow and Loiselle1993; Mendes-Rodrigues et al. Reference Mendes-Rodrigues, Araújo, Barbosa-Souza, Barbosa-Souza, Ranal, Santana and Oliveir2010; Meyer Reference Meyer1994; Pearson et al. 2003; Silveira et al. Reference Silveira, Ribeiro, Soares, Rocha and Oliveira2013; Valio and Scarpa Reference Valio and Scarpa2001). This has been translated to higher shade tolerance under forest canopy (i.e., lower red:far-red ratios), offering competitive advantages over other larger-seeded tropical species with longer seedbank persistence and higher germination rates under lower light conditions (Martínez-Ghersa and Ghersa Reference Martínez-Ghersa and Ghersa2006; Meyer Reference Meyer1994; Pearson et al. 2003). Seedbank persistence in the EMW was described by a first-order negative exponential function (R2=0.997) with a 24% annual reduction, exhausting 99% of the propagule bank in ~17 yr (Figure 2B). This was highly congruent (RMSE=0.0031) to the decay function of a seedbank study by Meyer and Malet (Reference Meyer and Malet1997) and Meyer (Reference Meyer2010). They showed propagules surviving after 16 yr, but decaying from>4,300 seeds m−2 to 190 seeds m−2, in that time period. Interestingly, Dalling et al. (Reference Dalling, Swaine and Garwood1998) showed seedbank of native Miconia argentea (Sw.) DC. in Panama to have higher annual reductions at 70% to>90% within 30 m from the nearest tree, attributing seed mortality to pathogenic fungi. The suitable habitats in Hawaii and Tahiti may be conferring added advantages to M. calvescens with a lack of herbivory, disease, and competition typically experienced in its native range (i.e., enemy release hypothesis; Keane and Crawley Reference Keane and Crawley2002). This measure of seedbank persistence does not explicitly account for stochastic events (e.g., microsite disturbances) that may shorten persistence, nor is the model’s termination point irrefutable. For instance, it is plausible that a 30-yr data set would show recruitment beyond 20 yr. In spite of these limitations, this model still offers sound management guidance in projecting long-term strategy toward achieving extinction.
Life-history traits vary widely across species and also within a species across heterogenous landscapes (Bedetti et al. Reference Bedetti, Aguiar, Jannuzzi, Moura and Silveira2011; LeRoux et al. Reference Le Roux, Wieczorek and Meyer2008; Nathan and Muller-Landau Reference Nathan and Muller-Landau2000). Founder populations of M. calvescens in the Pacific and Australia are the result of minor, deliberate introductions displaying low genetic diversity and a lack of geographical structure, suggesting these naturalized invasions are closely related and possibly derive from the same maternal source (Hardesty et al. Reference Hardesty, Metcalfe and Westcott2011; Le Roux et al. Reference Le Roux, Wieczorek and Meyer2008). Apparently, this has not been an impediment to invasion success of M. calvescens in these different locations. Phenotypic plasticity is an important mechanism for apomictic populations with low genetic variability, such as Miconia spp. (Bedetti et al. Reference Bedetti, Aguiar, Jannuzzi, Moura and Silveira2011). The congruence of dispersal kernels in these disparate locations may be further supported by the small fruit phenotype and the similar generalist frugivory networks, that is, the red-vented bulbul (Pycnonotus cafer L.) in Tahiti and Hawaii or white eyes (Zosterops spp.) common in Hawaii, Tahiti, and Australia (Csurhes Reference Csurhes1998; Spotswood et al. Reference Spotswood, Meyer and Bartolome2012). Heterogenous environmental effects were determined to be stronger than genetic disposition in determining seedbank persistence of M. ferruginata DC. in Brazil (Mendes-Rodrigues et al. Reference Mendes-Rodrigues, Araújo, Barbosa-Souza, Barbosa-Souza, Ranal, Santana and Oliveir2010). In this case, life-history traits expressed in the EMW are likely determined by the constitution of both species and habitat. The similarities of the corresponding research in Tahiti and Australia are invaluable to our confidence in research and management of M. calvescens in Hawaii.
A single M. calvescens satellite colonizing a new location can rapidly create large-scale and long-term impact on a landscape if succeeding to maturity. Eliminating satellite targets before they reach maturity (referred to as “juvenilizing” by Meyer et al. [Reference Meyer, Loope and Goarant2011]) is an effective form of landscape-level management. Figure 4A and B shows the population dynamics simulated in a stage matrix model of a new M. calvescens propagule bank managed at different harvest rates over time. Here, containment is simulated when harvest rates are equally replenished by mature fecundity (λ=1). This model was closest to containment at a harvest rate of 0.696 (λ=0.997), with one juvenile reaching maturity and replenishing the propagule bank every 4 yr. This model repeats these oscillating fecundity events for centuries beyond the scale of these figures (unpublished data). Slight shifts (±) in harvest rates from containment (0.695 and 0.697) depict the dramatic (sensitive) fluctuation between failure and eradication, albeit suboptimal. Failure (λ=1.38), in this case, shows juvenile recruitment and maturity quickly outpacing harvest rates. Suboptimal eradication was closely coherent to containment for more than five decades (λ=0.995) and then began exhausting the propagule bank (λ=0.76) until extinction at the 80th year. This resulted in 2,577 juvenile added recruits being harvested over that period, in excess of the initial propagule bank (x i=320). Optimal eradication was achieved at the lowest harvest rate (0.717), with all 320 juvenile recruits eliminated before reaching maturity (λ=0.76) and extinction occurring at the 24th year. All harvest rates in excess of optimal have the same outcomes (e.g., 0.999; Figure 4A and B), with only diminishing residency of juveniles. It should be noted that presumed containment in this model is only temporal, while maturity occurring randomly within the dispersal kernel would result in range expansion nullifying spatial containment (Cacho et al. Reference Cacho, Wise, Hester and Sinden2008; Moody and Mack 1988; Panetta Reference Panetta2007; Shigesada et al. Reference Shigesada, Kawasaki and Takeda1995). Optimal and excess harvest rates have the shortest time to extinction and mitigate range expansion.
(A) Progeny recruitment derived from a single satellite Miconia calvescens created by the stage matrix model depicting population dynamics over time where harvest rates proportional to recruitment fail (black arrow; 0.695), contain (red arrow; 0.696), suboptimally eradicate (gray point; 0.697), optimally eradicate (red point; 0.717), and excessively eradicate (blue point; 0.999). (B) Growth rates (λ) over time leading to stable stage distribution, where λ ≈ 1.0 is effectively contained at the harvest rate 0.696 (red arrow), while λ>1 shows positive growth beyond containment (black arrow) and λ<1 leads to extinction (gray, red, and blue points), where 0.717 is the optimal harvest rate for achieving extinction without any progeny reaching maturity. Note: arrows depict continuation beyond the scale of the graph.

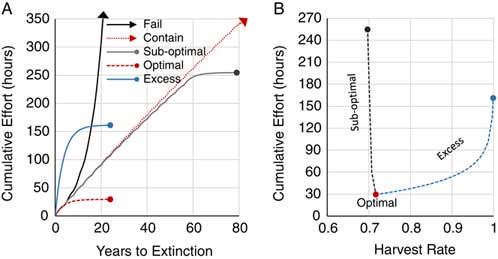
Cacho et al. (Reference Cacho, Hester and Spring2007) describe the mortality factor as a product of target detectability and treatment efficacy. As described earlier, harvest rates (i.e., mortality factor) are largely dictated by detection. Moreover, ungerminated propagules are inconspicuous to search efforts. Hence, the path to exhausting the propagule bank is determined by recruitment rate derived from the persistence kernel (see Figure 2B) and search effort to adequately detect targets. In the model, a new mature disperses 320 first-generation progeny across an 841-ha isotropic area. The optimal harvest rate searched this area and exhausted this propagule bank in the 24th year, with the least search effort at 29.6 h (Figure 5A and B). Ninety percent of that total effort was expended within the first 9 yr. Excess search effort exhausted the propagule bank at the same time, but with increasing effort up to 161.3 h at a harvest rate of 0.999; more than a 5-fold increase. Suboptimal harvest rates greatly compounded the efforts, with every mature M. calvescens augmenting the propagule bank and extending the time to extinction. Here, the lowest suboptimal rate of 0.697 required 254.7 h of search effort to exhaust the compounded propagule bank; almost a 9-fold increase. Failed and containment harvest rates required search efforts in perpetuity and were greater than the extinction points for suboptimal and excess harvest rates. While it is difficult or impractical to optimally manage the extinction of an incipient propagule bank over time, this model suggests that search effort is less sensitive to excess harvest rates and is least likely to fail in exhausting the propagule bank and, furthermore, will mitigate range expansion.
(A) The cumulative effort over time where harvest rates proportional to recruitment fail (black arrow; 0.695), contain (red arrow; 0.696), suboptimally eradicate (gray point; 0.697), optimally eradicate (red point; 0.717), and excessively eradicate (blue point; 0.999). (B) The cumulative effort to achieve eradication across harvest rates. Note: arrows depict continuation beyond the scale of the graph.

Our model arbitrarily assumes an M. calvescens plant reaching first maturity and dispersing a small number of propagules uniformly across suitable habitat. However, it is often possible to encounter older mature plants that have already dispersed multiple generations of propagules (Meyer Reference Meyer1998) or for propagules to be deposited in microsites that influence germination and growth (Mendes-Rodrigues et al. Reference Mendes-Rodrigues, Araújo, Barbosa-Souza, Barbosa-Souza, Ranal, Santana and Oliveir2010). We considered these scenarios with the output sensitivity of time to extinction and optimal harvest rate against variations of propagule bank size and annual recruitment rate inputs (Figure 6A and B). Time to extinction was proportional to propagule bank size and inversely proportional to recruitment rate. Optimal harvest rate was also proportional to propagule bank size and annual recruitment rate.
Model responses in time to extinction (years) and optimal harvest rate dependent on (A) propagule bank size and (B) annual recruitment rate derived from a first-order decay function.

Hester et al. (Reference Hester, Brooks, Cacho and Panetta2010) determined treatment cost to be negligible in comparison with search cost with Australia’s M. calvescens management strategies. The costs of controlling a weed invasion are influenced by a number of factors, including plant detectability, area accessibility, and methods used (Cacho et al. Reference Cacho, Hester and Spring2007; Hester et al. Reference Hester, Brooks, Cacho and Panetta2010). The HBT treatment platform has greatly enhanced helicopter surveillance of inaccessible areas in the EMW (Leary et al. Reference Leary, Mahnken, Cox, Radford, Yanagida, Penniman, Duffy and Gooding2014). An isotropic progeny density raster was created with annular rings derived from the percentiles of the leptokurtic dispersal kernel (Figure 7A). Pixel area costs were density dependent, ranging widely from US$329.27 nearest the maternal source to US$0.42 out to the maximum range distance (Figure 7B). The total variable cost coinciding with the optimal search effort and elimination of all progeny was>US$41,600. The most distant 1% of progeny occupy the lowest-cost pixel areas but required 88% of the effort to search for and eliminate (Figure 7C). Thus, 75% of the total cost was obligated to completing this task, with a majority of this effort identifying where targets are not located (i.e., p nd). Resources dedicated to finding remote, incipient populations can reduce future impact and avoid future cost to protect an area of interest (Mehta et al. Reference Mehta, Haight, Homans, Polasky and Venette2007). Here, we further acknowledge the value of surveillance protecting the landscape by confirming nondetection as a measurable probability reducing uncertainty.
(A) Two-dimensional pixel raster of the dispersal kernel (i.e., impact; pink), (B) variable cost per pixel (i.e., 100 m2), and (C) optimal search effort to detect progeny across the dispersal kernel. Note: the points are percentiles of the probability density function.

The variable cost outputs were inversely proportional to suboptimal harvest rates and proportional to excess harvest rates (Figure 8A). Hence, the optimal harvest rate has the lowest total variable cost. Cost appears less sensitive to excess rates, where the highest excess harvest rate 0.999 was more economical than suboptimal harvest rates<0.70. More to the point, the suboptimal harvest rate of 0.71, just below optimal, was equitable to the excess harvest rate of 0.87. Similar to the optimal harvest rate, variable costs were proportional to propagule bank size and annual recruitment rate (Figure 8B and C) but appear to be much more sensitive to dispersal range (i.e., area expansion) (Figure 8D). This offers a further preference for exhausting the propagule bank with excess harvest rates over suboptimal, where life history and local occupation are uncertain. We further show that investments below optimal would fail to eradicate, warranting a strategy reduction with more attainable goals or possibly doing nothing (Cacho et al. Reference Cacho, Wise, Hester and Sinden2008).
Output response sensitivity of variable cost to locally eradicate an incipient population based on inputs: (A) harvest rate, (B) propagule bank size, (C) annual recruitment rate, and (D) dispersal range. Note: unless variable, x i=320 propagules, annual recruitment rate is 0.24, dispersal range is 1,636 m, and the harvest rate is optimal.

Many model studies support the current convention of prioritizing the elimination of incipient populations over higher-density infestations (Mehta et al. Reference Mehta, Haight, Homans, Polasky and Venette2007; Moody and Mack 1988; Taylor and Hastings Reference Taylor and Hastings2004), including outside-in containment in lieu of eradication when resources become limited (Cacho et al. Reference Cacho, Wise, Hester and Sinden2008; Chadès et al. Reference Chadès, Martin, Nicol, Burgman, Possingham and Buckley2011; Leung et al. Reference Leung, Cacho and Spring2010). Cacho et al. (Reference Cacho, Wise, Hester and Sinden2008) modeled the optimization of a control strategy with two switching points: (1) transition from eradication to containment and (2) transition from containment to terminating control strategy. Here, we acknowledge that eradication or comprehensive containment of M. calvescens invading the EMW is an unattainable goal with the current resources. However, we also recognize that termination of the control program would be detrimental to the remaining uninvaded EMW. Instead, we infer a third phase of management, switching from containment to protecting assets that could have environmental, cultural, or economic significance (Downey et al. Reference Downey, Johnson, Virtue and Williams2011; Hobbs and Humphries Reference Hobbs and Humphries1995). From 2012 to 2016, HBT helicopter operations were conducted under an assumed containment strategy. In this approach, only 28% of operations were unintentionally invested in the first-priority watershed asset, while 21% and 51% of operations were relegated to second- and third-priority assets, respectively. This was comparable to the number of M. calvescens targets eliminated in these areas: 25%, 18%, and 57%, respectively. In retrospect, direct management within the first-priority watershed asset resulted in 42% of the total area receiving some level of protection (Figure 9A), while secondary and tertiary management only offered protection to 22% and 6% of the first-priority area, respectively (Figure 9B and C). The highest cost investments were recorded in the third-priority buffer from 2012 to 2016, exceeding the average cost of investments in the first-priority area more than 2-fold (Figure 10A). Direct management within the first-priority watershed asset avoided the most costs, due to both the larger area protected and the level of impact in the vicinity of the target locations (Figure 10B). Management within the first-priority watershed asset avoided more than US$184 in future management costs for every US$1 invested, while investments in second- and third-priority areas contributed more modest returns of US$27 and US$3, respectively (Figure 10C). Because these operations were likely undersupported in meeting a comprehensive containment objective, we emphasize how these ratios may justify a transition to protecting the highest priority watershed asset as a future strategy.
Impact mitigated within the first-priority watershed asset (red zone between 400 and 1,200 m a.s.l.) by efforts to remove Miconia calvescens from the first- (A; red), second- (B; yellow), and third-priority (C; blue) asset areas. Note contour line intervals at 30 m a.s.l. (i.e., 100 feet a.s.l.).

(A) Past expenditures in each of the priority areas from 2012 to 2016 herbicide ballistic technology operations with (B) costs avoided in the first-priority asset area from each of those investments resulting in (C) mean annual cost-effectiveness derived from the avoided:expense ratio. The error bars are +/− standard deviations.

In this case study, eradication of satellite M. calvescens occupying first-priority watersheds is justified by the highest possible return in designated asset protection. This is effectively the inverse of the “outside-in” containment strategy described earlier; instead, an “inside-out” approach centralizes active management within the asset boundary and radiates out with an exclusion front demarcated from the boundary out to dispersal range of M. calvescens. Inherently, the high returns in asset protection will diminish with excess effort (see Figure 4). Furthermore, protection over time will also eventually be compromised with encroachment of unchecked populations breaching the exclusion zone. By digressing to a defensive last stand, this trade-off is unavoidable and may lead to divestment and eventual program termination (Cacho et al. Reference Cacho, Wise, Hester and Sinden2008; Rejmánek and Pitcairn Reference Rejmánek and Pitcairn2002). On the other hand, there are also, yet to be fully realized limits of suitable habitat and the impact that could be imposed on this priority area. Pouteau et al. (Reference Pouteau, Meyer and Stoll2011) predicted precipitation, elevation (i.e., temperature), and slope steepness as major variables explaining the M. calvescens distribution in French Polynesia; the EMW shares many of these same conditions. We predict that a M. calvescens suitable habitat model for the EMW will further economize an asset protection strategy by refining optimal investment strategies and measures of cost-effectiveness in accordance with the likelihood and magnitude of impact on the landscape.
This history of M. calvescens management in the EMW is a case study of valiant management efforts originally intending to eradicate, but ultimately operating with insufficient support (Meyer et al. Reference Meyer, Loope and Goarant2011). Moreover, current support has also become insufficient to contain the invasion front spread across a majority of the EMW below 1,000 m a.s.l. Thus, scaling management to local eradication in smaller, priority asset areas may be warranted in protecting critical ecosystem services vulnerable to M. calvescens incursion. Here, we have developed a spatiotemporal model that measures management effort required to eliminate M. calvescens satellites before reaching maturity, extinguishing incipient populations. Cost-effectiveness is determined by the avoidance of future cost obligations to eliminate future progeny in newly impacted areas. Future research is needed to further develop a spatially explicit priority system for the EMW that valuates ecosystem services associated with this forested watershed and a suitability model that helps us better predict life-history traits (e.g., persistence, maturity, and fecundity) influenced by a variety of environmental factors in this heterogenous system.
Acknowledgments
We appreciate the comments and edits by Adam Radford and Jeremy Gooding and the invaluable directions offered by the anonymous reviewers. This study was supported in part by the USDA Forest Service Special Technology Development Program Award R5-2012-01, USDA Hatch Act Formula Grant project 132H, Hawaii Invasive Species Council Research and Technology Grant Program for FY14-17, the Maui County Department of Water Supply, and the Office of Economic Development via collaboration with the Maui Invasive Species Committee. Major funding and data archives for this management program were provided by the National Park Service, Haleakala National Park, and the Pacific Island Exotic Plant Management Team. We thank Helen Murphy for sharing data to compare dispersal kernels. No conflicts of interest have been declared.
Supplementary material
To view supplementary material for this article, please visit http://dx.doi.org/10.1017/inp.2018.26