

Reducing sugar-sweetened beverage (SSB) consumption has become a hot target among public health advocates. SSB lack any nutritional value and commonly represent a source of excess energy in the daily diet, especially among children( Reference Mourao, Bressan and Campbell 1 ). Regular consumption of SSB is associated with a range of adverse health consequences, including excess weight gain, diabetes, CVD and dental caries( Reference Singh, Micha and Khatibzadeh 2 , Reference Trumbo and Rivers 3 ). In this issue of Public Health Nutrition, Pabayo et al. additionally highlight the association of regular SSB consumption with depressive symptoms among adolescents( Reference Pabayo, Dias and Hemenway 4 ). It has recently been estimated that, worldwide, more than 180 000 deaths per year can be attributed to SSB consumption alone( Reference Singh, Micha and Khatibzadeh 2 ).
The public health community and international health authorities, such as the World Health Organisation (WHO), have repeatedly called for legislative action to tax beverages with added caloric sweeteners in an effort to reduce consumption( 5 – 7 ). Such taxes have the potential to improve public health in three different ways: (i) reduce purchases through an increase in price; (ii) educate the public, in a powerful way, about the health implications of consuming too many SSB; and (iii) generate revenue to be used for additional public health programmes or initiatives.
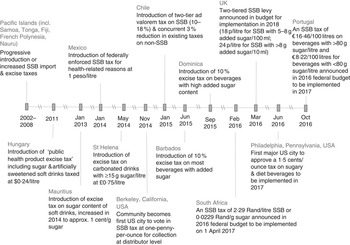
The idea of taxing SSB to improve public health was initiated in a 1994 New York Times article by Kelly Brownell( Reference Brownell 8 ). More than 20 years later we are beginning to witness growing international momentum towards SSB taxation policies. Once thought to be an impossible feat, governments of different jurisdictions around the world are now increasingly taking on big soda and winning( Reference Nestle 9 ). The tide has turned and a tipping point for action on taxing SSB has ensued. In this Editorial, we evaluate notable SSB taxation policies, in particular their design, implementation process and effectiveness, and derive key recommendations (see Fig. 1 for international timeline of notable SSB taxes).
Timeline of notable international action for sugar-sweetened beverage (SSB) taxation
Notable action
Although some Island nations in the Pacific (French Polynesia, Tonga, Cook Islands, Fiji, Nauru, Samoa), in addition to Mauritius, France and Hungary, were among the first countries to adopt SSB taxes( 10 ), it was the Mexican SSB tax, enacted at the beginning of 2014, which first captured significant international attention. An excise tax of 1 peso per litre (roughly equivalent to 10 %) on beverages with added caloric sweeteners (excluding milk-based beverages) was embedded in a wider strategy to tackle the rising burden of diabetes( Reference Colchero, Popkin and Rivera 11 ). When the policy was announced, it was confirmed that the revenue raised from the tax would be directed into general funds; however, the government resolved to use some of the revenue to fund potable water in schools, particularly in low-income areas( Reference Colchero, Popkin and Rivera 11 ). Nevertheless, there is little evidence to date to suggest any spending of revenue for this purpose. Evaluation of the policy has revealed complete pass-through of the tax from manufacturers to consumers at the point of sale( Reference Colchero, Salgado and Unar-Munguia 12 ). Furthermore, the tax has been associated with a 12% reduction in the volume of taxed beverages sold, 12 months post policy implementation, with the greatest reduction among low-income households (17% reduction)( Reference Colchero, Popkin and Rivera 11 ). Interestingly, the reduction in taxed beverages appeared to be driven by a reduction in non-carbonated beverages( Reference Colchero, Popkin and Rivera 11 ). It has been hypothesised that this relates to the relatively higher prices and lower price variation of non-carbonated, compared with carbonated, beverages, which limits substitution to lower-priced versions( Reference Colchero, Salgado and Unar-Munguia 12 ).
In the same year, the city of Berkeley, California became the first US city to successfully vote in a penny-per-ounce excise tax on the distribution of SSB (expected to raise prices by approximately 10%)( 13 ). Approximately 75% of residents voted in favour of the tax, despite the American Beverage Association spending more than $US 2 million to fight the tax( 14 ). For this policy, SSB are defined as beverages with added caloric sweeteners and include products such as soft drinks, energy drinks and heavily pre-sweetened teas, as well as pre-made syrup used to make fountain drinks( 13 ). Milk products and natural fruit and vegetable juices are exempt from the tax, as are small business retailers who transport and sell SSB directly to consumers within the city of Berkeley( 13 ). Revenue collected from the tax is directed into a general revenue fund; however, the policy includes the establishment of a panel of experts to advise on how, and to what extent, programmes that address SSB consumption and its consequences should be funded by the city( 13 ). As of March 2016, the tax has generated $US 1·5 million for community nutrition and health efforts, including school garden programmes( Reference Lynn 15 ). Pass-through rates from manufacturer to consumer have varied between 20 and 70% of the taxed amount, depending on the beverage type and method of analysis( Reference Cawley and Frisvold 16 , Reference Falbe, Rojas and Grummon 17 ). It is proposed that the limited geographical extent of the policy and thus the potential for cross-border shopping has contributed to the poor pass-on rate( Reference Cawley and Frisvold 16 ). Nevertheless, recent evaluation of the policy in low-income neighbourhoods has demonstrated a 21% reduction in self-reported SSB consumption, 4 months post policy implementation, compared with a 4% increase in comparison cities( Reference Falbe, Thompson and Becker 18 ). Conversely, water (bottled or tap) consumption increased by 63% in Berkeley compared with a 19% increase in comparison cities. The relatively large magnitude of effect reported in that study may be a reflection of a greater SSB price sensitivity among the low-income study population, the self-reported nature of the data, a change in social norms as a result of the influential advocacy campaign in the lead-up to the vote or the relatively low baseline consumption levels in this population.
Around the same time, the nearby city of San Francisco also took a two-pennies-per-ounce SSB tax to public ballot. However, unlike the proposal in Berkeley where the revenue raised from the tax was to be absorbed in a general pool, the San Francisco proposal included explicit earmarking of revenue for school nutrition, public education and fitness programmes( 19 ). Consequently, it required two-thirds public support, which it fell short of, with a final vote of 55% in favour of the proposed tax( 19 ). If the tax was not earmarked, it would have passed with more than 50% majority, as it did in Berkeley.
Chile, Dominica and Barbados all followed suit in 2015( 10 ). Chile instituted a 5% increase on the ad valorem tax of non-alcoholic beverages with more than 6·25 g of sugar per 100 ml (previously at 13%), while beverages with less than 6·25 g of sugar per 100 ml remain subject to a 10% tax. The changes coincided with a 3% reduction in the existing tax on non-SSB. Similarly, Dominica and Barbados levied a 10% excise tax on carbonated drinks and other beverages with high amounts of added caloric sweeteners. It was suggested that revenue collected from these taxes will contribute to a national ‘Get Healthy’ campaign in Dominica or assist with financing the heath-care sector in Barbados; however, there is no indication that funds will be explicitly set aside for these purposes. The tax in Barbados was almost exclusively driven by the Ministry of Finance as a fiscal measure to boost economic conditions( 20 ) and was influenced by health groups. Further, the choice of a flat percentage tax, rather than taxing the sugar content or volume of beverages, was purposely chosen due to the administrative burden associated with this more complex approach, which is difficult in a resource-limited country( 20 ).
2016 saw the announcement of an SSB tax in the federal budgets for South Africa and the UK. The South African Treasury recommended that an excise tax be implemented in the magnitude of 2·29 Rand per litre of SSB or 0·0229 Rand per gram of sugar (approximating a 20% price increase) on beverages with added caloric sweeteners( 21 ). Beverages that contain only natural sugars, such as 100% fruit juice and plain milk, are excluded from taxation. The tax is due to take effect on 1 April 2017. The UK proposal involves a two-tiered levy on beverages with added sugar (excluding milk-based drinks), imposed at the point of production or importation (with the smallest producers exempt from the tax)( Reference HM 22 ). It has been estimated that beverages containing more than 5 g of added sugar per 100 ml will be subjected to a levy of 18 pence per litre, increasing to 24 pence per litre for beverages with more than 8 g of added sugar per 100 ml( Reference HM 22 ) (equivalent to a price increase of roughly 18 and 24%, respectively). In England the revenue has been earmarked to fund children’s sporting programmes in schools( Reference HM 22 ). For Scotland, Wales and Northern Ireland it has not been announced where or how the revenue will be allocated. The levy is expected to take effect in April 2018.
Meanwhile in 2016, Philadelphia, Pennsylvania became the first large US city to approve a 1·5-cent-per-ounce excise tax on sweetened beverages, whether by added caloric sweeteners or artificially sweetened( 23 ). Products that are more than 50% milk and 100% fruit juices are excluded from the tax. Tax revenue has been earmarked for pre-kindergarten, community schools and recreation centres. US cities Albany, San Francisco and Oakland in California and Boulder, Colorado all voted in favour of an SSB tax in November 2016.
In October 2016, Portugal joined the growing number countries to announce an SSB tax in the federal budget. The policy proposes a tax of €16·46 per 100 litres on beverages with a sugar content greater than 80 g per litre and of €8·22 per 100 litres for beverages with less than 80 g of added sugar per litre. Milk-based beverages and juice will be spared from the tax.
As action in favour of SSB taxes is accelerating worldwide, many other countries and jurisdictions are starting the political conversations necessary for change. For maximum population health benefit, it will be essential that these countries capitalise on the lessons learnt so far from those that have already implemented SSB taxes. In this regard, we outline below recommendations to improve the design and evaluation of SSB taxation policies, as well as recommendations on how to successfully advocate and implement SSB taxation policies.
Lessons learnt
In order to improve the design and evaluation of SSB taxation policies the following recommendations can be derived:
-
∙ An SSB tax should be embedded within a comprehensive package of policies and interventions to improve population diets and non-communicable diseases.
-
∙ The tax should be developed with wide stakeholder consultation.
-
∙ To minimise substitution to alternative high-caloric beverages, broad-based taxes should be implemented on all beverages and syrups with added caloric sweeteners.
-
∙ The tax should be at least 10%, but 20% is expected to deliver greater population health benefits.
-
∙ For volumetric taxes, adjustments for inflation should be built into policies.
-
∙ For countries with appropriate administrative capacity, the level of the tax could be tied to the volume or the sugar content of the beverage. In resource-poor countries without automated revenue collection systems and infrastructure to test and monitor compliance, a flat-rate tax based on the initial price of the beverage may be more feasible.
-
∙ The tax should cover as wide a geographical area as possible to limit cross-border shopping and reduced pass-through rates.
-
∙ Mechanisms should be developed for earmarking of revenue to additional population prevention health-related strategies. This is likely to garner greater public support and result in greater population health benefits. Earmarking of revenue may be achieved through the direction of revenue to a newly generated health fund or through the allocation of revenue to a general budget, with a corresponding commitment to increase governmental spending on health-related activities. Although the allocation of revenue to a separate fund is more likely to result in funds being spent on population prevention interventions, this may not be administratively possible for some countries.
-
∙ Mechanisms for monitoring and evaluation should be built into any SSB tax policy. Iterative refinement of legislation after implementation is necessary to address any loopholes or inefficiencies of the policy.
-
∙ To build the evidence base on the effectiveness of SSB taxation policies, rigorous and standardised evaluation of all policies should be conducted. This should include average population effects and disaggregation of outcomes according to appropriate subgroups at higher risk of non-communicable disease, such as low-income populations and ethnic or racial minorities. In addition, the longer-term impact of SSB taxes should be carefully investigated. Where revenue from SSB taxes has been directed to health-related activities, evaluations should capture the additional impact of these activities. To date, most countries have not conducted rigorous evaluations, and those that have are not generally government-driven.
In addition, it will be incumbent on the public health community to understand the levers for successful implementation of SSB taxation policies and the barriers to inaction. Therefore, the pathway to implementation in different countries needs to be carefully examined and widely distributed for lessons to be learnt. Some key recommendations learnt so far include:
-
∙ Early and diverse coalition building across private and civic groups for collective, thoughtful and strategically planned advocacy campaigns with adequate financial support to overcome pressures from the beverage industry (e.g. in Mexico and Berkeley, advocacy campaigns were financially supported by Bloomberg Philanthropies).
-
∙ Strategic engagement with non-health government sectors, such as the Ministry of Finance, particularly at a time of challenging national economic conditions, and alignment of the political agenda with the recognition and need to reduce the burden of non-communicable disease.
-
∙ Opposing arguments for SSB taxation should be effectively rebutted by highlighting positive population health( Reference Colchero, Popkin and Rivera 11 ), health equity( Reference Backholer, Sarink and Beauchamp 24 ) and economic effects( Reference Long, Gortmaker and Ward 25 ), without compromising national net employment levels( Reference Powell, Wada and Persky 26 ).
-
∙ Earmarking of tax revenue to fund population initiatives, which are important to the local context (whether health-related or not), are likely to garner additional public support for the policy.
-
∙ Effective and far-reaching communication of the health-related reasons for SSB taxation to the general public will increase the sustainability of the policy measure. The Danish fat tax was repealed because it was not introduced for health reasons and strong public support was lacking( Reference Vallgarda, Holm and Jensen 27 ). The tax has since been shown to be effective after its repeal( Reference Jensen, Smed and Aarup 28 ).
Conclusion
A tax on SSB for health-related reasons holds great promise for improving population health, although it is not a silver bullet. Such a policy should be carefully developed to suit the context within which it will be implemented and be embedded within a comprehensive suite of interventions to improve population diets and diet-related diseases.
In addition, if SSB taxation policies become the norm in the near future, wider fiscal policies should be discussed and implemented. A tax on energy-dense, nutrient-poor packaged foods within retail settings and chain restaurants could represent a next step forward, using revenue to subsidise healthier minimally processed foods and meals( Reference Mozaffarian, Rogoff and Ludwig 29 ). Adjusting the price of both foods and beverages to reflect societal health costs and improve population health should be considered a public health priority.
Acknowledgements
Financial support: K.B. is supported by a Post-doctoral Research Fellowship from the National Heart Foundation of Australia (grant number PH 12M 6824). M.B. is supported by an Australian Postgraduate Award and a Monash University Department of Epidemiology and Preventative Medicine Scholarship. S.V. is supported by a research fellowship from the National Heart Foundation in New Zealand. Conflict of interest: K.B. is an Associate Editor and S.V. is Deputy Editor for Public Health Nutrition. The authors have no other conflicts of interest to declare. Authorship: All authors conceived and contributed to writing the manuscript.

