


Statement of Research Significance
Research Question(s) or Topic(s): We aimed to examine executive function deficits in children with Neurofibromatosis Type 1, focusing on how increased cognitive load contributes to the overwhelm frequently reported by these patients. Main Findings: Children with Neurofibromatosis Type 1 demonstrate greater susceptibility to tasks with higher cognitive load, exhibiting significantly poorer accuracy and consistency in executive function performance compared to typically developing peers. Study Contributions: By identifying the unique negative impact of increased cognitive load on executive functioning in children with Neurofibromatosis Type 1, our findings highlight the need for targeted interventions. Such interventions may help reduce cognitive overload and with the goal of improving academic achievement and social–emotional well-being in this population.
Introduction
Neurofibromatosis type 1 (NF1) is an autosomal dominant genetic condition affecting approximately 1 in 2500–3000 live births (Boyd et al., Reference Boyd, Korf and Theos2009). Variants within the NF1 gene on chromosome 17q11.2 downregulates production of the tumor suppressor protein neurofibromin, which leads to uncontrolled cell proliferation and contributes to heterogenous impacts across multiple body systems, including the central nervous system (Boyd et al., Reference Boyd, Korf and Theos2009). While clinical diagnostic criteria for NF1 are based on the presence of common physical features (e.g., café-au-lait macules, freckling, iris Lisch nodules, neurofibromas, optic pathway glioma) (Legius et al., Reference Legius, Messiaen, Wolkenstein, Pancza, Avery, Berman, Blakeley, Babovic-Vuksanovic, Cunha, Ferner, Fisher, Friedman, Gutmann, Kehrer-Sawatzki, Korf, Mautner, Peltonen, Rauen, Riccardi and Plotkin2021), the condition is frequently associated with significant cognitive and behavioral morbidity, with studies indicating that most children with NF1 (up to 80%) show cognitive deficits in one or more areas (Crow et al., Reference Crow, Janssen, Marshall, Moffit, Brennan, Kohler, Roalf and Moberg2022; Hyman et al., Reference Hyman, Shores and North2005). Developmentally, children with NF1 are more likely to demonstrate motor, language, and cognitive delays (Lorenzo et al., Reference Lorenzo, Barton, Acosta and North2011). Intellectual functioning most often falls in the low average to average range, though multiple studies show small but significant reductions in overall intellectual functioning compared to normative and sibling controls (Hyman et al., Reference Hyman, Shores and North2005). There is also an increased prevalence of neurodevelopmental disorders, including attention-deficit/hyperactivity disorder ( Boulanger & Larbrisseau, Reference Boulanger and Larbrisseau2005; Torres Nupan et al., Reference Torres Nupan, Velez Van Meerbeke, López Cabra and Herrera Gomez2017), Autism Spectrum Disorder (Chisholm et al., Reference Chisholm, Anderson, Pride, Malarbi, North and Payne2018; Garg et al., Reference Garg, Green, Leadbitter, Emsley, Lehtonen, Evans and Huson2013), and Specific Learning Disorders (Boulanger & Larbrisseau, Reference Boulanger and Larbrisseau2005; Hyman et al., Reference Hyman, Arthur Shores and North2006).
A growing body of research aiming to understand the cognitive phenotype of NF1 identifies a wide range of affected areas, with particularly high likelihood of deficits in visual-perceptual skills, visual-motor skills, attention, and executive function (EF) (Hyman et al., Reference Hyman, Shores and North2005; Payne et al., Reference Payne, Haebich, MacKenzie, Walsh, Hearps, Coghill, Barton, Pride, Ullrich, Tonsgard, Viskochil, Schorry, Klesse, Fisher, Gutmann, Rosser, Packer, Korf, Acosta and North2021). EF are higher-level cognitive processes involved in carrying out and regulating cognitive and emotional functions and goal-directed behavior (Diamond, Reference Diamond2013) and are important in academic skills development including reading, writing, and mathematics in the general population (Samuels et al., Reference Samuels, Tounaki, Blackman and Zilinski2016; Willoughby et al., Reference Willoughby, Wylie and Little2019) as well as NF1 (Geoffray et al., Reference Geoffray, Robinson, Ramamurthy, Manderson, O’Flaherty, Lehtonen, Tordjman, Green, Vassallo and Garg2021; Hou et al., Reference Hou, Wu, Allen, Toledo-Tamula, Martin, Gillespie, Goodwin, Widemann and Wolters2023; Hou et al., Reference Hou, Allen, Wolters, Toledo-Tamula, Martin, Baldwin, Reda, Gillespie, Goodwin and Widemann2020; Pride et al., Reference Pride, Payne and North2012). Research shows that EF deficits are a core cognitive feature of NF1, even in the absence of ADHD (Payne et al., Reference Payne, Arnold, Pride and North2012); with previous research showing that compared to typically developing children, youth with NF1 show deficits across all aspects of EF, including working memory, planning/problem solving, inhibitory control, and cognitive flexibility (Beaussart et al., Reference Beaussart, Barbarot, Mauger and Roy2018; Smith et al., Reference Smith, Kaczorowski and Acosta2020). While EF challenges are clearly pervasive in NF1, there is nonetheless substantial variability in cognitive profiles, and longitudinal studies also show within-person variability in cognitive outcomes over time (Payne et al., Reference Payne, Hearps, Walsh, Paltin, Barton, Ullrich, Haebich, Coghill, Gioia, Cantor, Cutter, Tonsgard, Viskochil, Rey-Casserly, Schorry, Ackerson, Klesse, Fisher and Gutmann2019; Van Der Vaart et al., Reference van der Vaart, Rietman, Plasschaert, Legius, Elgersma, Moll, tte, Oostenbrink, Vogels, de Wit, Descheemaeker, Vergouwe, Catsman-Berrevoets and Manai2016). Therefore, additional research is needed to better understand specific cognitive profiles of NF1 and factors that contribute to inter- and intra-individual heterogeneity.
One central factor, which may support understanding of the variable cognitive presentation of youth with NF1 is cognitive load. Cognitive load theory (Sweller, Reference Sweller1988; Van Merriënboer & Sweller, Reference Van Merriënboer and Sweller2005) postulates that what an individual learns and/or how they perform on a given task is highly dependent on the cognitive “load” – or cognitive resources/effort necessary for a task. Cognitive load can vary based on intrinsic (e.g., inherent difficulty or complexity of the material or activity) and extrinsic factors (e.g., how the material is presented). Cognitive overload occurs when the demands or load of a given task (intrinsic and extrinsic) exceed an individual’s available cognitive resources, which can lead to poor performance and/or limited learning. When cognitive resources are spread too thin, an individual may struggle to keep track of all the necessary information and/or allocate sufficient mental effort to the critical elements of the task, which leads to mistakes, slower processing, and difficulty organizing, analyzing, or synthesizing information.
According to cognitive load theory, an individual’s working memory capacity can be a “bottleneck” for learning/cognitive performance, such that weaknesses in working memory may increase susceptibility to cognitive overload and have widespread effects on cognitive task performances, particularly in the context of high task demands (Sweller, Reference Sweller1988; Schnotz & Kürschner, Reference Schnotz and Kürschner2007; Van Merriënboer & Sweller, Reference Van Merriënboer and Sweller2005). Given the increased risk of working memory problems in children with NF1 (Beaussart et al., Reference Beaussart, Barbarot, Mauger and Roy2018; Smith et al., Reference Smith, Kaczorowski and Acosta2020), they may be particularly vulnerable to cognitive overload and the associated widespread impact on cognition and learning. Indeed, a prior study showed that adolescents with NF1 demonstrate a greater decrement in performance across a variety of EF tasks as the cognitive demands increase (i.e., greater inhibitory control, cognitive flexibility, and working memory) compared to healthy age and gender-matched controls (Rowbotham et al., Reference Rowbotham, Pit-ten Cate, Sonuga-Barke and Huijbregts2009).
To our knowledge, cognitive load has not yet been directly studied in youth with NF1. Studies of children with ADHD, which is highly prevalent in NF1, have shown that increased cognitive load impacts other aspects of EF. Specifically, under higher cognitive load, children with ADHD show greater difficulties with response inhibition (Martinelli et al., Reference Martinelli, Mostofsky and Rosch2017; Seymour et al., Reference Seymour, Mostofsky and Rosch2016) and delay discounting (Martinelli et al., Reference Martinelli, Mostofsky and Rosch2017) compared to typically developing peers.
The current study aims to extend the current literature on EF in youth with NF1 by further investigating the impact of cognitive load on performance for children with NF1 compared to typically developing children. We hypothesize that an increase in cognitive load will have a greater negative impact on performance accuracy and speed in children with NF1 compared to the comparison group.
Method
Participants and procedures
Study participants were recruited from two primary children’s hospitals’ Neurofibromatosis Clinics, one in the U.S. and one in Australia. All research procedures were completed in accordance with the Helsinki Declaration, and the protocol was approved by the institutional review board for human protections at Children’s National Hospital and Murdoch Children’s Research Institute.
Parents and children aged 7 to 18 diagnosed with NF1 were invited to participate at each center. Exclusion criteria included the presence of any significant neurological comorbidity including central nervous system tumor requiring current treatment, seizures, and any sensory impairment that would interfere with the patient’s ability to complete the computerized task or neuropsychological assessment. Parents engaged in informed consent and children engaged in assent. Participants completed a single study visit involving a brief neurocognitive evaluation of the child including an intellectual screener (Wechsler Abbreviated Scale of Intelligence–Second Edition (WASI-II) Wechsler, Reference Wechsler2011) and the Test of Executive Control (TEC) (Isquith et al, Reference Isquith, Roth and Gioia2006). The participant’s parent or primary guardian completed a parent rating of EF difficulties (Behavior Rating Inventory of Executive Function; BRIEF (Gioia et al., Reference Gioia, Isquith, Guy and Kenworthy2000). A total of 48 children with NF1 were enrolled in the study (US n = 14; AUS n = 34). Six children with NF1 were excluded due to validity concerns (i.e., performance on the TEC which flagged embedded validity indices), none were excluded based on criteria noted above, resulting in a final sample of 42 children with NF1. Three participants had diagnosed brain tumors with previous treatment but were included as they were not on current treatment and tumors and neurological status was stable. No participants had a history of seizures, and no patients were excluded for sensory impairment precluding participation. The control sample was drawn from the normative dataset for the TEC (n = 42) and as such, no additional measures were available for comparison. The control sample was matched based on age and sex with the NF1 group. Sample demographics are presented in Table 1.
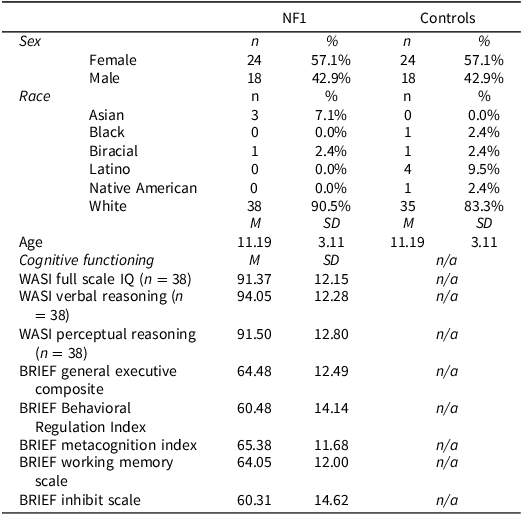
Sample characteristics

Notes: NF1 = Neurofibromatosis Type 1, WASI = Wechsler Abbreviated Scale of Intelligence, BRIEF = Behavior Rating Inventory of Executive Function.
WASI Standard Scores have a mean of 100 and SD of 15; BRIEF T-Scores have a mean of 50 and SD of 10. Higher scores on the BRIEF indicate greater problems. NF1 and control groups were matched by age and sex. IQ and BRIEF data were available for the NF1 group only.
Measurement of cognitive load
Performance-based measurement of cognitive load is based on secondary task performance methodology, in which the cognitive load of a primary task is reflected by the performance on a concurrent secondary task (Paas et al., Reference Paas, Tuovinen, Tabbers and Van Gerven2003). In other words, when an individual completes two concurrent cognitive tasks, they experience higher cognitive load as primary task demands increase, resulting in worsening performance on the secondary task. In the current study, cognitive load was assessed using the TEC, a standardized, computer administered test, which combines n-back (primary, working memory task) and go/no-go (secondary, inhibitory control task) paradigms (Isquith et al, Reference Isquith, Roth and Gioia2006). The participants were seated at a computer where they are presented with a sequence of visual stimuli (e.g., pictures of common objects with low verbal demand). A keyboard with a red and a blue response button was provided. Participants were trained to respond as quickly as possible without making an error. Participants were instructed to press the blue key for all stimuli (standard stimuli) except the identified target stimuli, for which they were to press the red key. Blue key responses (frequent) are called Standard responses while red key responses (infrequent) are called Target responses. During the primary n-back task, participants are presented with a sequence of visual stimuli (e.g., pictures of common objects with low verbal demand) and asked to indicate whether the currently presented stimulus matches the one presented n steps earlier in the sequence. The TEC n-back includes levels of increasing working memory load, including 0-back (e.g., identify a target that matches an established category) and 1-back (e.g., identify when a target matches the one that came immediately before it). For older children (>8 years), a third level is included in the task (2-back; identify when a target matches the one that came two pictures before it). The current study limited analysis to the two levels of working memory load administered to all age ranges (0-back and 1-back). The secondary go/no-go task consists of presence or absence of an inhibitory signal added to the n-back paradigm, such that participants respond as usual to the n-back when the signal is absent, and do not provide any response (e.g., inhibit) when the signal is present. Inhibition signals only occur in the Standard (blue button) trials. The primary n-back and secondary go/no-go tasks are completed simultaneously. Tasks are fully crossed to manipulate working memory (e.g., 0, 1-back) and inhibitory control (e.g., absence/presence of inhibitory signal). The test yields 4 tasks presented in a fixed sequence (see Figure 1): 0B (0-Back), 0 BI (0-Back with inhibit demand), 1B (1-Back), and 1 BI (1-Back with inhibit demand). The n-back tasks require the participant to respond to frequent (i.e., Standard) stimuli and infrequent (i.e., Target) stimuli. This constant response demand establishes a prepotent response set, making inhibition on the no-go inhibitory cue more challenging (Isquith et al, Reference Isquith, Roth and Gioia2006).
Illustration of TEC tasks.

The primary outcomes include response accuracy (e.g., correct responses, commission errors), speed (e.g., average response time [mean]), and consistency (e.g., overall variability in response time [standard deviation], variability in response time across tasks [inter-condition variability]). T-scores, determined relative to the normative sample, are presented. Higher T scores indicate worse performance. A T-Score of 60 or higher is considered clinically elevated on the TEC (Isquith et al, Reference Isquith, Roth and Gioia2006).
Statistical analysis
Statistical analyses were conducted using SPSS v30.0. First, group differences in overall TEC performance were examined via a general linear model (GLM), which included the between-subjects effects (NF1 vs controls) for each of the TEC summary scores representing overall response accuracy (e.g., correct responses, commission errors), speed (e.g., average response time [mean]), and consistency (e.g., overall variability in response time [standard deviation], variability in response time across tasks [inter-condition variability]). A comparison of the rate of clinically elevated TEC summary T-scores across youth with NF1 and healthy controls was also conducted using a Chi-Square test.
Next, a single mixed design (repeated measures and between-subjects factors) General Linear Model was used to examine the within-subject effects of working memory (comparison between 0-back and 1-back tasks) and inhibition (comparison between n-back only and n-back with inhibition). The model also included analysis of the interaction between these tasks. Specifically, the interactions of between-subject factors (group) and within-subject factors (working memory, inhibition) were included to examine whether the effect of within-subject factors (working memory, inhibitory control) on task performance (target response accuracy and speed, standard response accuracy and speed, and standard response consistency) differed across youth with NF1 and healthy controls.
In addition to the primary multivariate repeated-measures analysis, we conducted supplementary univariate repeated-measures ANOVAs to examine between-group differences in working memory load and inhibition load. Estimated marginal means were compared using Bonferroni-adjusted pairwise comparisons.
Pearson product-moment correlation was conducted using the BRIEF Global Executive Composite (GEC) to explore associations between TEC performance and reported EF on the BRIEF Parent report in the NF1 patients only.
Results
Overall task performance (between-subject effects; Table 2)
Youth with NF1 showed reduced accuracy overall compared to controls. Specifically, they had fewer correct responses collapsed across standard and target trials and made more impulsive errors (commission errors). On average, response speed or variability did not significantly differ across groups (response time mean, response time standard deviation). However, youth with NF1 showed more variability in their response time across tasks (inter-condition variability). A significantly higher percentage of youth with NF1 exhibited deficits in target correct responses than controls while at the same time a significantly lower percentage of youth with NF1 showed deficits in target response time (See Figure 2).
Clinically elevated scores on the TEC in youth with NF1 vs. controls. Note:*Significant difference between groups (p<0.05).

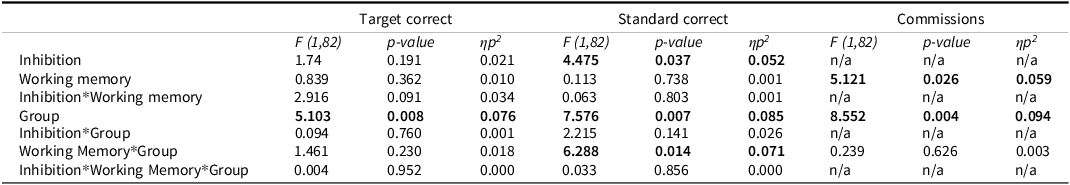
Interaction of working memory, inhibition, and group effects on response accuracy

Note: Partial-Eta Squared (ηp 2 ) effect sizes are interpreted as follows: 0.01 = small, 0.06 = medium, >0.14 = large. Commission errors were scored only for trials with no inhibitory control demand – thus the within-subject effects for working memory load (but not inhibitory control) are presented.
Impact of cognitive load: multivariate analysis
Multivariate effects of inhibition and working memory
The primary multivariate repeated-measures analysis revealed significant main effects of inhibition (p = .018) and working memory (p = .008), as well as a significant inhibition × group interaction (p = .015, η2 p = .144). This indicates that the effect of inhibition varied by group across multiple cognitive measures. The working memory × group interaction was also significant (p = .040), suggesting group differences were most pronounced under higher working memory load. These findings support a multicomponent impact of cognitive load on executive functioning in NF1 (see Tables 2–4, Figures 3–5).
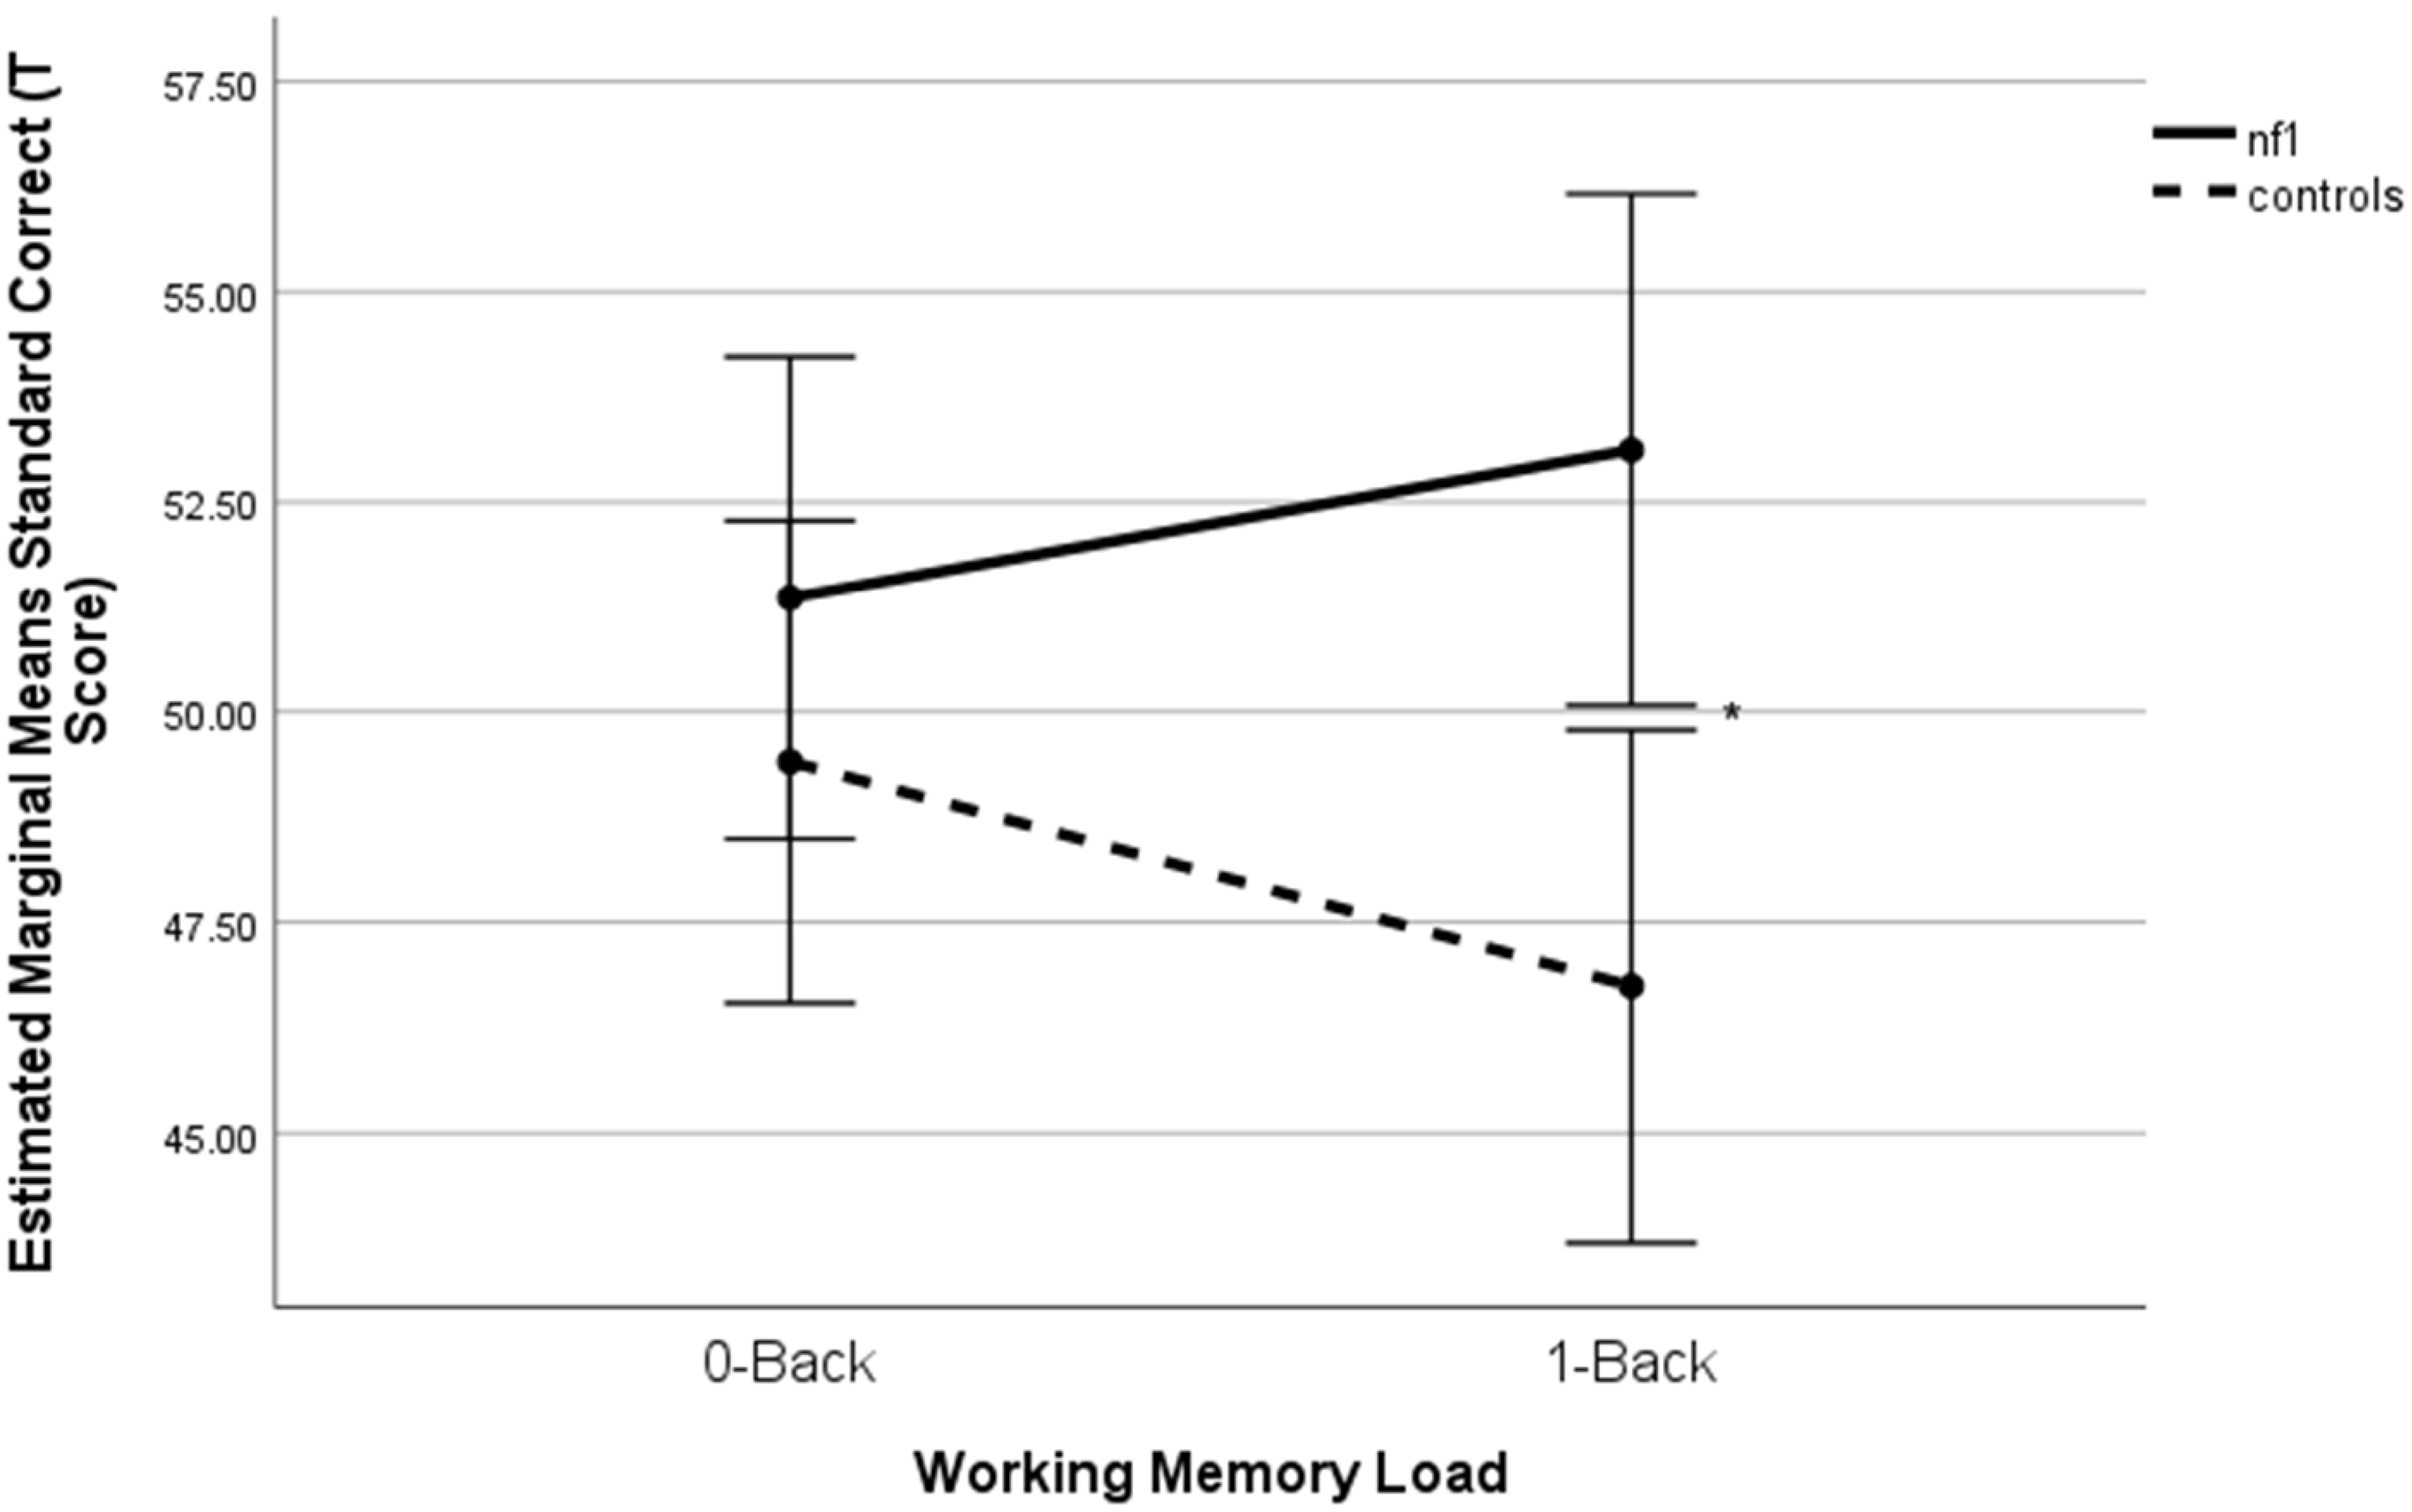
Working memory × group interaction on standard response accuracy+. Notes. +Higher scores denote poorer performance. Note: *p < .01.

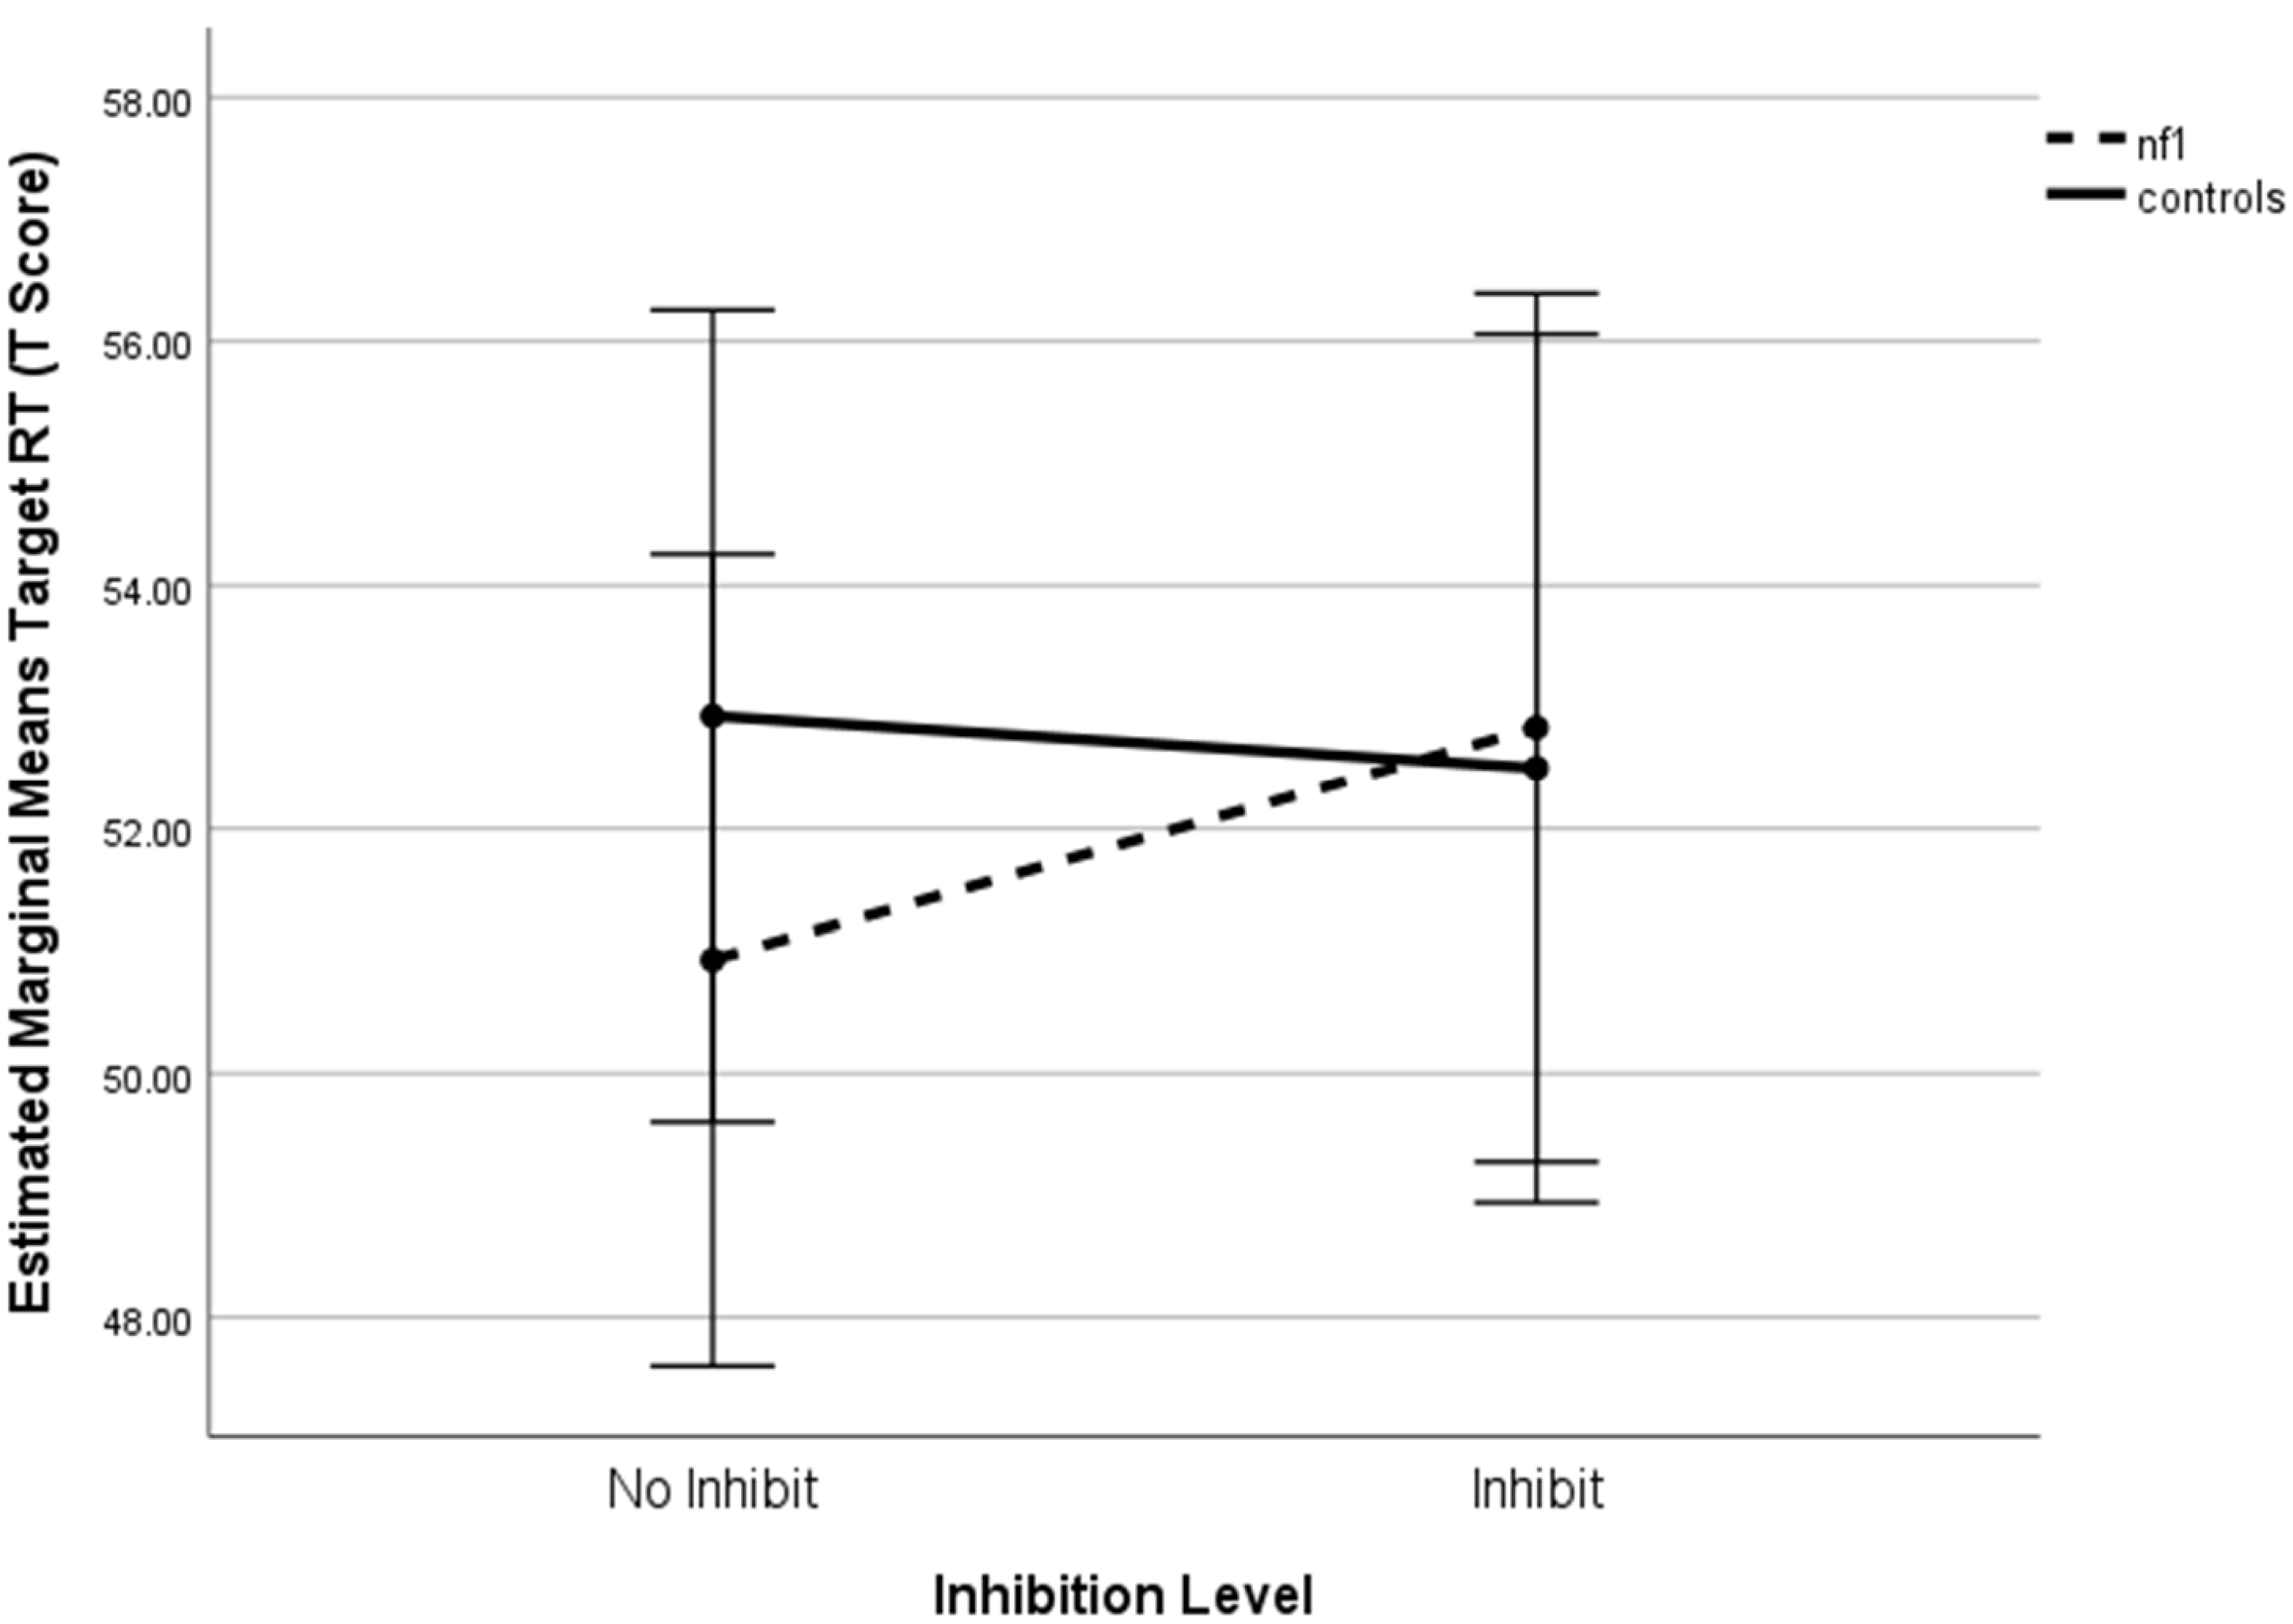
Inhibition × group interaction on target response time+. Notes. +Higher scores denote poorer performance.

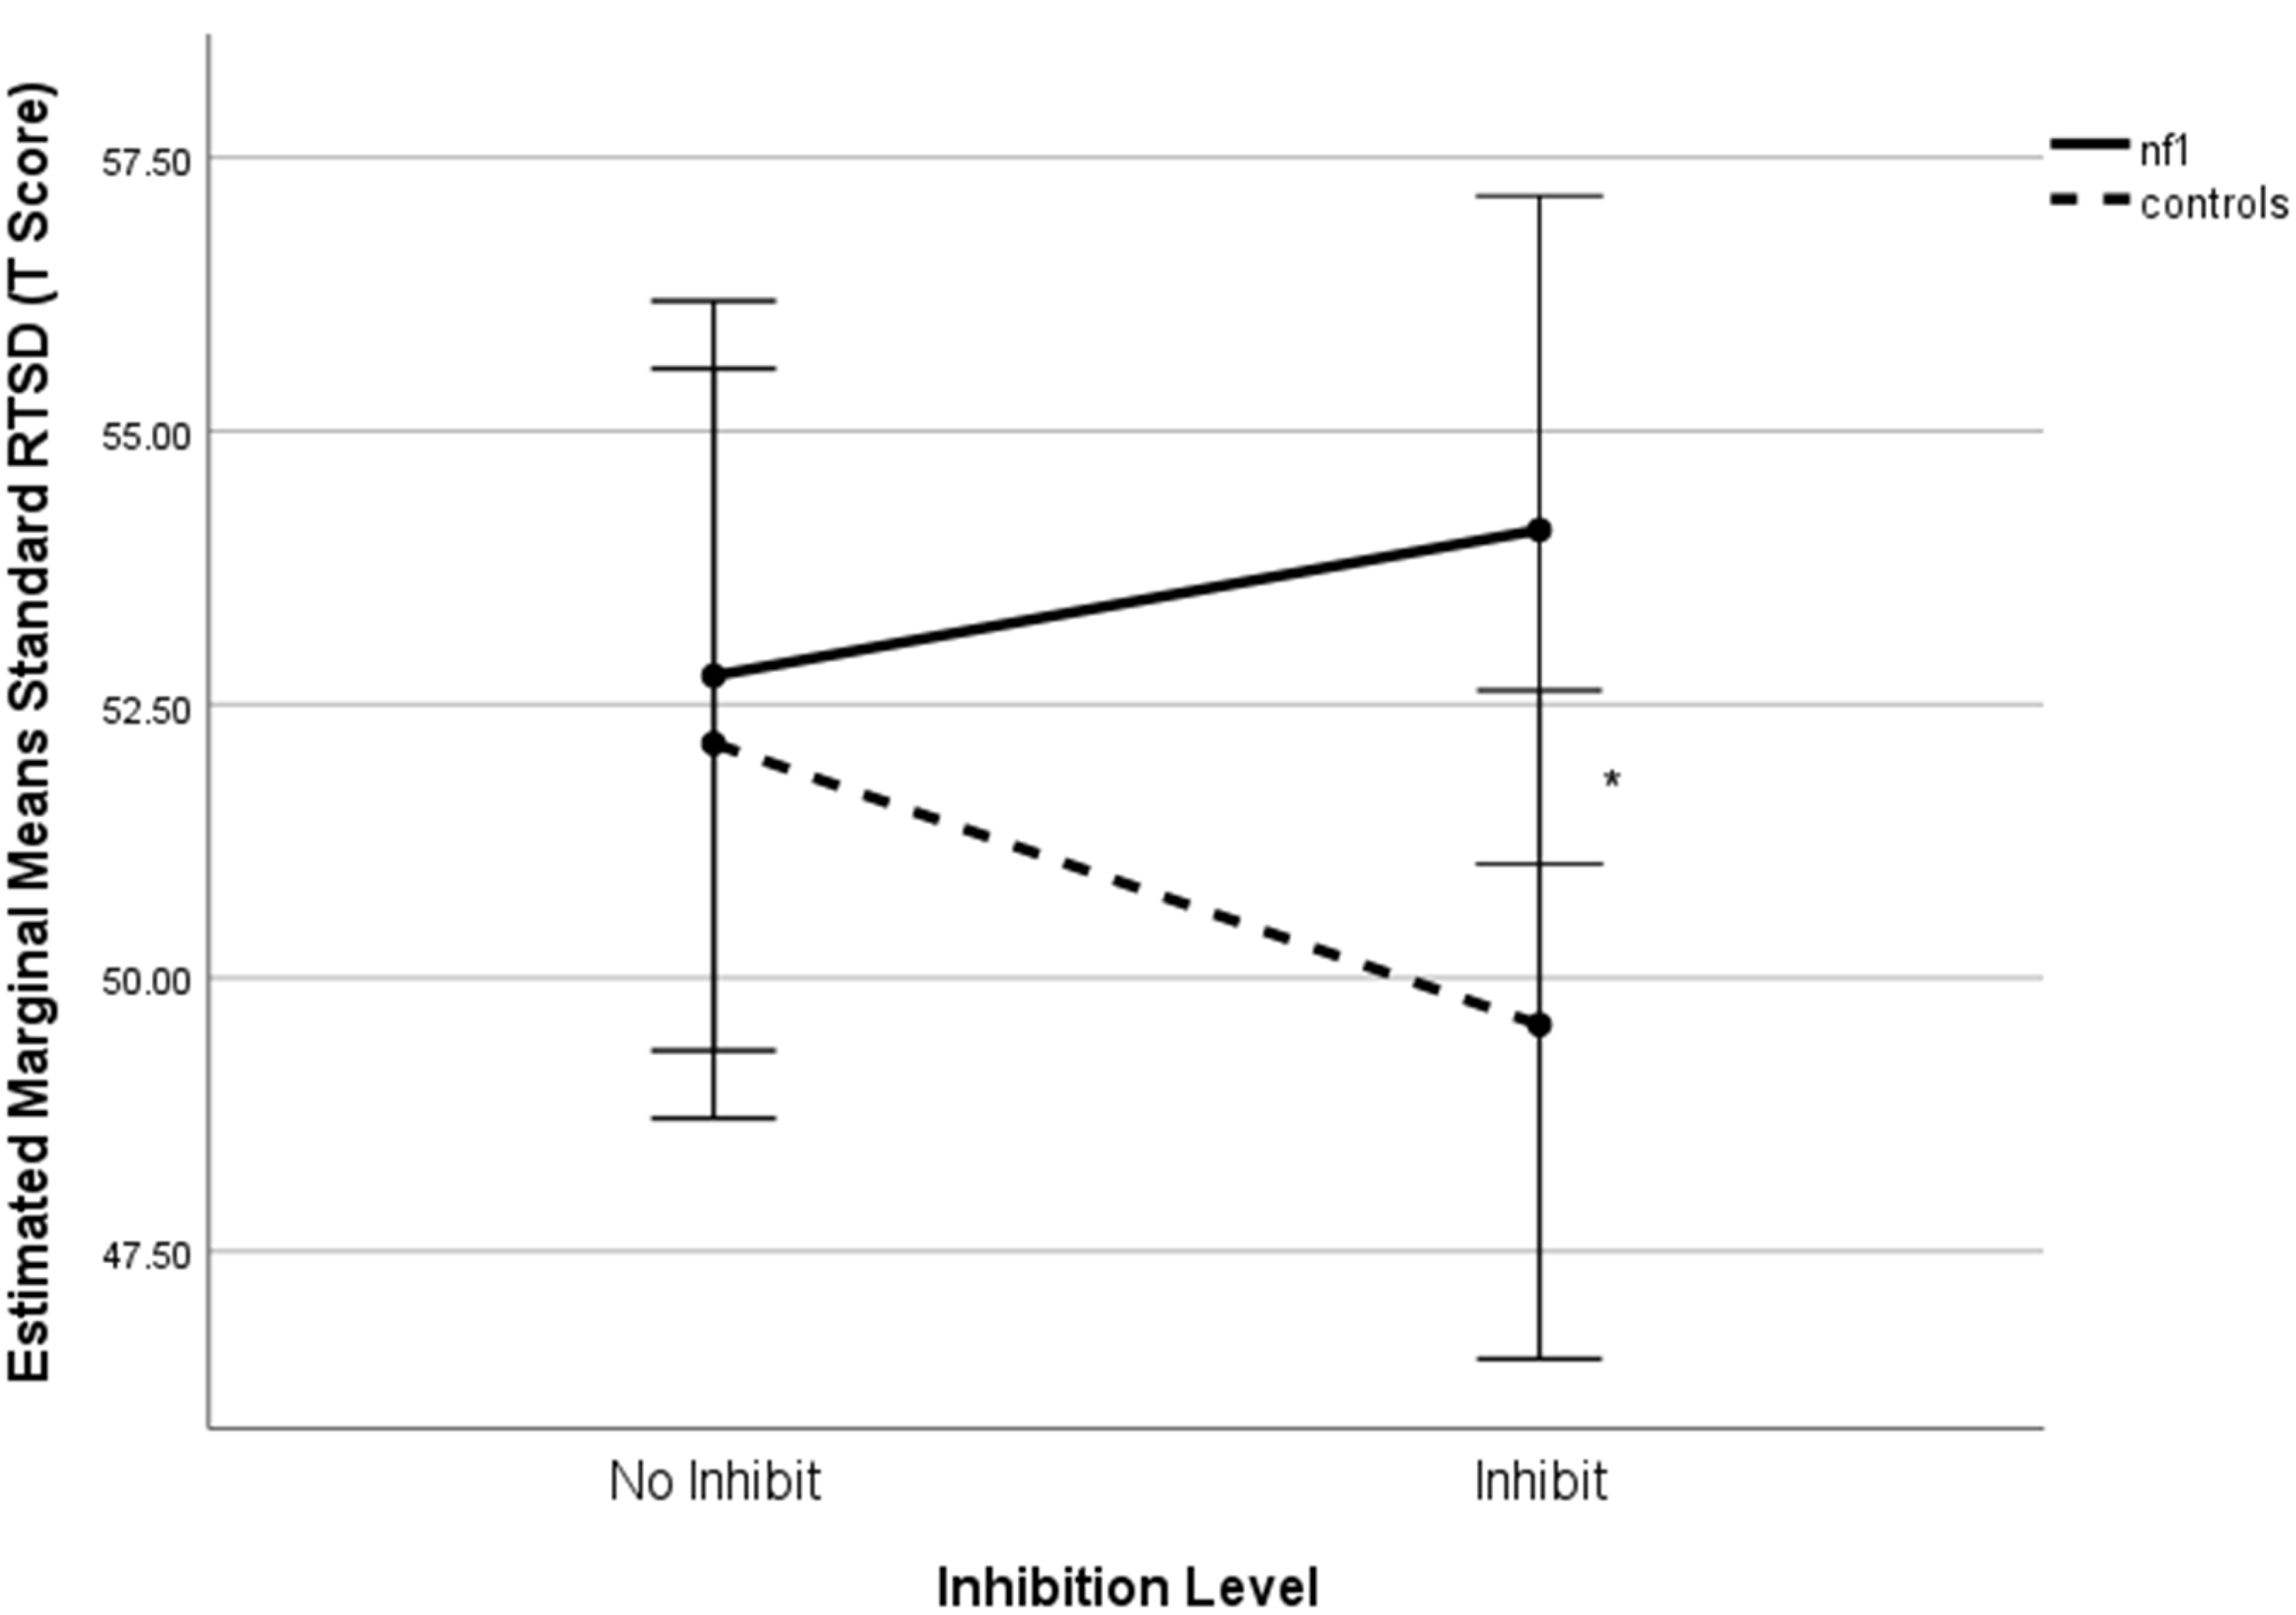
Inhibition × group interaction on standard response time standard deviation+. +Higher scores denote poorer performance. Note: *p < .05.

Interaction of working memory, inhibition, and group effects on response time (RT)

Note: Partial-Eta Squared (ηp 2 ) effect sizes are interpreted as follows: 0.01 = small, 0.06 = medium, >0.14 = large.
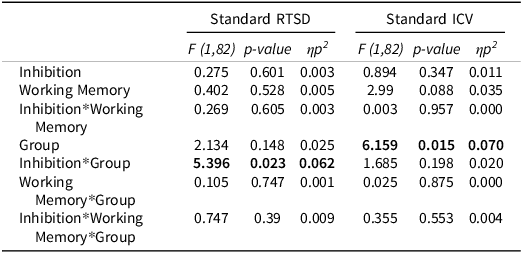
Interaction of working memory, inhibition, and group effects on standard response time variability

Note: Partial-Eta Squared (ηp 2 ) effect sizes are interpreted as follows: 0.01 = small, 0.06 = medium, >0.14 = large.
Supplementary univariate analyses
Analysis of working memory load effects on accuracy revealed a significant WM × group interaction (F(1,82) = 4.34, p = .040, η2 p = .050). NF1 participants performed significantly worse than controls under 1-back conditions (mean difference = 6.38, p = .004), whereas no significant difference was observed under 0-back conditions (p = .341). The main effect of group was also significant (F(1,82) = 5.27, p = .024, η2 p = .060), with NF1 participants showing worse performance compared to controls.
A univariate repeated- measures ANOVA focused on Target RT did not yield a significant inhibition × group interaction (F(1,82) = 2.30, p = .134, η2 p = .027). Pairwise comparisons showed no significant differences between NF1 and controls in RT under either inhibition or no-inhibition (all p > .40). This suggests that the multivariate interaction was not driven solely by RT performance.
Analysis of Response Time Standard Deviation (RTSD) revealed a significant inhibition × group interaction (F(1,82) = 4.81, p = .031, η2 p = .055). NF1 participants had significantly higher RTSD than controls under inhibition (mean difference = 4.52, p = .040), whereas no significant difference was observed under no-inhibition conditions (p = 800). The main effect of group was not significant (F(1,82) = 1.46, p = .231, η2 p = .017).
Simple effects and pairwise comparisons
A significant difference was found between the NF1 and control group on 1-Back Standard Response Accuracy with and without inhibition (F(1,82) = 8.602, p = .004, η2 = .095; F (1,82) = 8.692, p = .004, η2 = .096, respectively). There were no simple effects differences between the groups on 0-Back standard response accuracy (Figure 3). Regarding Target Response Time, there were no statistically significant differences between groups for either level of working memory (Figure 4). A statistically significant group difference was found for 0-Back Standard RTSD with inhibition (F(1,82) = 4.34, p = .040, η2 = .050), with no other significant simple effects (Figure 5). All relationships were in the direction of NF1 participants performing worse than controls.
Association with real-world executive dysfunction
A full examination of the association between performance on the TEC and real-world executive dysfunction was beyond the scope of this study. However, we did explore the relationship between performance on the TEC and parent-rated executive functioning on the BRIEF-2 for the participants with NF1. Our analysis showed a significant positive relationship between the BRIEF-2 Global Executive Composite (GEC) and the TEC Target Correct (r2 = .319, p = 0.39), Standard Correct (r2 = .348, p = .024), and Standard Intraindividual Coefficient of Variation (ICV) (r2 = .309, p = .046), supporting the clinical relevance of laboratory-based cognitive load effects. There was no significant relationship between the GEC and Commission Errors on the TEC (r2 = .101, p = .493).
Conclusions
This study demonstrates that children with NF1 experience unique and pronounced decrements in executive function performance in response to increased cognitive load compared to typically developing peers. Specifically, as working memory and inhibitory demands increase, children with NF1 show declines in accuracy, consistency, and efficiency, whereas controls maintain or improve their performance under similar conditions. These findings extend the previous work by Rowbotham et al. (Reference Rowbotham, Pit-ten Cate, Sonuga-Barke and Huijbregts2009), highlighting that increased cognitive load disproportionately impacts children with NF1.
The observed deficits in NF1 appear to be complex as the children with NF1 appear less able to flexibly adapt to increased inhibitory and working memory demands, as evidenced by slower and more inconsistent responses to infrequent stimuli under higher inhibitory load and poorer accuracy with higher working memory load (Beaussart et al., Reference Beaussart, Barbarot, Mauger and Roy2018; Smith et al., Reference Smith, Kaczorowski and Acosta2020). This aligns with prior reports of executive dysfunction in NF1 and supports cognitive load theory, which posits that working memory capacity is a bottleneck for learning and performance (Schnotz & Kürschner, Reference Schnotz and Kürschner2007; Sweller, Reference Sweller1988).
While typically developing children may benefit from increased cognitive load, children with NF1 are more likely to experience performance decrements, underscoring their vulnerability to cognitive load. This distinction highlights the need for tailored interventions that specifically address cognitive overload in NF1, as advocated in educational research applying cognitive load theory (Castro-Alonso et al., Reference Castro-Alonso, de Koning, Fiorella and Paas2021).
The significant associations between laboratory-based cognitive load effects and parent-reported executive dysfunction in NF1 provide preliminary evidence that these deficits may translate to everyday functioning. The underscores the clinical relevance of targeting working memory and inhibitory control in intervention for NF1 (Hardy et al., Reference Hardy, Berger, Griffin, Walsh, Sharkey, Weisman, Gioia, Packer and Acosta2021; Hou et al., Reference Hou, Wu, Allen, Toledo-Tamula, Martin, Gillespie, Goodwin, Widemann and Wolters2023).
The educational implications are substantial given the high incidence of learning problems in NF1 (Hyman et al., Reference Hyman, Arthur Shores and North2006; Torres et al., Reference Torres Nupan, Velez Van Meerbeke, López Cabra and Herrera Gomez2017). Working memory is strongly associated with academic achievement (Spiegel et al., Reference Spiegel, Goodrich, Morris, Osborne and Lonigan2021), and children with NF1 exhibit the most significant impairments and morbidity in this domain (Beaussart et al., Reference Beaussart, Barbarot, Mauger and Roy2018). These impairments are linked to deficits in reading, writing, and math (Hou et al., Reference Hou, Wu, Allen, Toledo-Tamula, Martin, Gillespie, Goodwin, Widemann and Wolters2023) and worsen with age (Hou et al., Reference Hou, Allen, Wolters, Toledo-Tamula, Martin, Baldwin, Reda, Gillespie, Goodwin and Widemann2020). Instructional techniques that minimize cognitive overload and promote self-directed strategies may be particularly useful for this population (Castro-Alonso et al., Reference Castro-Alonso, de Koning, Fiorella and Paas2021; Schnotz & Kürschner, Reference Schnotz and Kürschner2007).
Beyond academics, impaired response to cognitive load may also affect social functioning. Evidence from ADHD literature implicates working memory, impulsivity, and inconsistent focus as contributors to social difficulties (Kofler et al., Reference Kofler, Rapport, Bolden, Sarver, Raiker and Alderson2011; Kofler et al., Reference Kofler, Harmon, Aduen, Day, Austin, Spiegel, Irwin and Sarver2018). Given the high rates of ADHD, executive dysfunction, and social deficits in NF1, these impairments likely contribute to social challenges (Chisholm et al., Reference Chisholm, Anderson, Pride, Malarbi, North and Payne2018; Payne et al., Reference Payne, Walsh, Pride, Haebich, Maier, Chisholm, Glad, Casnar, Rouel, Lorenzo, Del Castillo, North and Klein-Tasman2020).
Limitations of this study include the lack of intellectual and EF data for the control group, modest and predominantly white sample, and cross-sectional design. Future research should evaluate the impact of cognitive load on daily life and academic functioning and explore physiological markers of cognitive load (Paas et al., Reference Paas, Tuovinen, Tabbers and Van Gerven2003). Interventions targeting working memory, such as Cogmed, show promise for improving deficits in NF1 (Hardy et al., Reference Hardy, Berger, Griffin, Walsh, Sharkey, Weisman, Gioia, Packer and Acosta2021), and combining these with broader EF strategies may further enhance learning and social development.
Acknowledgments
None.
Funding statement
Funding received from the Gilbert Family Foundation and District of Columbia Intellectual and Developmental Disabilities Research Center (DC-IDDRC) Award U54HD090257 by NICHD (PI: V. Gallo) supported this work.
Competing interests
None.


 Open access