

During the last decade, the prevalence of obesity has increased worldwide to epidemic proportions. Obesity is considered to be a major health problem, as it is associated with type 2 diabetes, CVD and certain cancers(Reference Haslam and James1). Efforts to understand the causes of obesity have focused on a positive energy balance that occurs when energy intake exceeds energy expenditure(Reference Hansen, Shriver and Schoeller2, Reference Curioni and Lourenco3). The observation of a rapid decline in sleep duration parallel to the rapid rise in body weight has drawn attention to sleep deprivation as another possible contributor to a positive energy balance and therefore sleep may be a factor in the aetiology of obesity(Reference Van Cauter and Knutson4–Reference Nielsen, Danielsen and Sorensen8).
Appetite regulation involves both tonic (long-term) and episodic (short-term) hunger and fullness signals. Tonic signals include leptin, which is secreted by adipose tissue, and insulin, which is secreted by the β cells in the pancreas. Episodic signals are triggered in response to the ingestion of food from the stomach (e.g. ghrelin) and intestines (e.g. glucagon-like peptide 1 (GLP-1)). Resistance to these hunger and satiating hormones results in overeating, leading to overweight and obesity(Reference Blundell, Levin and King9, Reference Adam and Westerterp-Plantenga10). Experimental sleep restriction has been shown to make an impact on many of these hormones. Spiegel et al. (Reference Spiegel, Tasali and Penev11) showed that a restriction of time in bed to 4 h compared to an extended bedtime of 10 h decreases leptin levels known to suppress appetite, and increases ghrelin levels that promote hunger. In addition, sleep restriction was associated with increased hunger and appetite, especially for energy-dense foods with high carbohydrate content(Reference Spiegel, Tasali and Penev11). Moreover, the change in the ratio of ghrelin:leptin between the two conditions was strongly correlated to the change in hunger rating(Reference Spiegel, Tasali and Penev11). Sleep restriction may also affect glucose and insulin metabolism. Sleep restriction to only 4 h of sleep reduced glucose tolerance relative to sleep recovery of 12 h of sleep(Reference Spiegel, Leproult and Van Cauter12) and reduced insulin sensitivity relative to normal sleep duration of 8·5 h of sleep(Reference Donga, van Dijk and van Dijk13). Even sleep restriction to 5·5 h of time in bed per night for 2 weeks(Reference Nedeltcheva, Kessler and Imperial14) or 5·0 h of time in bed for 1 week(Reference Buxton, Pavlova and Reid15) showed similar reductions on insulin sensitivity. These experimental studies that restricted the time available for sleep observed significant changes in hormones involved in appetite regulation in a direction that would increase food intake. Thus, the link between sleep and appetite may be the modulation of appetite-related hormones.
However, besides sleep duration, sleep disturbance can also affect sleep quality by changing the composition of sleep in terms of sleep stages. Human sleep is not a homogeneous state but is composed of rapid-eye movement (REM) sleep and non-REM sleep. The non-REM sleep can be further divided into four stages of progressively deeper sleep. Stages 3 and 4 of non-REM sleep are also named slow-wave sleep (SWS). Different relationships may exist between distinct sleep stages and body weight regulation(Reference Somers, Dyken and Mark16). For example, the initiation of SWS coincides with hormonal changes that affect glucose regulation. Tasali et al. (Reference Tasali, Leproult and Ehrmann17) showed that selective suppression of SWS, without affecting total sleep time (TST), increased the risk of type 2 diabetes. The design of the study by Tasali et al.(Reference Tasali, Leproult and Ehrmann17) was quite extreme, reducing SWS by nearly 90 %. However, more research is needed about the influence of sleep fragmentation, resulting in decreased sleep quality, on appetite control.
Therefore, the aim of the present study was to test the hypothesis that sleep fragmentation may lead to disturbed appetite control in a similar way as shorter sleep duration increases appetite. We thus examined the effect of sleep fragmentation, independent of sleep duration, on appetite profiles and 24 h profiles of hormones involved in energy balance regulation (glucose, insulin, ghrelin, leptin, GLP-1, melatonin and cortisol) in healthy men.
Subjects and methods
Subjects
A total of twelve healthy male subjects with a mean age of 23 (sd 4) years and with a mean BMI of 24·4 (sd 1·9) kg/m2 participated in the present study. They were recruited via advertisements on notice boards at Maastricht University. The subjects underwent an initial screening including measurements of body weight and height and completed a questionnaire related to health, use of medication, smoking behaviour, alcohol consumption, sleeping behaviour and food allergies. All subjects were in good health, non-smokers, not using medication and, at most, moderate alcohol consumers ( < 10 drinks a week). Baseline characteristics of the subjects are presented in Table 1. Body composition was measured using the 2H dilution technique(Reference Westerterp, Wouters and van Marken Lichtenbelt18, Reference Schoeller, van Santen and Peterson19).
Subject characteristics (Mean values and standard deviations, n 12)

BM, body mass; FFM, fat-free mass; FM, fat mass; %BF, percentage of body fat.
All procedures were carried out with adequate understanding and subjects provided written informed consent at the start of the first test day. Subject recruitment started in June 2009 and the study was conducted between September 2009 and May 2010. This study was conducted according to the guidelines laid down in the Declaration of Helsinki and all procedures involving human subjects were approved by the Medical Ethical Committee of Maastricht University Medical Centre. The study was registered in the Dutch Trial Register (registration number NTR1919). The power calculation of the present study was based on a sleep deprivation study(Reference Brondel, Romer and Nougues20). In the reference study, a crossover design with twelve subjects was performed and resulted in significant differences between 4 h of sleep compared to 8 h of sleep(Reference Brondel, Romer and Nougues20). The metabolic units, used in the present study, ensure a highly controlled situation in which subjects are in a stable environment.
Study design
Recently, Hursel et al. (Reference Hursel, Rutters and Gonnissen21) reported a respiration chamber study in which they determined the effects of sleep fragmentation on energy expenditure and substrate oxidation in fifteen healthy men. In a subgroup of these participants, we performed a separate experiment in a metabolic ward where regular blood sampling, also overnight, was possible. The data presented in the present paper are obtained from different nights compared to those reported in Hursel et al. (Reference Hursel, Rutters and Gonnissen21). The two experiments were separated by at least 1 week and the order was randomised across the subjects.
The study had a randomised, single-blinded, crossover design. Subjects participated in two 24 h metabolic unit experiments, separated by at least 1 week and at most 6 weeks; and 2 days before the experiment, subjects were asked to sleep for 8 h during the nights according to their habitual sleep duration (self-reported sleep duration, Table 1). During both phases, subjects arrived at the university at 18.00 hours and dinner was served at 18.30 hours. At 20.00 hours, electrodes for electroencephalogram, electromyogram and electrooculogram recordings were applied according to standardised criteria(Reference Rechtschaffen and Kales22). At 20.30 hours, a canula was placed into a dorsal hand vein of the contralateral arm. Blood samples, for the determination of glucose, insulin, ghrelin, leptin, GLP-1 and melatonin, were taken at baseline (21.00 hours) and continued hourly for the 24 h period. An experimenter entered the room to collect these blood samples, without disturbing the subjects. This was checked with the polysomnography data. Furthermore, saliva samples were collected every hour during the day (21.00–23.00 and 08.00–20.00 hours) to determine cortisol levels. The subjects were allowed to sleep from 23.30 to 07.30 hours (‘non-fragmented’ condition) or were woken up several times during the night (‘fragmented’ condition). Lights were switched off automatically at 23.30 hours and switched on at 07.30 hours, resulting in 8 h of sleep opportunity in a dark and quiet environment. The order of the two conditions was randomised across the subjects to prevent any order effects. Wake-up calls, varying in frequency between 500 and 2000 Hz and intensity between 40 and 110 dB, occurred approximately every 90 min. The subjects confirmed waking up since they had to put off the alarm, which took about 2 min. The alarm was near the bed so that subjects did not need to get up and the lights were kept off. The next day, standardised meals were served at 08.30, 13.30 and 18.30 hours. At 20.00 hours, the canula and the electrodes were removed. Artificial light intensity during the day (07.30–23.30 hours) was always above 400 lux (Energy Saver, Tornado E27, 900 lumen; Philips Lighting).
Sleep recordings
To ensure that sleep fragmentation was successful, polysomnographic recordings were obtained throughout the 24 h by using BrainRT (OSG BVBA). Sleep is recorded in occipital and central regions of the brain. Surface electrodes were used to record the electroencephalographic signals; two central (C3–A2 and C4–A1) and two occipital (O1–A2 and O2–A1), bilateral electrooculograms and submental electromyograms. All records were visually scored in 30-s epochs according to Rechtschaffen & Kales(Reference Rechtschaffen and Kales22) by the same experienced person blinded to the experimental condition. Sleep parameters of interest were REM sleep, SWS and TST. Sleep latency is defined as the time to fall asleep. Daytime naps were not allowed.
Energy intake
During their stay and 2 d before the experiment, subjects were fed in energy balance. The energy content of the food was tailored to the energy requirements of each subject by calculating BMR with the Harris & Benedict(Reference Harris and Benedict23) equation that uses sex, age, height and weight. To estimate the total energy requirement at home, the BMR was multiplied with a physical activity index of 1·75 estimated by means of a computer simulation program(Reference Westerterp, Donkers and Fredrix24). The total energy requirement in the metabolic unit was estimated by multiplying the BMR with a physical activity index of 1·35. Energy intake was divided over the meals as 20 % for breakfast, 40 % for lunch and 40 % for dinner. The macronutrient composition of the diet was 12/55/33 % of energy (protein/carbohydrate/fat). Participants were required to finish each meal and were not allowed to eat additional food. Water was freely available during the whole experiment.
Questionnaires
The appetite questionnaire was composed of visual analogue scale (VAS, in mm) questions on subjective feelings of hunger, fullness and desire to eat. Opposing extremes of each feeling were described at either end of a 100 mm horizontal line, and subjects marked the line to indicate how they felt at that moment. These questionnaires were completed every hour and before and after each meal.
Aspects of mood were assessed using the Dutch translation of the Profile of Mood States. This questionnaire contains seventy adjectives that are rated on a five-point scale, anchored by ‘much like this’ to ‘much unlike this’ and is divided into five categories (depression, tension, confusion, fatigue and anger). An increase in Profile of Mood States scores is associated with a worsening in mood(Reference Albrecht and Ewing25). Mood profiles were assessed before each meal.
Anxiety was assessed using the Dutch translation of the State-Trait Anxiety Inventory. This questionnaire is composed of twenty questions rated on a four-point scale, ranging from ‘much like this’ to ‘much unlike this’. An increase in State-Trait Anxiety Inventory scores is associated with an increase in anxiety(Reference Tenenbaum, Furst and Weingarten26). State anxiety was assessed every hour and before and after each meal.
Blood and saliva samples
Blood was distributed into EDTA tubes for glucose, insulin, leptin and active ghrelin measurements. For active GLP-1 measurement, blood was collected in EDTA tubes with added dipeptidyl peptidase IV inhibitor. Plasma was obtained by centrifugation at 4°C for 10 min at 3000 rpm. For melatonin measurement, blood was collected in clot tubes, containing ‘Silica Clot Activator’. Blood in the clot tubes was allowed to clot for 30 min and was centrifuged at 3000 rpm, 4°C for 10 min to obtain serum. All samples were stored at − 80°C until analysis. Plasma glucose concentrations were determined using the hexokinase method (Glucose HK 125 kit; ABX Diagnostics). Insulin and plasma active ghrelin concentrations were measured by RIA (Linco Research, Inc.). Plasma active GLP-1 samples were analysed using ELISA (EGLP-35K; Linco Research, Inc.). Plasma leptin concentrations were measured using the human leptin RIA-kit (Linco Research, Inc.). Serum melatonin concentrations were determined by RIA (IBL International GmbH).
To determine cortisol levels, saliva samples were collected using cotton swabs (Salivettes, Sarstedt). Subjects were instructed to gently chew on the swab for 1 min. Cotton swabs were then transferred to the plastic containers and stored at − 20°C until analysis. Salivary cortisol concentrations were measured at the laboratory of Professor Dr C. Kirschbaum, Dresden University of Technology, Germany. After thawing, saliva samples were centrifuged at 3000 rpm for 10 min. Luminescence immunoassay (IBL) with intra- and inter-assay precision of 2·5 and 4·7 %, respectively, was used to measure salivary cortisol concentrations.
Statistical analysis
Data are presented as means with their standard errors, unless otherwise indicated. AUC were calculated using the trapezoidal method. ANOVA with repeated measures was carried out to determine the conditional effects of fragmented v. non-fragmented sleep and the effects of time, on measurements of glucose, insulin, ghrelin, leptin, GLP-1, melatonin and cortisol levels. If relevant, differences between fragmented and non-fragmented sleep condition were analysed per time point. To assess the strength of the within-subject relationship between changes in VAS scores for fullness and GLP-1 concentrations, we calculated, separately for each subject, regression slopes and R 2 values for the regression of fullness scores on GLP-1 concentrations. We presented the mean and 95 % CI for the mean and interquartile ranges (Q1–Q3) of the observed slopes and R 2 values. Student's one-sample t tests were used to test whether the means of the regression slopes were different from zero. All tests were two-sided and the level for establishing significant differences was taken at P< 0·05. Data were analysed using SPSS 11 (SPSS, Inc.).
Results
Sleep
There were no significant differences between the non-fragmented and fragmented nights in sleep latency, time awake, TST and sleep stage 1 (Table 2). Subjects woke up approximately five times during the fragmented night. Although the amount of SWS was reduced in the fragmented night compared with the non-fragmented night, this difference was not statistically significant (Table 2). REM sleep was significantly shorter during the fragmented night compared with the non-fragmented night (P< 0·05, Table 2). Consequently, sleep stage 2 was significantly longer in the fragmented night compared with the non-fragmented night (P< 0·001, Table 2).
Sleep parameters during non-fragmented and fragmented nights (Mean values with their standard errors, n 12)

SWS, slow-wave sleep; REM, rapid-eye movement.
* Differences between non-fragmented and fragmented nights (ANOVA – repeated measures).
Glucose and insulin concentrations
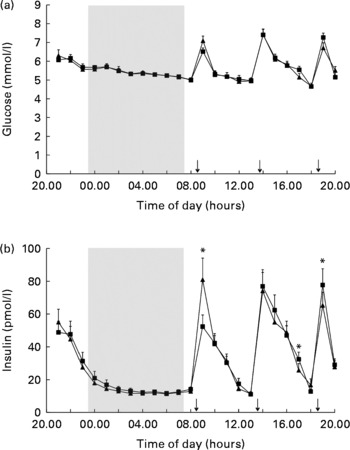
However, 24 h glucose concentrations did not differ between the fragmented sleep and non-fragmented sleep nights (Fig. 1(a), Table 3). There was an overall effect of time on glucose levels (P< 0·001).
Mean (a) glucose and (b) insulin concentrations in fragmented sleep (■) and non-fragmented sleep (▲) conditions (n 12). *P< 0·05 (analyses per time point). ANOVA (repeated measures) showed a significant time × condition effect (F= 4·9, P< 0·05). ↓ indicates meal times.
Blood and saliva parameters in the non-fragmented sleep and fragmented sleep conditions (Mean values with their standard errors, n 12)

GLP-1, glucagon-like peptide 1.
There was no overall effect of sleep fragmentation on 24 h insulin concentrations. Postprandial insulin secretion changed significantly differently after the fragmented v. non-fragmented sleep nights. Following fragmented sleep, the postprandial rise in insulin was significantly lower after breakfast and higher after dinner, while after non-fragmented sleep the postprandial rise in insulin was significantly higher after breakfast and lower after dinner (Fig. 1(b), time × condition effect, F= 4·9; P< 0·05). There was an overall effect of time on insulin levels (P< 0·001). Analysis per time point revealed that following a night of fragmented sleep, post-breakfast insulin concentrations were lower, while post-dinner insulin concentrations were higher compared with a night of non-fragmented sleep (Fig. 1(b), P< 0·05).
Ghrelin, leptin and melatonin concentrations
There were no significant differences in the 24 h ghrelin, leptin and melatonin concentrations between the fragmented sleep and non-fragmented sleep nights (AUC, respectively: 67 058 (sem 28 841) v. 73 173 (sem 8678) ng/l × min; 6426 (sem 1063) v. 5718 (sem 866) μg/l × min; 54 739 (sem 7855) v. 56 465 (sem 6486) ng/l × min, Table 3). There was an overall effect of time on ghrelin, leptin and melatonin concentrations (P< 0·001).
Glucagon-like peptide 1 concentrations and appetite profile
There was no overall effect of sleep fragmentation and no time × condition interaction effect on 24 h GLP-1 concentrations. GLP-1 concentrations were different over time (P< 0·001). Since previous studies(Reference Brondel, Romer and Nougues20, Reference Nedeltcheva, Kilkus and Imperial27) showed an increased food intake and snacking during the afternoon or evening, we performed a closer inspection of the GLP-1 data from the afternoon. Analyses of AUC during the afternoon and per time point revealed that following a night of fragmented sleep, GLP-1 concentrations were significantly lower in the afternoon (Fig. 2(a) and (b); P< 0·05) than after a night of non-fragmented sleep.
Mean glucagon-like peptide 1 (GLP-1) concentrations in fragmented sleep (■) and non-fragmented sleep (▲) conditions (n 12). Data are presented in lines (a) and bars (b, AUC from 14.00 to 20.00 hours). Mean visual analogue scale (VAS) fullness scores (c) in fragmented sleep (■) and non-fragmented sleep (▲) conditions (n 12). *P< 0·05 (analyses per time point). ↓ indicates meal times.
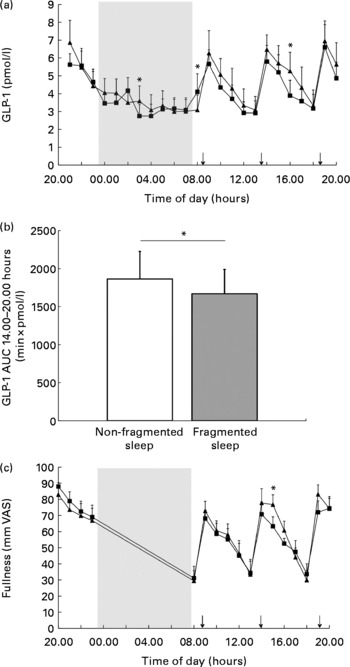
In addition, there was also an effect of time on fullness and desire-to-eat ratings (P< 0·001). Analysis per time point revealed that in the afternoon following a night of fragmented sleep, subjects were less full (Fig. 2(c); P< 0·05) than after a night of non-fragmented sleep. After dinner, desire-to-eat ratings were significantly higher during the fragmented sleep condition than during the non-fragmented sleep condition (24·6 (sem 8·3) v. 14·9 (sem 6·6) mm VAS; P< 0·05).
In both the non-fragmented sleep and fragmented sleep conditions, GLP-1 concentrations changed synchronously with VAS fullness scores (Fig. 3). The regression slopes and R 2 values were significantly higher in the non-fragmented sleep condition (Table 4).
Mean glucagon-like peptide 1 (GLP-1) concentrations (black lines) and Visual Analogue Scale (VAS) fullness scores (grey lines) in non-fragmented sleep (a, ▲) and fragmented sleep (b, ■) conditions (n 12).

Observed slopes and R 2 values for the within-subject relationships between visual analogue scale fullness scores and glucagon-like peptide 1 concentrations in the non-fragmented sleep and fragmented sleep conditions (Mean values with their standard errors; 95 % confidence intervals and interquartile ranges (IQR), n 12)

* Means of the regression slopes were significantly different from zero (P< 0·0001, Student's one-sample t test).
† Differences between non-fragmented sleep and fragmented sleep nights (ANOVA – repeated measures).
Cortisol concentrations and mood state
With respect to stress-related parameters, there was a time × condition interaction effect on cortisol concentrations (P< 0·01, F= 2·26), peak values were higher in the morning following a night of non-fragmented sleep, whereas evening cortisol levels remained higher following a night of fragmented sleep (Fig. 4). Cortisol concentrations were different over time (P< 0·001, Fig. 4). Analysis per time point revealed that cortisol concentrations were significantly lower in the morning after the fragmented sleep night than after the non-fragmented sleep night (Fig. 4, P< 0·01). In the evening, cortisol concentrations were significantly higher in the fragmented sleep condition compared with the non-fragmented sleep condition (Fig. 4, P< 0·05).
Mean cortisol concentrations in fragmented sleep (■) and non-fragmented sleep (▲) conditions (n 12). *P< 0·05 (analyses per time point). ANOVA (repeated measures) showed a significant time × condition effect (F= 2·26, P< 0·01). ↓ indicates meal times.

There was an overall time effect (P< 0·05) and a time × condition interaction effect (P< 0·05, F= 5·0) on the Profile of Mood States scores for the category ‘fatigue’. The morning after a night of fragmented sleep, Profile of Mood States scores for ‘fatigue’ were significantly higher than after a night of non-fragmented sleep (24·7 (sem 1·3) v. 20·5 (sem 1·4); P< 0·05).
There were no significant differences in the State-Trait Anxiety Inventory scores between the fragmented sleep and non-fragmented sleep nights (AUC: 21 604 (sem 1202) v. 19 534 (sem 877)).
Discussion
In the present study, sleep fragmentation resulted in the preservation of SWS and substitution of REM sleep with sleep stage 2 without changes in TST and time awake. Sleep fragmentation occurred less frequently compared to Hursel et al. (Reference Hursel, Rutters and Gonnissen21) (five v. seven times), which explains why the alterations in sleep parameters were less pronounced in this study compared to the previous study. Both studies show a reduction in SWS and REM sleep, which are regarded as the restorative parts of sleep and the sleep parameters related to health. However, in the present study, the reduction in SWS did not reach significance. Although there were no significant differences in time awake, sleep stage 1 and SWS in our present study, we were able to show an effect of altering the amount of REM sleep without changing TST, thereby enabling us to investigate the effect of sleep quality.
Our results show that a night of fragmented sleep is accompanied by a change in the pattern of postprandial insulin secretion over the day without changes in glucose secretion. Several studies have already indicated that sleep restriction in healthy subjects induces a reduction in insulin sensitivity(Reference Donga, van Dijk and van Dijk13–Reference Buxton, Pavlova and Reid15). In addition, sleep fragmentation across all stages was associated with a decrease in insulin sensitivity(Reference Stamatakis and Punjabi28). Tasali et al. (Reference Tasali, Leproult and Ehrmann17) even showed that selective suppression of SWS could worsen the reduced insulin secretion in normal people. The present study shows significant differences in insulin release only on two specific time points; therefore, the evidence is too limited to draw a firm conclusion about insulin sensitivity from these data. Surprisingly, analysis of insulin secretion per time point revealed that following a night of fragmented sleep, insulin concentrations were less increased after breakfast. Although non-significant, also glucose concentrations after breakfast were slightly lower following a night of fragmented sleep than following a night of non-fragmented sleep. We speculate that more glycogen has been used during the fragmented night due to higher activity-induced energy expenditure during the night for putting off the alarm(Reference Hursel, Rutters and Gonnissen21, Reference Kuipers, Keizer and Brouns29, Reference Schrauwen, van Marken Lichtenbelt and Saris30). The overall effect of time on glucose concentrations is caused by its meal-related secretion pattern. Glucose concentrations were low before each meal and peaked after each meal.
The higher insulin secretion in the afternoon after fragmented sleep may imply that a vulnerable condition appears in the afternoon. Previous studies(Reference Brondel, Romer and Nougues20, Reference Nedeltcheva, Kilkus and Imperial27, Reference Bosy-Westphal, Hinrichs and Jauch-Chara31–Reference St-Onge, Roberts and Chen33) showed indeed an increased food intake and an increased intake of energy from snacks after partial sleep deprivation. In relation to appetite, GLP-1 concentrations and fullness scores were decreased in the afternoon following a night of fragmented sleep. The overall effect of time on GLP-1 concentrations is caused by its meal-related secretion pattern. GLP-1 concentrations were low before each meal and peaked after each meal. In agreement with previous studies(Reference Blundell, Levin and King9, Reference Lemmens, Martens and Kester34) GLP-1 concentrations changed synchronously with VAS fullness scores. However, the present study shows that the correlation between GLP-1 concentrations and VAS fullness scores decreases after fragmented sleep. After dinner, the appetite effect continued by showing a larger desire to eat. So, it seems that a vulnerable condition following sleep fragmentation occurs in the afternoon. During the 48 h respiration chamber experiment with the same subjects, we observed an increase in carbohydrate oxidation when sleep was fragmented(Reference Hursel, Rutters and Gonnissen21). In addition, Nedeltcheva et al. (Reference Nedeltcheva, Kilkus and Imperial35) reported that the respiratory quotient was increased for short sleepers, which implies less fat oxidation and more carbohydrate oxidation. We speculate that these results may indicate a glycogen depletion that leads to hypoglycaemia and thereby may underscore a vulnerable condition leading to increased food intake and snack consumption.
Both epidemiological and experimental observations of lower leptin and higher ghrelin concentrations during the day with short sleep duration(Reference Taheri, Lin and Austin36, Reference Chaput, Despres and Bouchard37) have led to the hypothesis that sleep deprivation may affect energy balance through such hormone changes. The lack of changes in ghrelin and leptin during the day after a night of fragmented sleep in our study may be explained by our experimental design investigating the effect of short-term sleep fragmentation independent of sleep duration. The overall effect of time on leptin and melatonin concentrations is caused by their circadian secretion pattern, while the overall effect of time on ghrelin concentrations is due to its meal-related secretion pattern. Leptin and melatonin concentrations increased during the night and decreased during the day. Ghrelin concentrations peaked before each meal and decreased immediately after each meal.
Because sleep fragmentation may affect several neuroendocrine signals involved in the control of substrate utilisation, we also examined cortisol concentrations. The sharp morning rise and the steep fall to low evening levels are two characteristic features of the human daily cortisol rhythm. Other studies(Reference Omisade, Buxton and Rusak38, Reference Leproult, Copinschi and Buxton39) have previously demonstrated that both morning and evening cortisol levels are modulated by even a single night of reduced sleep. Corresponding with these studies, the present results indicate that after a single night of fragmented sleep, cortisol levels were significantly reduced after awakening and were elevated in the evening.
The strengths of our study included the standardised protocol with detailed sleep scoring using polysomnography. Subjects were fed in energy balance 2 d before and during the experiment. Moreover, blood samples were taken every hour for 24 h. In addition, a refinement that our study shows is in connecting the glucose metabolism and appetite-related parameters to the different sleep stages. This suggests that TST is not primarily indicative of sleep quality, which consists of REM sleep and SWS. Thus, affecting TST, such as previous studies have demonstrated, may affect glucose metabolism and appetite-related parameters since sleep quality will be reduced. Our observation on reduced sleep quality is based upon reduced REM sleep while SWS is preserved. Tasali et al. (Reference Tasali, Leproult and Ehrmann17) showed that the suppression of SWS adversely affected glucose homeostasis. However, assessing SWS suppression and SWS recovery only partly explains the effect of sleep quality on glucose metabolism because sleep restriction also results in a reduction of REM sleep(Reference Banks and Dinges40, Reference Van Dongen, Maislin and Mullington41). A possible limitation of the present study is the mild sleep fragmentation, in contrast to studies examining the effect of sleep restriction and sleep recovery. However, mild sleep fragmentation is more likely to occur in everyday life with its street noise and cell phones that are not switched off during the night. Our study indicates that even mild sleep fragmentation during a single night may contribute to a vulnerable condition in the afternoon, accompanied by increased insulin secretion, lower GLP-1 concentrations and diminished fullness. Another limitation might be that the acute effects from this study cannot be extrapolated to chronic effects since adaptations might occur. Therefore, more research over the long term is necessary to establish the initial observations. Finally, there was the instance of an experimenter entering the room softly to take blood samples. We had anticipated that this might be a limitation, but we decided to use this procedure because of safety concerns. Therefore, after each night it was checked whether this procedure disturbed the sleep pattern, and no acute changes in sleep phases coincided with entering the room. In addition, this procedure occurred in both conditions and only the night with fragmented sleep showed a reduction of REM sleep.
In the present study, sleep fragmentation led to reduced sleep quality by reducing the amount of REM sleep. Several studies(Reference Theorell-Haglow, Berne and Janson42–Reference Liu, Forbes and Ryan44) suggest that REM sleep may have a role in metabolism and obesity. A population-based study found an association between reduced amount of REM sleep and central obesity in women(Reference Theorell-Haglow, Berne and Janson42), while a cross-sectional study indicated that reduced REM sleep time was associated with elevated BMI in children and adolescents(Reference Liu, Forbes and Ryan44). The significant association between reduced REM sleep and overweight suggests that REM sleep loss may alter the balance of energy intake and energy expenditure. It has been shown that sleeping metabolic rate is significantly higher in REM sleep(Reference Fontvieille, Rising and Spraul45) and diminished sleeping metabolic rate is again associated with elevated BMI(Reference Zhang, Sun and Werner46). Moreover, the present study shows that also endocrine changes are sensitive to reduced REM sleep. Increased insulin concentrations and decreased GLP-1 concentrations in the afternoon due to REM sleep loss decreased fullness scores, which in turn could lead to increased food intake and snacking if subjects had been allowed ad libitum food intake. In addition to an increase in total energy intake, the proportional intake of specific macronutrients, such as carbohydrates or fat, could have increased. It has been already shown that sleep restriction increased the appetite for energy-dense nutrients with high carbohydrate content, including sweets, salty snacks and starchy foods(Reference Spiegel, Tasali and Penev11). In addition, Nedeltcheva et al. (Reference Nedeltcheva, Kilkus and Imperial27) found that bedtime restriction was associated with increased consumption of energy from snacks with higher carbohydrate content. While in another study, six nights of 4 h in bed was associated with more energy consumption, mostly due to increased fat consumption(Reference St-Onge, Roberts and Chen33). Beside the homeostatic system, also the hedonic system plays a role in food intake regulation. Previous animal studies showed that REM sleep deprivation produced a decline in motivation for food reward(Reference Hanlon, Andrzejewski and Harder47). So, also in humans, reduced REM sleep could lead to a decrease in the reward values of food which may shift food choice to higher reward and higher energy foods and thereby contributing to a positive energy balance. Moreover, Van Cauter et al. (Reference Van Cauter, Leproult and Plat48) observed an inverse relationship between nadir cortisol levels and REM sleep. Thus, the elevation of the evening cortisol levels in the fragmented sleep condition of this study may be due to the decreased amount of REM sleep during the fragmented sleep. Raised cortisol concentrations in the evening are thought to reflect an impairment of the negative-feedback control of the hypothalamo–pituitary–adrenal axis that has been related to obesity(Reference Bjorntorp49). Earlier studies using extreme forms of sleep deprivation may reflect the effect of decreases in the subject-specific amount of SWS and REM sleep, thereby implying a reduction in sleep quality. Therefore, they cannot distinguish between the effect of reduction of TST or of reduction of sleep quality. In our study, we reduced sleep quality without reducing TST and report that reduced sleep quality already affects insulin, GLP-1, cortisol concentrations and fullness scores. Therefore, we suggest that the quality of sleep is more important than the duration of sleep. This also may explain why not all people who sleep less than 6 h are overweight/obese, as they may have a sufficient amount of REM sleep.
In summary, a single night of fragmented sleep, resulting in reduced REM sleep, induced a shift in insulin concentrations; from being lower in the morning and higher in the afternoon while GLP-1 concentrations and fullness scores were decreased. Together, these results may create a vulnerable condition in the afternoon, which could lead to increased food intake and snacking, thus contributing to a positive energy balance.
Acknowledgements
The authors' responsibilities relating to the present study were as follows: H. K. J. G., R. H., F. R. and M. S. W.-P. designed the study; H. K. J. G., R. H., F. R. and E. A. P. M. conducted research and analysed the data; H. K. J. G. wrote the manuscript; and M. S. W.-P. supervised the execution of the study and reviewed the manuscript. None of the authors had a personal or financial conflict of interest, or any other conflict of interest that could be perceived as prejudicing the impartiality of the research reported. This research did not receive any specific grant or funding from any organisation in the public, commercial or not-for-profit sector.


