


Introduction
A detailed understanding of the interaction of particles with various films has received significant interest over the past few decades [Reference Mittal1, Reference Freitas and Sharma2, Reference Gong, Wang and Ngai3, Reference Ranade4]. In particular, in chemical mechanical planarization (CMP) applications, the interaction of ceria particles with SiO2 films has been extensively studied to understand the influence of slurry chemistry, interaction force and particle adsorption on SiO2 films and particle removal during polishing and cleaning, respectively [Reference Seo, Gowda and Babu5,Reference Seo, Lee, Moon, Sigmund and Paik6,Reference Abiade, Choi and Singh7,Reference Korkmaz, Vahdat, Trotsenko, Minko and Babu8]. Many studies have demonstrated that atomic force microscopy (AFM) and the quartz crystal microbalance-dissipation (QCM-D) can be used to investigate the particle–surface interaction forces and the adsorbed amount, respectively [Reference Korkmaz, Vahdat, Trotsenko, Minko and Babu8,Reference Ong and Sokolov9,Reference Borujeny, Miao, Pirayesh, Xu and Cadien10,Reference Liu, Chen and Su11]. AFM colloidal probe technique has been widely used to measure directly the interactions between ceria particles and surfaces. However, the interaction forces can be influenced by the external forces applied to keep the particles attached (glued) to the AFM cantilever. Similarly, while QCM-D is useful for monitoring the real-time adsorption/desorption behavior of particles on surfaces (i.e., adsorption/desorption rates and their amounts), it provides limited information on the movements of particles on the surface and their interaction energies.
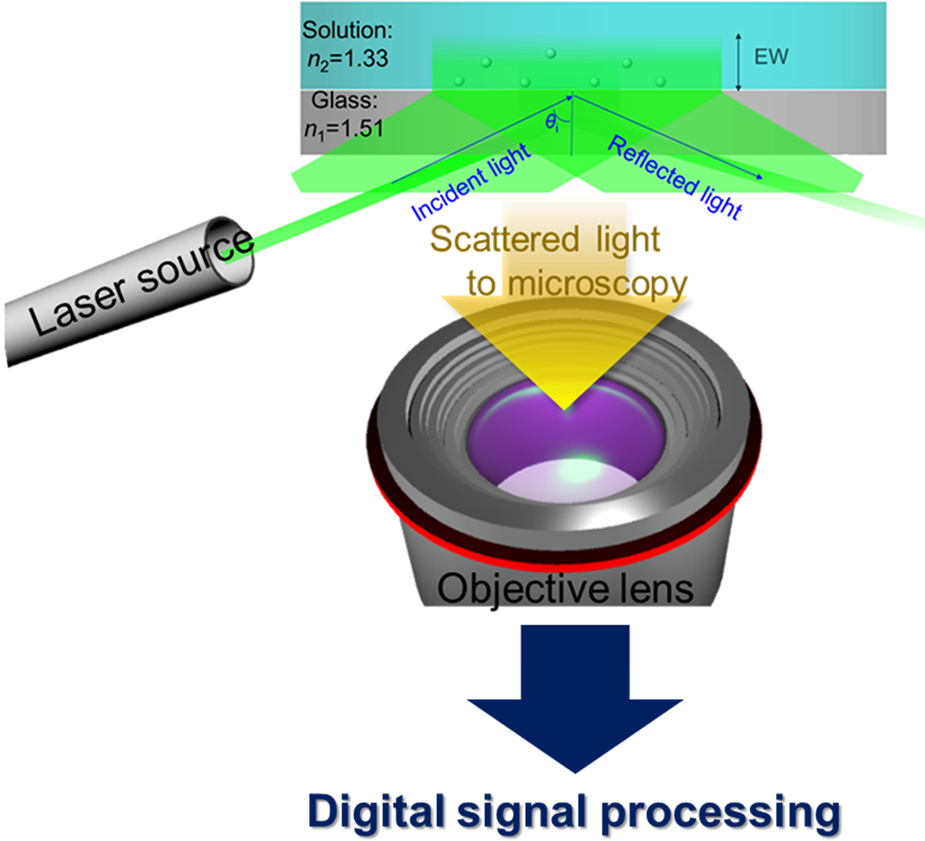
We recently reported that evanescent wave (EW) microscopy, also known as total internal reflection microscopy (TIRM), is a powerful tool to directly measure interactions between ceria particles (d mean ~140 nm) and glass surfaces [Reference Seo, Gowda, Khajornrungruang, Hamada, Song and Babu12]. Our home-built EW microscopy setup and a schematic of the acquired data and analysis are shown in Fig. 1. The EW was generated by the total internal reflection (TIR) of green laser light at the ceria suspension/glass interface. In all our experiments, the flat glass surface of the hemispherical lens shown in Fig. 1 became our model for the SiO2 film surface. The details of the EW microscopy system and the measurement conditions were described earlier [Reference Seo, Gowda, Khajornrungruang, Hamada, Song and Babu12] and and are also summarized later in the Experimental section of this paper.
Schematic of our home-built EW microscopy setup (modified from Ref. [Reference Seo, Gowda, Khajornrungruang, Hamada, Song and Babu12] with permission from the Journal of Materials Research). Processing of incoming data in real time with digital signal processing was reported previously [Reference Seo, Gowda, Khajornrungruang, Hamada, Song and Babu12,Reference Pal, Khajornrungruang, Netzband, Alety and Babu13,Reference Khajornrungruang, Korkmaz, Angshuman, Suzuki, Kimura and Babu14]; see the Experimental section for details.
Earlier, the in situ trajectories, diffusion, and interaction energies of several single ceria particles and, in some cases, their agglomerates near a glass surface in 2D (x–y) plane were obtained without the application of any external forces [Reference Seo, Gowda, Khajornrungruang, Hamada, Song and Babu12]. Although this provides useful information on the particle dynamics near a glass surface [Reference Seo, Gowda, Khajornrungruang, Hamada, Song and Babu12], the real space is three dimensional. Thus, a 3D trajectory analysis can provide more reliable information on the interactions of ceria particles with a glass surface, including adsorption and their removal near a glass surface. In this paper, by combining the data on the distance of the particles from the glass surface in the z-direction (height, h) with 2D data, we obtain 3D trajectories of ceria particles near the glass surface at pH 3, 5, and 7. Three-dimensional diffusion coefficients (D 3D) were then obtained from the calculated mean square displacement (MSD3D) (see the details in the section "3D trajectory analysis") and were compared with D 2D values obtained in our previous paper [Reference Seo, Gowda, Khajornrungruang, Hamada, Song and Babu12]. 3D trajectories and D 3D values of the ceria particles depend on the type and characteristics of particle motion and are influenced by pH values.
While many studies have exploited EW microscopy to study particle interactions with various surfaces, very few studies have used EW microscopy to investigate the removal of ceria particles from surfaces [Reference Hanai, Sanada, Fukunaga and Hiyama15,Reference Terayama, Khajornrungruang, Suzuki, Kusatsu, Hamada, Wada and Hiyama16]. Here, we show that this technique also enables the monitoring of the removal of ceria particles from a glass surface in real time. The resulting data are of interest for the post-CMP cleaning of ceria particles from SiO2 film surfaces.
Results and Discussion
3D trajectory analysis of a single ceria particle with confined motion near a glass surface
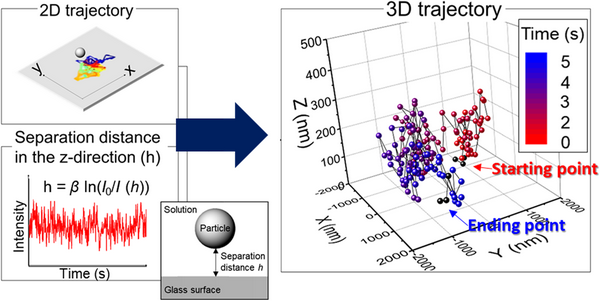
We demonstrate here an expeditious method for obtaining 3D trajectories of single ceria particles at three different pH values using data obtained from EW microscopy coupled with video imaging (Fig. 2). Positions (i.e., centroids) of single ceria particles near a glass surface in each frame were identified from local maxima in their EW scattering intensity fitted to a Gaussian function using the particle tracking software [Reference Vallotton, Van Oijen, Whitchurch, Gelfand, Yeo, Tsiavaliaris, Heinrich, Dultz, Weis and Grünwald17]. 2D trajectories of a single ceria particle were obtained by linking its time-sequenced positions (upper figure in Fig. 2). The distance of the particle from the glass surface in the z-direction (height, h) can be obtained using the Beer–Lambert relation between h and the EW intensity (lower figure in Fig. 2), h(I) = β ln(I 0/I) [Reference Prieve18,Reference Prieve and Walz19], where β (88.0 ± 4.5 nm) is the penetration depth of the laser beam, I is the EW scattering intensity of the ceria particle, and I 0 is the maximum intensity obtained at the particle/surface interface [Reference Prieve18]. EW intensity is maximum at the glass surface and decays exponentially with the distance h according to I(h) = I 0 exp(–β−1h) [Reference Prieve18,Reference Prieve and Walz19]. The penetration depth β is defined as the distance from the glass surface where EW intensity decays to 1/e or ~37% of I 0 [Reference Prieve18,Reference Prieve and Walz19]. It should be noted that the imaging depth is not limited to the penetration depth and particles located beyond the EW penetration depth from the glass surface can also be imaged [Reference Prieve and Walz19,Reference Liu, Woolf, Rodriguez and Capasso20,Reference McKee, Clark, Walz and Ducker21,Reference Hertlein, Riefler, Eremina, Wriedt, Eremin, Helden and Bechinger22,Reference Gell, Berndt, Enderlein and Diez23]. For example, Prieve and Walz reported smaller than 400 nm separation distance using a 7 μm polystyrene sphere with a penetration depth of 197 nm [Reference Prieve and Walz19]. McKee et al. calibrated the relationship between EW intensity and particle–surface distance and showed that the effective range of separation distance using a 1.2 μm glass particle and a penetration depth of 66.8 nm was about three times the penetration depth [Reference McKee, Clark, Walz and Ducker21]. The separation distances h of ceria particles near a glass surface, obtained from the intensity data in our paper, are less than ~3 times the penetration depth and thus can be used as the distance h for their 3D positions. 3D positions of the particles were determined by combining 2D positions with the associated separation distance h in each frame, and then linking them to generate 3D trajectories (Fig. 2).
Trajectory of a single ceria particle near a glass surface in 2D (x–y) plane (upper figure where each colored track shows the particle's movement between two different frames). EW intensity of a single particle versus time data is shown in the lower figure. The 3D trajectory of a single ceria particle was obtained by combining the 2D (x–y) data with the separation distance h (see the next section for details). The first and last three points of the 3D trajectory were marked as black dots to determine the beginning and the end of the particle movement.

50 μL of a dilute ceria suspension was placed on the flat surface of the glass lens and imaged in situ using EW microscopy for 20 s. The number of ceria particles on the glass surface, obtained from EW microscopy images and videos, is ~2950 at pH 3, ~1530 at pH 5, and ~427 at pH 7 in the imaged area of 77 × 77 μm2, corresponding to ~0.5, ~0.3, and ~0.1 particles/μm2, respectively. Thus, the concentrations of the ceria particles on the glass surface are sufficiently low, so that particle–particle interactions are negligible. Indeed, to minimize the effect of particle–particle interactions in our analysis, only particles that were more than 10 particle diameters apart from neighboring particles were monitored. For trajectory analysis, three different single ceria particles each at three different pH values were monitored as representative samples. Figure 3 shows representative 3D and 2D trajectories of one of these three ceria particles, tracked for 500 frames over a total time of 20 s, at pH 3, 5, and 7. These data were obtained from separate experiments performed at each pH value and combined into a single figure. In Fig. 3, the time evolution of these positions can be visualized from the color scheme that changes gradually from red initially (t = 0) to blue at t = 20 s.
3D trajectories of three different single ceria particles near a glass surface at pH 3, 5, and 7. These data were obtained from individual experiments performed at three different pH values and combined into a single figure.
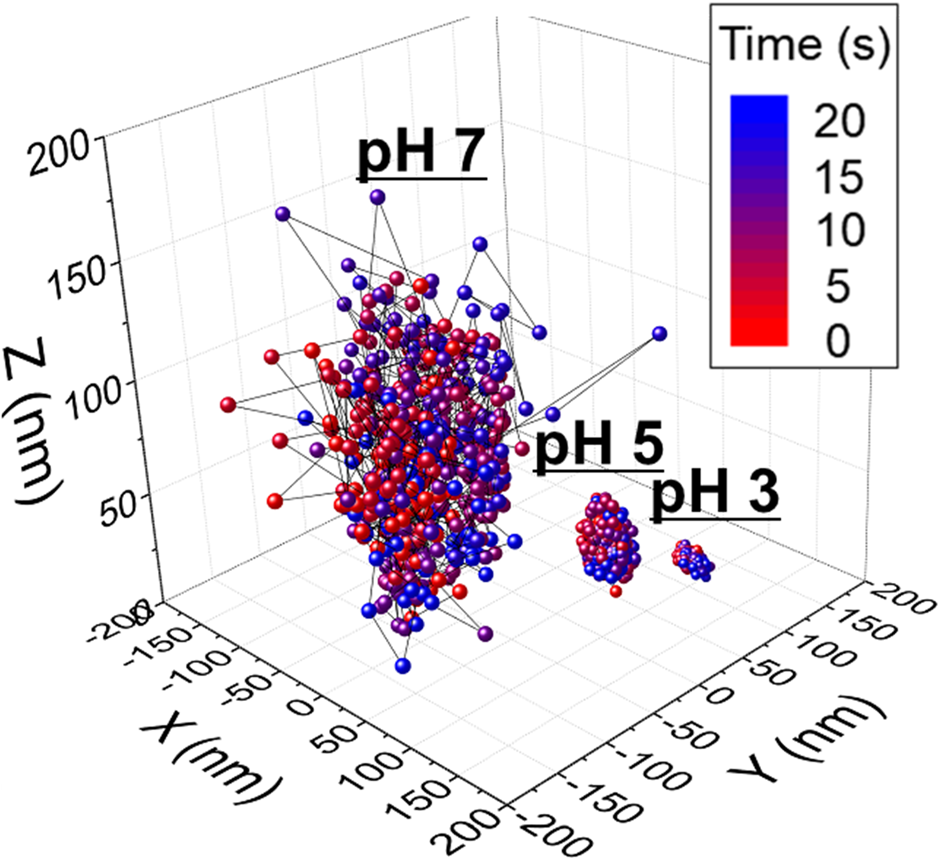
The movements of single ceria particles at pH 3 and 5 are confined to a relatively small area of 15 × 15 nm2 and 30 × 30 nm2, respectively, due to strong attractive electrostatic and van der Waals forces (zeta-potentials of ceria particle at pH 3 and 5 are 70 and 50 mV, respectively, and that of SiO2 film is −20.0 mV) [Reference Seo, Gowda, Khajornrungruang, Hamada, Song and Babu12]. The isoelectric point (pHIEP) of the glass (SiO2) film is 2.0, resulting in a negatively charged glass surface in the pH range we are interested in. The vertical separation distance h, obtained from the intensity data, showed that the particles were also confined in the z-direction over a height of about 15 and 45 nm at pH 3 and 5, respectively. By contrast, the movements of single ceria particles near the glass surface at pH 7, though still confined, covered an area of 300 × 300 nm2 and a vertical distance along a z-axis of 150 nm, presumably due to the consequence of the weaker attractive forces between the ceria particle and the glass surface (zeta-potential of ceria particle at pH 7 is close to 0 mV and that of SiO2 film is −34.0 mV) [Reference Seo, Gowda, Khajornrungruang, Hamada, Song and Babu12]. Different types and characteristics of particle motions observed at pH 7 will be discussed in the subsequent section. The increases seen in the space covered by the particles with pH corroborate the findings from potential energy curves that showed that the separation distance increases with pH due to weakening of the attractive forces at higher pH values [Reference Seo, Gowda, Khajornrungruang, Hamada, Song and Babu12].
Mean square displacement (MSD) of any particle along its trajectory can be obtained at various lag times τn (τn = nΔt, n = 1, 2, … N − 1) using the definition [Reference Huang, Watson, Dempsey, Suh, Weissig, Elbayoumi and Olsen24,Reference Jeon, Leijnse, Oddershede and Metzler25]
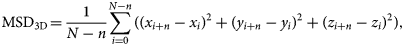 $$ \! {\rm MS}{\rm D}_{3{\rm D}} \! = \displaystyle{1 \over {N-n}}\sum\limits_{i = 0}^{N-n} {\lpar {\lpar x_{i + n}-x_i\rpar }^2 + {\lpar y_{i + n}-y_i\rpar }^2 + {\lpar z_{i + n}-z_i\rpar }^2\rpar },$$
where N is the total number of time frames (N = 500) over which the trajectories were imaged, Δt is the time interval between two consecutive image frames (40 ms in our case) defined by the frame acquisition rate, and n is the number of the time intervals. Also, (x i+n, y i+n, and z i+n) are the positions of the particle at time nΔt after starting at position (xi, y i, and zi) at t = 0. Again, at any time, the particle positions are given by those of its centroid where the highest intensity occurs, determined by fitting a Gaussian profile using the Diatrack software as described in the Experimental section.
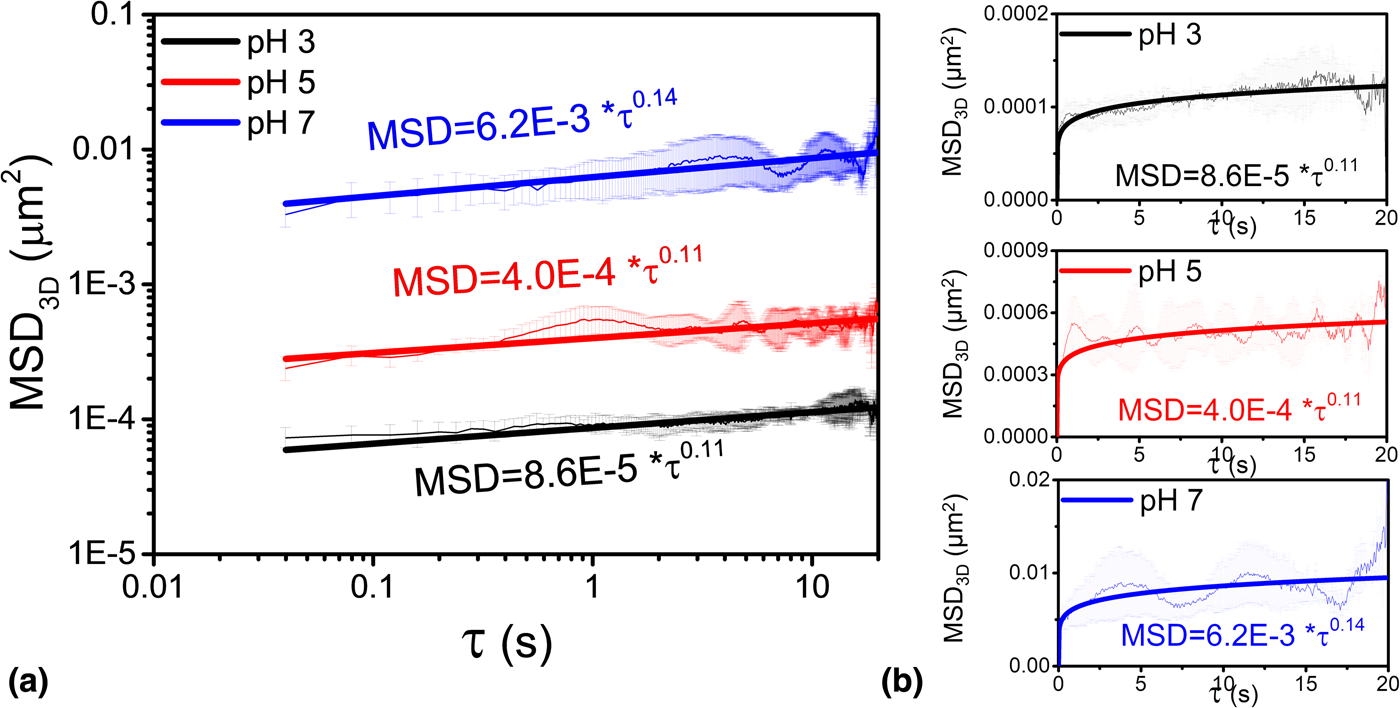
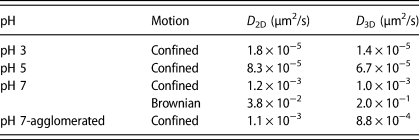
Figure 4 shows the MSD3D curves at three different pH values. MSD3D of single ceria particles at pH 3, 5, and 7 increased with increasing τ, and this trend is similar to that observed in the case of 2D data [Reference Seo, Gowda, Khajornrungruang, Hamada, Song and Babu12]. If a particle shows anomalous diffusion, its MSD3D exhibits a nonlinear relationship with τ, expressed by a power law of the form MSD3D = 6D 3Dτa where D 3D is three-dimensional diffusion coefficient and a is the exponent that determines the types and characteristics of particle motions [Reference Ben-Avraham and Havlin26,Reference Havlin and Ben-Avraham27,Reference Höfling and Franosch28]. If 0 < a < 1, the motion is said to be confined or sub-diffusive, Brownian if a = 1, and super-diffusive if a > 1 [Reference Ben-Avraham and Havlin26,Reference Havlin and Ben-Avraham27,Reference Höfling and Franosch28]. In our case, the value of the exponent a obtained by fitting the data is ~0.11 for pH 3 and 5 and ~0.14 for pH 7 confirming confined motion of the particle. The associated three-dimensional diffusion coefficients D 3D are 1.4 × 10⁻⁵, 6.7 × 10⁻⁵, and 1.0 × 10⁻³ μm2/s, at pH values of 3, 5, and 7, respectively. These D 3D values are the mean values of the diffusion coefficients of three different single particles calculated for the same experimental conditions. The calculated values of D 3D increase significantly with increasing pH, with the D 3D at pH 7 being roughly 70 times higher than that at pH 3, reflecting the weaker attractive interaction forces between the particles and the glass surface at the higher pH.
Mean square displacement, MSD3D as a function of lag time τ. (a) log–log plots and (b) linear–linear plots. The data were fitted to MSD3D = 6D 3Dτa, where D 3D is the three-dimensional diffusion coefficient. The exponent a was found to be 0.11, 0.11, and 0.14 for the three different pH values of 3, 5, and 7, respectively. The shaded regions around each line indicate the ranges for MSD determined from the data on three different particles.
Two types of 3D trajectories of single ceria particles, one with confined and one with Brownian motion, and a third type of an agglomerated cluster, all at pH 7
Two entirely different particle motions of single ceria particles in 2D (x–y) plane were observed at pH 7 [Reference Seo, Gowda, Khajornrungruang, Hamada, Song and Babu12]. As explained above, the motion of particle 1 was similar to the confined motion that was observed at pH 3 and 5. In the second case (particle 2), the particle moved rapidly and moved far away from the glass surface and sometimes disappeared from the field of view. Therefore, the second particle could be tracked for a time period of only 5 s which yielded a sequence consisting of only 125 images that covered the space between ~−1500 and ~1500 nm in the x- and y-directions and between ~5 and ~270 nm in the z-direction [Fig. 5(a)]. In contrast, the particle showing confined motion could be tracked for the complete 20 s since it moved in a much smaller area of 300 × 300 nm2 and smaller vertical distance along a z-axis of 150 nm (Fig. 3). Analysis of the MSD3D [Fig. 5(c)] of the second particle showed that it is undergoing Brownian motion since the exponent a is ~1, while the first particle is undergoing confined motion since a is 0.14 as shown in Fig. 4. This difference is a consequence of the zeta-potential of ceria particles at pH 7 being close to 0 mV [Reference Seo, Gowda, Khajornrungruang, Hamada, Song and Babu12]. This means that while both positive and negative charges exist on the particle surface at the same time in different regions, they counterbalance each other. Several authors reported the non-uniform distribution of zeta-potential on the particle surface and their standard deviation among different regions [Reference Velegol, Feick and Collins29,Reference Feick and Velegol30,Reference Velegol and Thwar31]. In our case, if it so happens that the attractive interaction of the positively charged parts on the surface of a specific particle with the negatively charged glass surface is dominant, then it results in confined motion. If either the local repulsion induced by the negative charge on the particle surface or the weakened attraction due to the net value of the zeta-potential being close to zero is dominant, then the particle can move further away from the glass surface resulting in Brownian motion. In such a case, the weakened interaction allows the particle to move farther and faster from the glass surface as seen in our measurements. As such, the particle with Brownian motion can move ~270 nm away from the glass surface, while the particle with confined motion can only move up to ~150 nm.
3D trajectories of (a) single ceria particle with Brownian motion and (b) agglomerated cluster and single ceria particle with confined motion all at pH 7 and (c) the corresponding MSD3D data as a function of τ; log–log plots and linear–linear plots. The exponent a for MSD3D for single ceria particle with Brownian motion (red) and an agglomerated cluster (black) are 1.05 and 0.22, respectively. 3D trajectory of the single particle with confined motion is the same as that shown in Fig. 3.
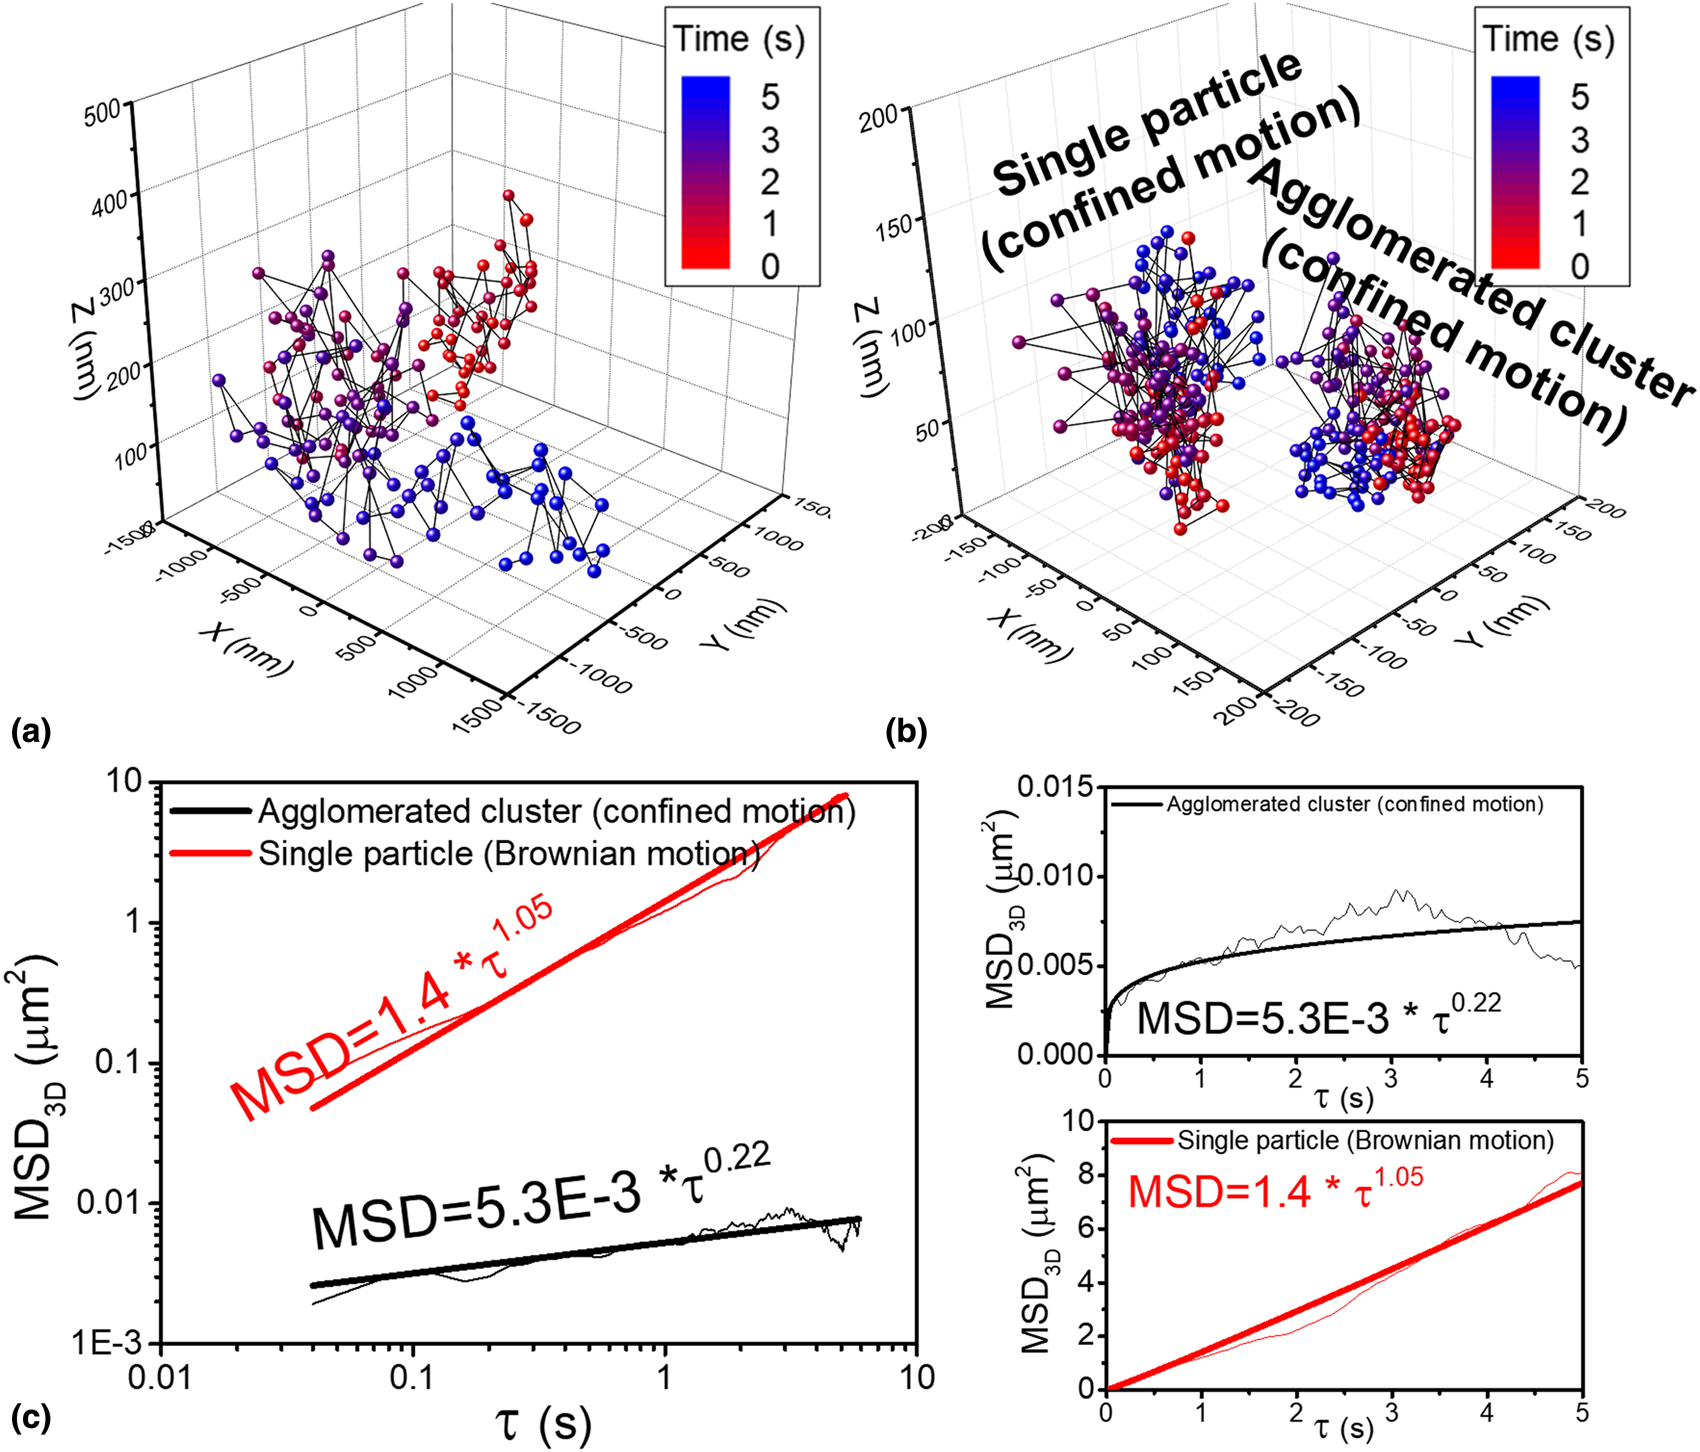
Additionally, since the zeta-potential of ceria particle at pH 7 is close to 0 mV, particle agglomeration occurs. Agglomeration of particles in colloidal dispersions is well known and occurs when the zeta-potential is very low and is caused by the dominance of van der Waals attraction [Reference Seo, Gowda, Khajornrungruang, Hamada, Song and Babu12,Reference Seo, Paik and Babu32,Reference Sigmund, Bell and Bergström33]. Among many agglomerated clusters observed in the imaged area, one such agglomerated cluster (particle 3) was chosen as a representative sample. The 2D trajectory of the agglomerated cluster (particle 3) was obtained by tracking local highest EW scattering intensity (closest to the glass surface) of the cluster and fitting it to a Gaussian function using the particle tracking software [Reference Vallotton, Van Oijen, Whitchurch, Gelfand, Yeo, Tsiavaliaris, Heinrich, Dultz, Weis and Grünwald17] and then combined with the distance of the agglomerated cluster from the glass surface in the z-direction to generate its 3D trajectory [Fig. 5(b)]. Analysis of the MSD3D of this cluster showed that it is undergoing confined motion since a is ~0.2 [Fig. 5(c)].
The D 3D of the single particle undergoing Brownian motion (2.0 × 10⁻¹ μm2/s) is about 200 times higher than that of the particle with confined motion (1.0 × 10⁻³ μm2/s). The D 3D of the agglomerated cluster (8.8 × 10⁻⁴ μm2/s) is only slightly lower than that of the particle with the confined motion, perhaps because of the gravitational attraction. The D 3D values are summarized in Table 1 along with the D 2D values that were calculated earlier from MSD2D curves (MSD = 4D 2Dτa) [Reference Seo, Gowda, Khajornrungruang, Hamada, Song and Babu12]. The D 3D of the single ceria particles at pH 3, 5, and 7 and of the agglomerated clusters at pH 7 showing confined motion were slightly lower than their D 2D (Table 1), presumably due to the attractive interaction forces along the z-directions.
Summary of D 2D and D 3D of ceria particles near a glass surface at pH 3, 5, and 7 obtained from their respective MSD data as a function of lag time τ. D 2D values are from our previous paper [Reference Seo, Gowda, Khajornrungruang, Hamada, Song and Babu12].
The bulk diffusion coefficient (D 0) of the ceria particles obtained from dynamic laser scattering (DLS) measurements based on the Stokes–Einstein equation has a value of 3.0 μm2/s [Reference Seo, Gowda, Khajornrungruang, Hamada, Song and Babu12], but the D 3D of even the particle exhibiting Brownian motion at pH 7 calculated from MSD3D is only 0.2 μm2/s [Fig. 5(c)], a value that is 15 times smaller. The diffusion coefficients along x-, y-, and z-directions of a particle undergoing Brownian motion used in DLS experiments are the same, Dx = Dy = Dz, due to the homogeneous environment. Also, the equation used to calculate diffusion coefficients using DLS does not consider any external forces (e.g., repulsive or attractive forces) acting on a particle. However, our system here is aimed at studying particle–surface interactions that influence particle motion, and the much lower D 3D values obtained from our experiments as compared to D 0 are likely due to the electrostatic attractive forces prevailing between ceria particles and glass surface.
In the next section, we will discuss how the pH-dependent 3D trajectories, three-dimensional diffusion coefficients, and interaction potential energy data (obtained in our previous paper [Reference Seo, Gowda, Khajornrungruang, Hamada, Song and Babu12]) of ceria particles near a glass surface are related to their removal by repeated washing with DI water adjusted to pH 10 and 12.
Removal of ceria particles from a glass substrate as a function of the number of washes at pH 10 and 12
Ceria particle-based slurries have been widely used for SiO2 polishing, especially for shallow trench isolation (STI) chemical mechanical planarization (CMP) because of their high chemical affinity toward SiO2 films [Reference Srinivasan, Dandu and Babu34]. However, this affinity presents a major challenge for post-CMP cleaning as the particles strongly adhere to the wafer surface during polishing [Reference Seo, Gowda and Babu5,Reference Gowda, Seo, Ranaweera and Babu35]. With device dimensions, now at 7 nm, continuing to shrink, there is a strong need to understand various chemical and mechanical phenomena that occur in the brush cleaning systems used to remove these particles. Here, we show the relationship between 3D trajectories, three-dimensional diffusion coefficients, and interaction potential energy data of ceria particles and particle cleaning using pH-adjusted de-ionized water (DIW), as imaged by EW spectroscopy. While the actual post-CMP cleaning of oxide surfaces is a very complex engineering process, the results obtained here provide valuable insights. As stated earlier, the flat glass surface of the lens became our model for the SiO2 film surface of interest here.
50 μL of a ceria slurry was placed on the glass surface and imaged after 20 min. Figure 6 displays the EW images of ceria particles left on the glass surface (covering an area of 77 × 77 μm2) at pH 3, 5, and 7 and cleaned for 40 s using a water jet from a simple spray bottle containing DIW adjusted to pH 10 and 12 and then imaged as a function of the number of washes. The higher pH values were chosen for cleaning to benefit from the repulsive forces at these values between ceria particles and glass surfaces. The number of ceria particles initially present on the glass surface decreased with an increase in pH (~2950 at pH 3, ~1530 at pH 5, and ~427 at pH 7). After cleaning, the number of residual ceria particles on the glass surface was determined as a function of the number of washes at both pH 10 and 12 (Fig. 7). The corresponding cleaning efficiencies, defined as the number of particles remaining as a percent of the particles initially present, are summarized in the inset in Fig. 7.
EW microscopy images of ceria particles adsorbed at (a) pH 3, (b) pH 5, (c) pH 7 and their removal using DIW adjusted to pH 10 and 12 as a function of number of washes. The first image in each row was captured 20 min after placing the sample on the lens. The subsequent images were obtained after washing the particles from the lens. The first and second rows in each panel display the EW scattering images of residual ceria particles after washing with DIW adjusted to pH 10 and 12, respectively. N is the number of ceria particles on the glass surface.
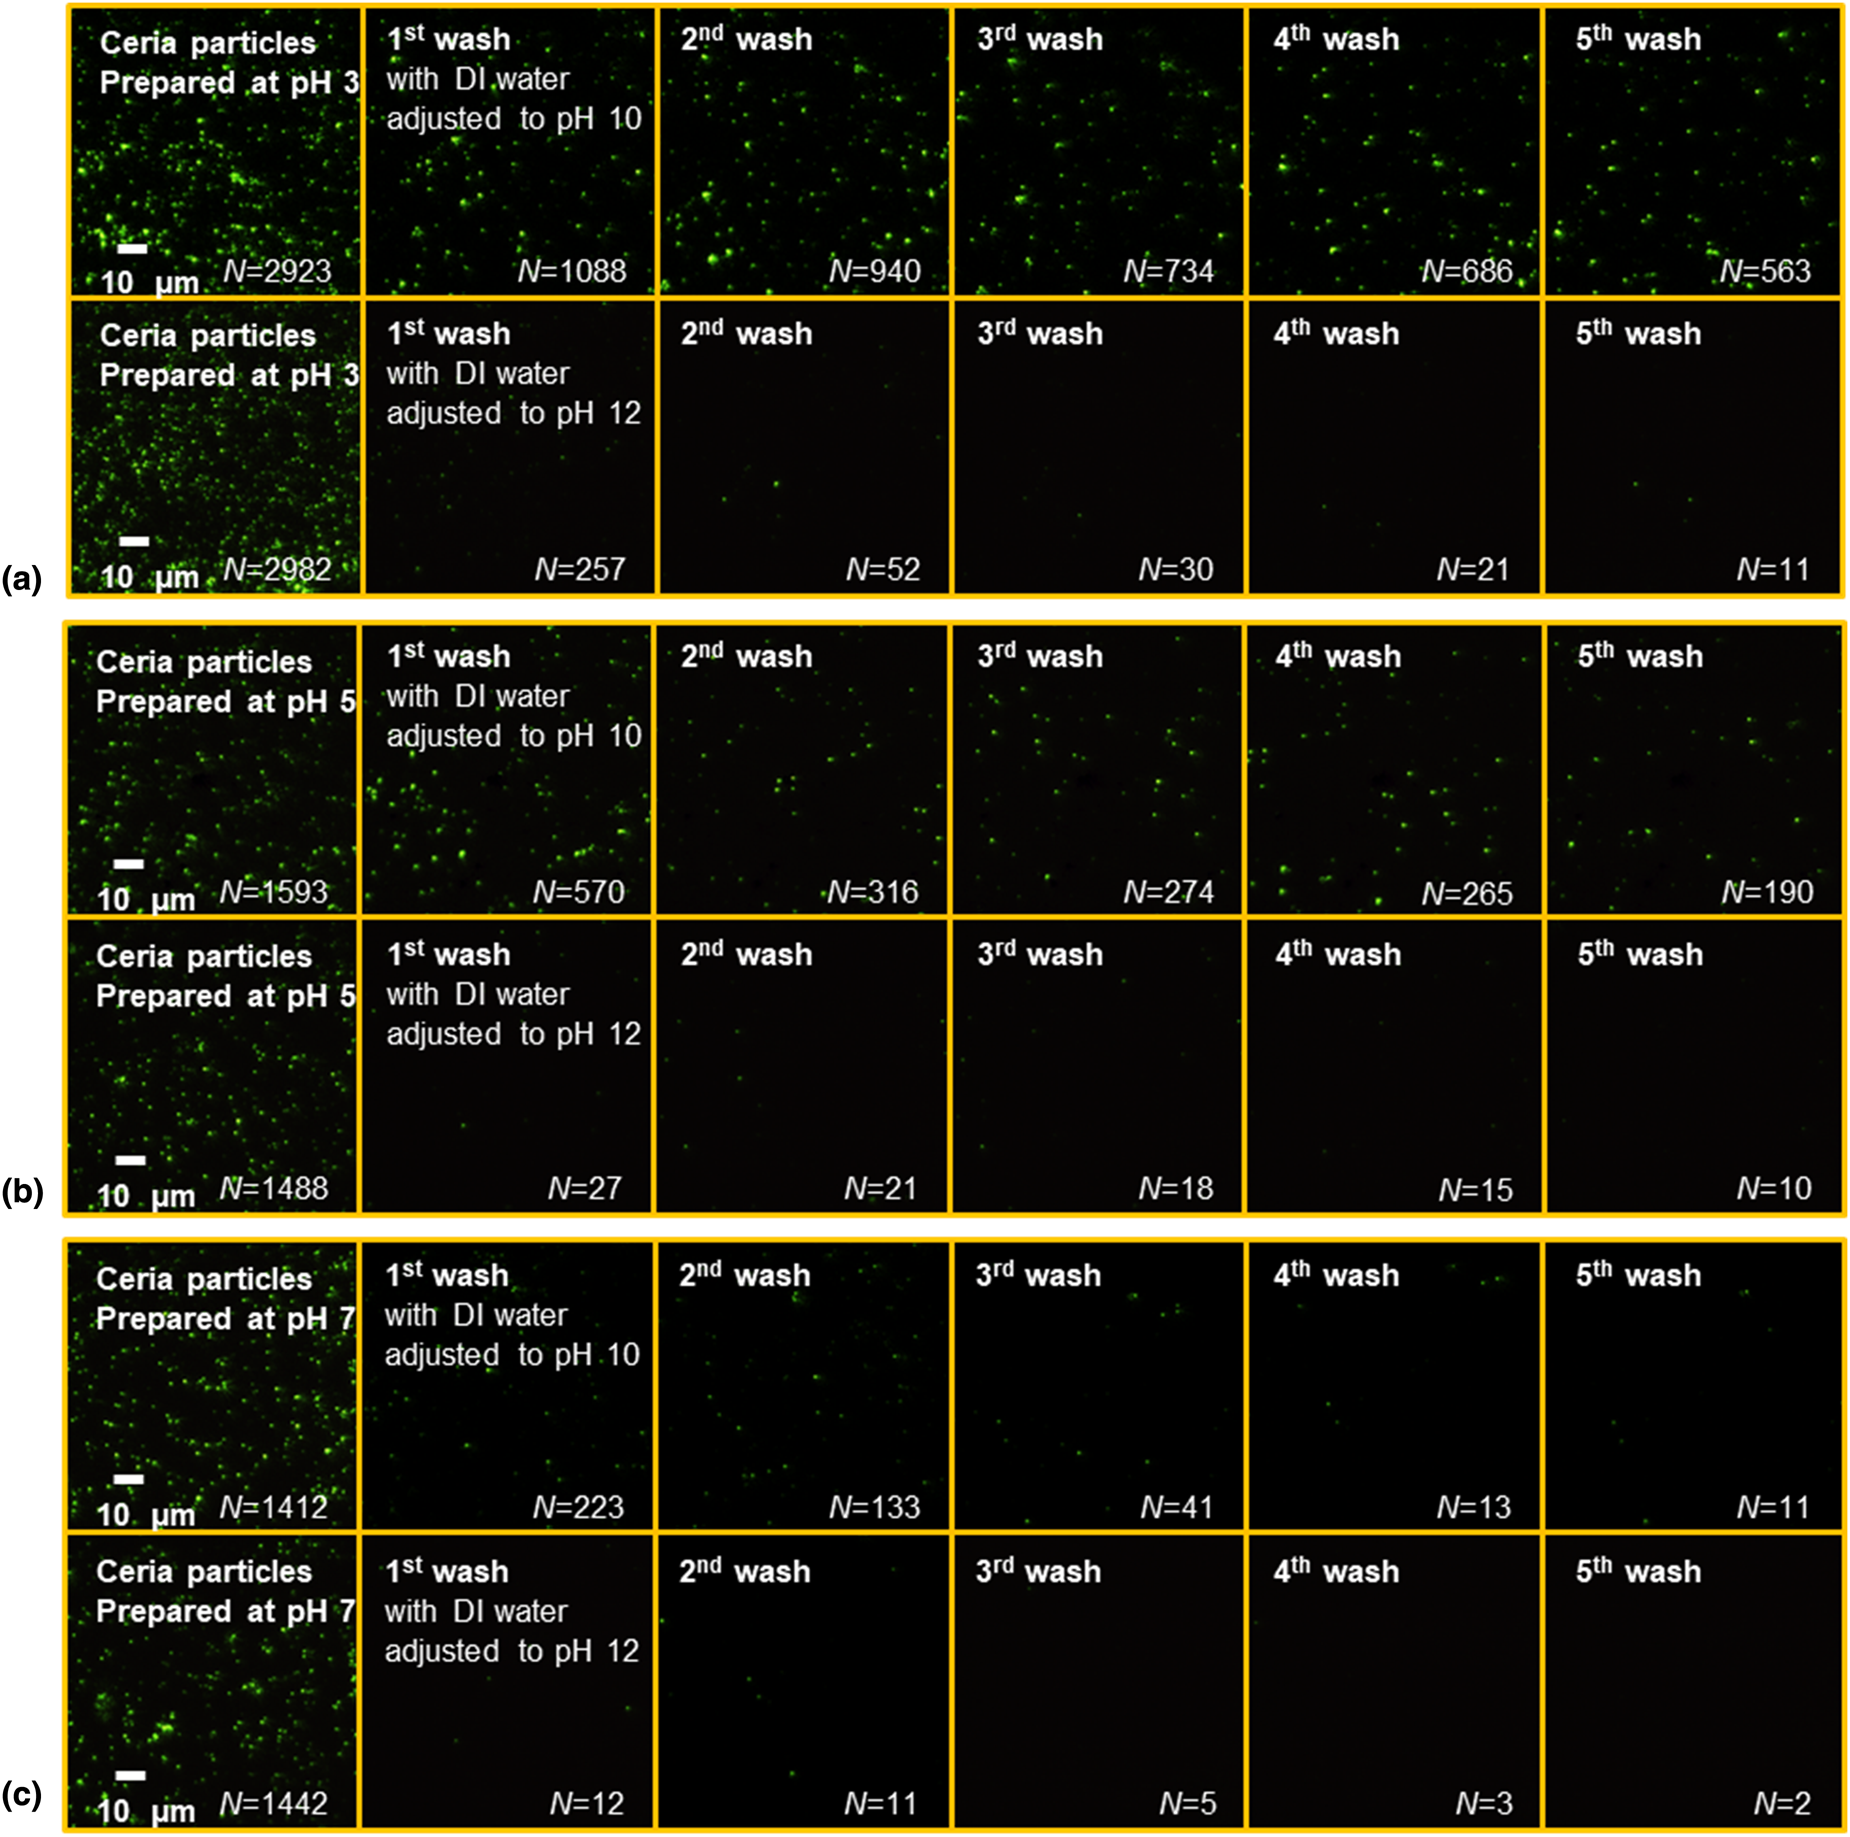
Number of ceria particles calculated from EW microscopy images shown in Fig. 6 at (a) pH 3, (b) pH 5, and (c) pH 7 and their removal as a function of the number of washes using DIW adjusted to pH 10 (filled symbols) and pH 12 (open symbols). Inset shows the corresponding cleaning efficiencies.
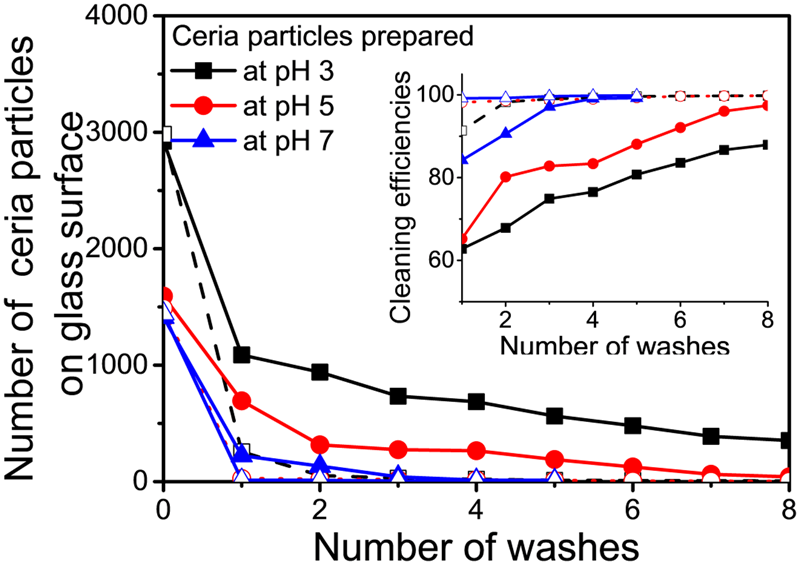
Cleaning efficiencies of DIW adjusted to pH 10 and 12 for removal of ceria particles from the samples prepared at pH 3 reached 88% and 99% [Fig. 6(a)], respectively, after 8 washes. In contrast, particles on the samples prepared at pH 5 [Fig. 6(b)] and pH 7 [Fig. 6(c)] can be cleaned with higher efficiencies at both pH 10 and 12 after only 3 or 4 washes. These results are consistent with the above 3D trajectory data and the measured interaction potential energy data [Reference Seo, Gowda, Khajornrungruang, Hamada, Song and Babu12] that showed that ceria particles at pH 3 can remain closer to the glass surface making them more difficult to be cleaned when compared to particles at pH 5 and 7 which can move farther and faster from the glass surface due to the weakening of the attractive forces [Reference Seo, Gowda, Khajornrungruang, Hamada, Song and Babu12]. Earlier, we demonstrated the ceria particles adsorbed on oxide surfaces via strong Ce–O–Si bond could not be removed effectively by only charge repulsion [Reference Seo, Gowda and Babu5]. pH-adjusted DIW (pH 13.5) showed negligible cleaning efficiency (<5%) for 90 nm ceria particles, even when aided by ultrasonic cleaning [Reference Seo, Gowda and Babu5]. In this study, ceria particles move near the glass surface at pH 3, 5, and 7 without the formation of strong Ce–O–Si bonds with the glass surface, and hence DIW adjusted to pH 10 and 12 was able to remove them from the surface by only charge repulsion. While charge repulsion is known to be a key driver of cleaning performance, our data provide a quantitative measure of this effect. This is especially true for the larger particles used here since we recently showed that smaller (sub-50 nm) ceria particles with a higher surface concentration of Ce3+ adsorbed on oxide surfaces cannot be removed effectively by only charge repulsion because they are more strongly coupled with oxide surfaces via strong Ce–O–Si bonds [Reference Seo, Gowda and Babu5]. Such smaller particles can be removed only after breaking this bond and not by just relying on electrostatic repulsion [Reference Seo, Gowda and Babu5].
3D versus 2D data analysis and results
One can argue that the calculation of MSD of particles traveled in 3D, and the 3D diffusion coefficients did not provide any new insights beyond those obtained from a 2D analysis. However, this in itself is remarkable since we would not have predicted it beforehand and may not apply to all systems. We find, for example, that while particles are easily removed during cleaning, significant particle redeposition occurs and prevents complete particle removal using a rotating PVA brush, a common practice in the industry to clean wafers post-CMP. Particle redeposition is determined by the diffusion and/or convective transport in the thin liquid film, where the 3D trajectories and diffusion coefficients matter, between the glass and the porous PVA brush surfaces. These processes are being imaged and analyzed now using EW spectroscopy [Reference Terayama, Khajornrungruang, Suzuki, Kusatsu, Hamada, Wada and Hiyama16].
Furthermore, using our extended methodology and based on the techniques developed to study brush cleaning, it should be possible to image pad/wafer and pad/abrasive (ceria or silica)/wafer contact during polishing—something that has not been possible so far—using model wafer coupons and polishing pad pieces. Finally, one might be able to investigate the behavior of smaller ceria and other particles using only 2D data since gravitational effects will be lower.
Conclusions
pH-dependent 3D trajectories, diffusion coefficients, and interactions of ceria particles with a glass surface, representing a SiO2 surface, were investigated using EW microscopy with implications for ceria particle cleaning on SiO2 surfaces relevant to semiconductor manufacturing processes. Ceria particles showed only confined or sub-diffusive motion at pH 3 and 5, while both confined and Brownian motion were exhibited at pH 7. The D 3D of ceria particles showing confined motion increased with pH due to weaker attractive forces between ceria particles and the glass surface at higher pH values. The D 3D of the particle undergoing Brownian motion (2.0 × 10⁻¹ μm2/s) at pH 7 was almost 200 times higher than that exhibiting confined motion (1.0 × 10⁻³ μm2/s) at the same pH. The D 3D values of agglomerated clusters and single ceria particles exhibiting confined motion were slightly lower than the D 2D values because of the attractive forces along the z-directions. The D 3D values from experiments were much lower than the bulk diffusion coefficient, likely due to the attractive forces between ceria particles and the glass surface. Ceria particles on the glass surfaces deposited at high pH were more easily removed from glass surfaces during the cleaning process due to the weaker attractive interaction forces between the particles and the glass surface consistent with their 3D trajectories.
Experimental Techniques, Materials, and Experimental Procedures
EW microscopy setup and data analysis
In our experimental setup, an EW is generated when the laser light beam having 15 mW power at 532 nm wavelength (Edmund Optics, Barrington, NJ, USA) undergoes total internal reflection at the glass lens-ceria suspension interface [Reference Seo, Gowda, Khajornrungruang, Hamada, Song and Babu12,Reference Pal, Khajornrungruang, Netzband, Alety and Babu13,Reference Khajornrungruang, Korkmaz, Angshuman, Suzuki, Kimura and Babu14]. The incident angle θi was adjusted to 69.5 ± 1.0°, and the penetration depth β of the EW field was 88.0 ± 4.5 nm. The penetration depth was calculated as β = λ/4π (n 12sin2θi – n 22)−1/2, where λ is the wavelength of the incident light, θi is the incident angle, and n 1 and n 2 are the refractive indices of glass and suspension, respectively. The EW scattered light passes through a 50× objective lens (Nikon, Japan) and hits a dielectric coated right-angled prism mirror where it gets reflected. The reflected light is refocused by an infinity-corrected tube lens (Thorlabs, USA). The particles in the sample suspension placed on the glass lens surface are detected using a CMOS camera (Baumer, USA) at a resolution of 13.37 pixels/μm. This homemade EW microscopy system was used to image interactions of ceria particles near a glass lens surface in real time using the software microDisplay 5.2.2 (Silicon Software GmbH, Germany). The videos captured 500 images with dimensions of 1024 × 1024 pixels (77 × 77 μm2) for 20 s. The EW images and videos were analyzed using the particle tracking software Diatrack v3.04 (Semasopht, Switzerland) [Reference Vallotton and Olivier36]. Particles were detected by fitting 2D Gaussian functions based on a specified intensity threshold. 2D trajectories of a single-specific ceria particle were obtained by linking particle's positions (i.e., centroids) as a function of time. The closest distance h between a particle and the glass surface can be determined using the relation between intensity and height: I(h) = I 0 exp(–β−1h) [Reference Prieve18], where I 0 is the intensity at the ceria particle–glass surface contact and β is the penetration depth (88.0 ± 4.5 nm). The 3D positions of these particles were obtained by combining the separation distance h in the z-direction with the positions in the 2D (x–y) plane. 3D trajectories of these particles were then constructed by linking their time-sequenced positions. Three-dimensional mean square displacement (MSD3D) as a function of τ was calculated and plotted using Labview (National Instrument Corp, USA). All experiments were performed at room temperature to minimize laser-induced heating of the particles. The heating of the particles due to the absorption of the laser light can be affected by the wavelength and power of the light source and the environmental conditions. Given the results reported by Liu et al. [Reference Liu, Cheng, Sonek, Berns, Chapman and Tromberg37,Reference Liu, Sonek, Berns and Tromberg38], less than 1 °C change in the local temperature at the particle–glass interface in our experiments conditions is expected, which is negligible. The details of EW microscopy setup, the experimental conditions, and data analysis were reported in our earlier publications [Reference Seo, Gowda, Khajornrungruang, Hamada, Song and Babu12,Reference Pal, Khajornrungruang, Netzband, Alety and Babu13,Reference Khajornrungruang, Korkmaz, Angshuman, Suzuki, Kimura and Babu14].
Materials and experimental procedures
Ceria slurry with a mean particle diameter of ~140 nm was supplied by Ferro Electronic Materials. A dilute suspension of ceria particles (0.005 wt%) was prepared and subsequently sonicated to minimize particle aggregation. pH of the ceria suspension and DIW was adjusted to the desired value using HNO3 or KOH. 50 μL of the ceria suspension was placed on the glass lens surface and imaged in real time using EW microscopy. First, a background or baseline image of the lens (without any liquid) was obtained. 50 μL of ceria slurry was then placed on the glass surface and imaged after waiting for 20 min to determine the number of the ceria particles on the glass surface.
The lens covered with ceria particles was removed from the lens mount and subsequently washed multiple times, each time with ~40 mL of a cleaning solution (DIW adjusted to pH 10 and pH 12) sprayed from a squeeze bottle for 4 s (flow rate of ~10 mL/s) and then imaged. The number of particles on the lens surface was calculated before and after each wash from the EW images using Diatrack v3.04 and the particle cleaning efficiencies were determined from these values.
Acknowledgments
The authors gratefully acknowledge EBARA Corporation for providing partial financial support and Ferro for supplying ceria slurry.


 Open access